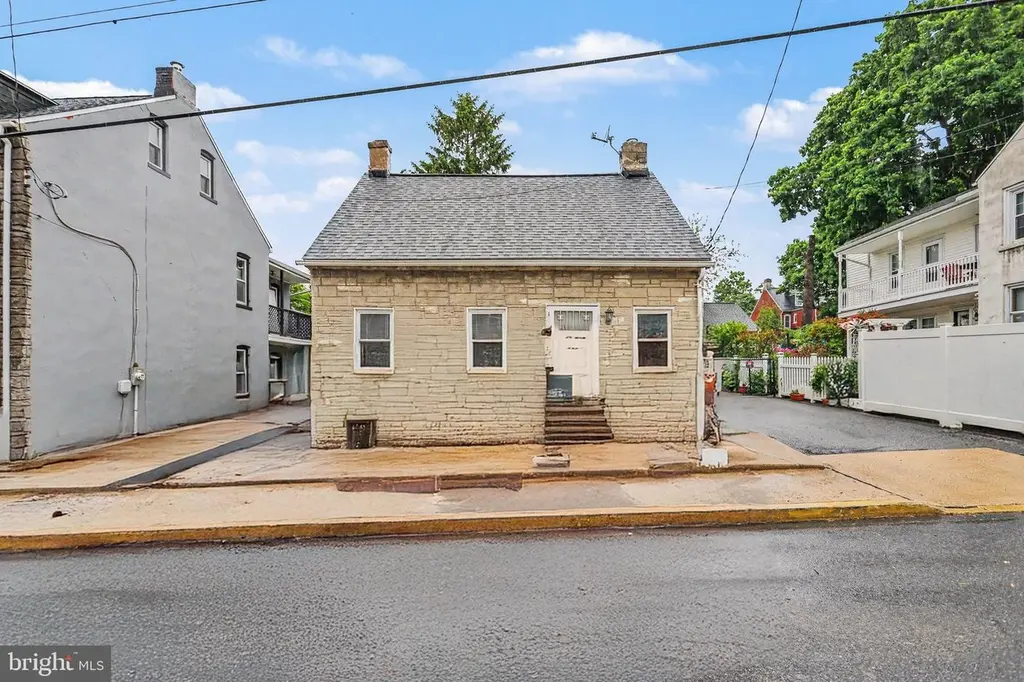
523 High St · Lancaster, PA
Flood risk 1/10 · Minimal
- FEMA flood zone
- X (unshaded)
- Chance of flooding over 30 yrs
- 0.0%
- Est. flood insurance / yr
- $507 – $1,088
Fire risk 1/10 · Minimal
- Est. fire insurance / yr
- $511 – $949
Heat risk 6/10 · Moderate
- Hot days now (above 101°F)
- 7 days/yr
- Hot days in 30 yrs
- 15 days/yr
Wind risk 4/10 · Minor
- Chance of severe wind over 30 yrs
- 16.0%
Air-quality risk 4/10 · Minor
- Unhealthy air days now
- 4 days/yr
- Unhealthy air days in 30 yrs
- 7 days/yr
Risk factors via First Street. Map © Google.
Why this score? — see what drove the C- grade
The composite is a weighted blend of 9 inputs, each scored 0–100. Each bar is that input's sub-score; the figure is the points it added to the 100-point composite (weight × sub-score).
- Cash flow +17.2/30.0
- ARV discount +13.3/15.0
- DSCR +5.4/10.0
- 1% rule +4.5/10.0
- Livability +4.2/5.0
- Rent growth +2.6/5.0
- Condition / age +2.5/5.0
- Schools +1.6/10.0
- Appreciation +0.0/10.0
$185,000
🖨 Deal sheet 📄 Offer letter ✓ Due diligence
Listing remarks
Step into a charming piece of history with this classic 1860 traditional home, brimming with timeless character and exciting potential. Nestled on a city lot, this detached residence offers 1,258 sq. ft. of inviting living space — the perfect opportunity for buyers looking to add their personal touch while enjoying the charm of a historic property. Inside, hardwood floors flow through the combined living and dining area, where natural light fills the space and a cozy fireplace creates an inviting focal point. The kitchen is equipped with essential appliances, including a gas oven/range and refrigerator, offering a functional starting point for future updates and customization. The ho
Key facts
- Private patio
- Cozy fireplace
- Hardwood floors
Tags
Property features AI
Finance
- Other: Not in a federal flood zone; 2+ access exits (accessibility feature)
Exterior
- Parking: On-street parking
- Utilities: Public water; Public sewer; Natural gas
- Home design: Detached property; Very good condition; Fee simple ownership
- Construction: Stucco and masonry construction; Block foundation; Shingle roof; Built year recorded by assessor
- Exterior features: Patio; Chain link fencing; Shed
Interior
- Kitchen: Gas oven/range; Refrigerator
- Bedrooms: Three bedrooms on the main level
- Flooring: Hardwood; Laminate; Carpet
- Bathrooms: One full bathroom
- Heating & cooling: Forced air heating; Natural gas heating and hot water
- Interior features: Tub shower; Ceiling fans; Combination dining and living area; Wood floors; Carpet
- Laundry & utility: Washer and dryer; Laundry in basement
Neighborhood map
What this means for you Summary
Snapshot
- This is a 3-bed/1.0-bath single-family listed at $185k.
Deal economics
- At list price, monthly cash flow is $131 ($2k/yr) — positive.
- The deal already cash-flows at list — no discount required.
- To meet the 1% rule (rent ≥ 1% of price), the offer needs to be $176k (5.1% below list).
- Recommended offer: $176k (5.1% below list) — sets the bar for 1% rule.
- Cap rate 7.1% vs local median 4.2% in Lancaster — top-decile yield for the area; either an underpriced asset or a hidden risk that comps aren't pricing in. Stress-test before assuming the spread holds.
Location & tenants
- Location reads 85/100 on livability (#71 in PA, #498 nationally) — a professional / high-income tenant draw. Strengths: amenities A+, commute A+, cost of living A+; Watch: crime C-, employment C-.
- Lancaster SD (urban): math 12% / reading 25% proficiency, ranked #500 of 539 in PA (top 93%) — low school quality limits family demand, transient renter base, plan for 1-2y turnover; 72% free/reduced lunch — lower-income household profile, screen leases tightly.
- Market conditions: Rents flat; 292 active listings in the ZIP; 40 comparable units currently listed for rent nearby; rentals at typical pace (median 24d on market — plan ~3-4 weeks tenant-placement turnaround); 45% of comp listings sitting > 30 days — soft ceiling on asking rent; solid renter incomes; 1,093 units permitted in Lancaster County in 2024 (201 in 5+ unit buildings).
Forward outlook
- Local home prices are declining (-3.0%/yr); year-one equity from $1k of loan paydown is wiped out by about $6k of value loss. Plan a longer hold.
- Lancaster County population projected at +5% by 2050 — modest demand growth; plan on rents tracking national, not racing it.
Negotiation context
- It's been on market 37 days — a 3% lower offer ($179k) is reasonable based on typical stale-listing flexibility.
- Current owner paid $51k; list at $185k implies a 263% gain — meaningful room to come down on a strong offer.
Risks & watch-outs
- Watch-outs: built in 1860 — expect roof / HVAC / electrical / plumbing capex.
- Climate carrying-cost: extreme-heat days projected 7→15/yr by 2055 (HVAC capex compounding) — expect insurance premiums to compound above CPI over the hold.
Questions for the listing agent
- It's been on market 37 days. Have you received any prior offers? Is the seller open to a 5% concession, seller financing, or rate buy-down credit?
- Built in 1860 — when were the roof, HVAC, electrical panel, plumbing, and water heater last replaced?
- Is there a deadline driving the sale (1031 exchange, divorce, estate, relocation)? That informs how much negotiation room exists.
- What's the average days-on-market for RENTAL listings here right now (not sales)? A rising rental-DOM trend means longer vacancies and softer asking-rent achievability than the comps imply.
- What's the recent tenant-quality profile in this submarket — average credit score on applications, eviction rate, late-payment / NSF rate, and stable-employment percentage? A property-management company in the area should have these aggregated.
- How much new for-sale + rental construction is in the pipeline within 1–3 miles? Heavy new supply typically softens prices + rents 12–24 months out; constrained supply supports both.
Investment metrics
- 1% rule
- 0.95% ✗
- Cap rate
- 7.14%
- Cash-on-cash
- 3.03%
- DSCR
- 1.14
- GRM
- 8.8
CMA / ARV
- ARV (median comp)
- $212,491
- List price
- $185,000
- Delta
- -12.94%
- Verdict
- UNDERPRICED
- Comps
- 20 within 1.0 mi
Show comp detail 12 sales within ~0.75 mi
| Address | Dist | Beds/Ba | Sqft | Sold | Price | $/sf | Match |
|---|---|---|---|---|---|---|---|
| 632 High St | 0.13mi | 3/1.0 | 1,287 (+2%) | 6mo | $209,900 | $163 | 85 |
| 329 Mill St | 0.37mi | 3/1.0 | 1,307 (+4%) | 7mo | $200,000 | $153 | 70 |
| 753 High St | 0.32mi | 2/1.0 (-1) | 1,299 (+3%) | 7mo | $185,000 | $142 | 68 |
| 129 Old Dorwart St | 0.13mi | 3/1.0 | 1,079 (-14%) | 5mo | $170,000 | $158 | 66 |
| 730 High St | 0.28mi | 3/1.5 | 1,118 (-11%) | 4mo | $232,950 | $208 | 63 |
| 816 W Vine St | 0.38mi | 3/1.5 | 1,176 (-6%) | 8mo | $295,000 | $251 | 63 |
| 474 Poplar St | 0.15mi | 2/2.5 (-1) | 1,359 (+8%) | 11mo | $307,000 | $226 | 60 |
| 117 Nevin St | 0.36mi | 3/1.5 | 1,424 (+13%) | 2mo | $223,000 | $157 | 58 |
| 433 Hillside Ave | 0.38mi | 2/1.0 (-1) | 1,151 (-8%) | 6mo | $259,900 | $226 | 58 |
| 114 S West End Ave | 0.59mi | 3/1.0 | 1,371 (+9%) | 10mo | $290,000 | $212 | 49 |
| 1032 High St | 0.60mi | 3/1.0 | 1,127 (-10%) | 12mo | $232,500 | $206 | 45 |
| 206 Hershey Ave | 0.67mi | 2/1.5 (-1) | 1,142 (-9%) | 11mo | $295,000 | $258 | 37 |
Match score weights: distance 35% · size 25% · config 20% · recency 20%. Top-matched comps best support the ARV.
Projected returns pro-forma
-3.0% appreciation · 0.47% rent growth · sell at horizon
- IRR
- -14.4%
- Equity multiple
- 0.50×
- Total profit
- $-25,982
- Equity at exit
- $27,584
- IRR
- -10.3%
- Equity multiple
- 0.44×
- Total profit
- $-28,837
- Equity at exit
- $15,995
Cash invested: $51,800 (down + closing). Projections, not guarantees.
Landlord ↔ Tenant lean methodology
- Overall (STATE)
- 62 Landlord-Friendly
- State Pennsylvania
- 62 Landlord-Friendly · EVEN
- County
- — inherits STATE
- City
- — inherits STATE
ZIP-level market 17603
- Rents YoY
- 0.5%
- Active inventory
- 292
- Price-to-rent
- 8.8×
Monthly cashflow live
- Estimated rent
- $1,756 high interval (Pro) →
- Mortgage (P&I)
- −$970
- Tax from tax record
- −$209 /mo · $2,508/yr
- Insurance
- −$77
- HOA
- −$0
- Vacancy / Maint / Mgmt
- −$369
- Net cashflow
- $131
Break-even live
UW: 25.0% down · 7.5% · 30yr · 1.5% tax · 5.0% vac · 8.0% maint · 8.0% mgmt
Financing live
Cash to close
- Down payment
- $46,250
- Closing costs
- $5,550
- Reserves months
- —
- Total cash needed
- —
Loan-product check · same deal, 3 products live
Conventional
25% down · 7.5% · 30yr
- Down + closing
- —
- Monthly P&I
- —
- Monthly cashflow
- —
- DSCR
- —
- Eligible?
- —
Personal DTI + credit; lowest rate.
DSCR
20% down · 8.5% · 30yr
- Down + closing
- —
- Monthly P&I
- —
- Monthly cashflow
- —
- DSCR
- —
- Eligible?
- —
No personal income docs; deal must DSCR.
Hard money
10% down · 12.0% · 12mo
- Down + closing
- —
- Monthly P&I
- —
- Monthly cashflow
- —
- DSCR
- —
- Eligible?
- —
Short-term bridge; refi at stabilization.
Rent comps 40 comps
| Address | Beds | Baths | Sqft | Rent | $/sqft | DOM | Units | Dist |
|---|---|---|---|---|---|---|---|---|
| 37 E Filbert St Lancaster, PA | 3.0 | 1.0 | 1002 | $1,750 | $1.75 | 43d | 1 | 0.02mi |
| 529 Manor St Lancaster, PA | 3.0 | 1.0 | 1434 | $1,635 | $1.14 | 13d | 1 | 0.10mi |
| 513 Poplar St Lancaster, PA | 3.0 | 1.5 | 1184 | $1,695 | $1.43 | 43d | 1 | 0.13mi |
| 609 Saint Joseph St Lancaster, PA | 4.0 | 2.0 | 1523 | $1,695 | $1.11 | 43d | 1 | 0.15mi |
| 214 W Strawberry St Lancaster, PA | 3.0 | 1.0 | 1175 | $1,345 | $1.14 | 21d | 1 | 0.18mi |
| 324 New Dorwart St Lancaster, PA | 3.0 | 1.0 | 1020 | $1,495 | $1.47 | 13d | 1 | 0.24mi |
| 49 W Farnum St Lancaster, PA | 3.0 | 1.0 | 1820 | $1,650 | $0.91 | 43d | 1 | 0.33mi |
| 14 Coral St Lancaster, PA | 3.0 | 1.5 | 1355 | $1,525 | $1.13 | 43d | 1 | 0.33mi |
| 741 Manor St Lancaster, PA | 3.0 | 1.0 | 1200 | $1,695 | $1.41 | 43d | 1 | 0.34mi |
| 128 N Mulberry St Unit 1 Lancaster, PA | 2.0 | 2.0 | 1500 | $2,250 | $1.50 | 23d | 1 | 0.35mi |
| 422 Hillside Ave Lancaster, PA | 2.0 | 1.0 | 960 | $1,245 | $1.30 | 43d | 1 | 0.36mi |
| 678 1/2 Columbia Ave Apt 2 Lancaster, PA | 3.0 | 1.0 | 1100 | $1,495 | $1.36 | 13d | 1 | 0.40mi |
| 40 Fairview Ave Lancaster, PA | 3.0 | 1.0 | 1152 | $1,700 | $1.48 | 13d | 1 | 0.41mi |
| 118 N Prince St Lancaster, PA | 1.0–3.0 | 1.0–3.0 | 1274 | $4,703 | $3.69 | 13d | 48 | 0.41mi |
| 345 1/2 Beaver St Lancaster, PA | 4.0 | 1.0 | 1382 | $2,095 | $1.52 | 43d | 1 | 0.45mi |
| 404 Beaver St Lancaster, PA | 3.0 | 1.0 | 1025 | $1,425 | $1.39 | 23d | 1 | 0.46mi |
| 549 Howard Ave Lancaster, PA | 4.0 | 1.0 | 1439 | $1,700 | $1.18 | 43d | 1 | 0.49mi |
| 433 W Walnut St Apt 2 Lancaster, PA | 2.0 | 1.0 | 900 | $1,840 | $2.04 | 23d | 1 | 0.50mi |
| 202 N Queen St Lancaster, PA | 2.0 | 1.0–2.0 | 697 | $2,718 | $3.90 | 13d | 12 | 0.55mi |
| 337 W Lemon St Unit 2 Lancaster, PA | 3.0 | 1.0 | 1588 | $1,895 | $1.19 | 13d | 1 | 0.61mi |
| 611 S West End Ave Lancaster, PA | 4.0 | 1.5 | 1589 | $1,800 | $1.13 | 13d | 1 | 0.65mi |
| 537 Woodward St Lancaster, PA | 3.0 | 2.0 | 1288 | $1,650 | $1.28 | 23d | 1 | 0.71mi |
| 225 E King St Unit 1 Lancaster, PA | 2.0 | 1.0 | 957 | $1,950 | $2.04 | 13d | 1 | 0.71mi |
| 225 E King St Unit 2 Lancaster, PA | 2.0 | 2.5 | 1075 | $2,600 | $2.42 | 43d | 1 | 0.71mi |
| 425 N Prince St Apt 206 Lancaster, PA | 2.0 | 2.0 | 1138 | $1,995 | $1.75 | 43d | 1 | 0.72mi |
| 1127 Wabank St Lancaster, PA | 1.0–2.0 | 1.0 | 760 | $1,650 | $2.17 | 23d | 1 | 0.79mi |
| 520 W Frederick St Lancaster, PA | 4.0 | 1.0 | 1713 | $1,895 | $1.11 | 43d | 1 | 0.80mi |
| 231 N Shippen St #224 Lancaster, PA | 2.0 | 2.0 | 1155 | $2,285 | $1.98 | 13d | 1 | 0.89mi |
| 480 Euclid Ave Lancaster, PA | 1.0–2.0 | 1.0–1.5 | 830 | $1,695 | $2.04 | 43d | 1 | 0.89mi |
| 1121 Spring Grove Ave Lancaster, PA | 4.0 | 2.0 | 1755 | $2,200 | $1.25 | 43d | 1 | 0.91mi |
| 850 Highland Ave Lancaster, PA | 2.0 | 1.0 | 1000 | $1,300 | $1.30 | 21d | 1 | 0.92mi |
| 708 S Lime St Unit 3 Lancaster, PA | 4.0 | 1.0 | 1742 | $1,850 | $1.06 | 43d | 1 | 0.95mi |
| 27 Roselle Ave Lancaster, PA | 2.0 | 1.0 | 1128 | $1,575 | $1.40 | 43d | 1 | 1.01mi |
| 816 N Prince St Lancaster, PA | 1.0–2.0 | 1.0–2.0 | 794 | $2,195 | $2.76 | 13d | 7 | 1.02mi |
| 135 Grandview Ave Lancaster, PA | 3.0 | 2.0 | 1395 | $3,295 | $2.36 | 13d | 1 | 1.05mi |
| 1115 Marietta Ave Unit WH15037 Lancaster, PA | 2.0 | 2.0 | 1298 | $1,695 | $1.31 | 43d | 1 | 1.07mi |
| 1013 Willow Street Pike Lancaster, PA | 2.0 | 1.0 | 1144 | $1,499 | $1.31 | 13d | 1 | 1.14mi |
| 860 N Market St Lancaster, PA | 3.0 | 2.0 | 1514 | $1,850 | $1.22 | 43d | 1 | 1.15mi |
| 101 Roselawn Ave Lancaster, PA | 3.0 | 2.0 | 1166 | $1,785 | $1.53 | 13d | 1 | 1.16mi |
| 1415 Spencer Ave Lancaster, PA | 1.0–3.0 | 1.0–2.0 | 1181 | $3,720 | $3.15 | 13d | 1 | 1.17mi |
Listing history 17 events
-
2026-06-18days on market $185,000 Active 37 DOM
-
2026-06-17days on market $185,000 Active 36 DOM
-
2026-06-16days on market $185,000 Active 35 DOM
-
2026-06-15days on market $185,000 Active 34 DOM
-
2026-06-14days on market $185,000 Active 32 DOM
-
2026-06-13days on market $185,000 Active 31 DOM
-
2026-06-10days on market $185,000 Active 29 DOM
-
2026-06-09days on market $185,000 Active 28 DOM
-
2026-06-08days on market $185,000 Active 27 DOM
-
2026-06-07days on market $185,000 Active 26 DOM
-
2026-06-03days on market $185,000 Active 22 DOM
-
2026-06-02days on market $185,000 Active 21 DOM
-
2026-06-01days on market $185,000 Active 20 DOM
-
2026-05-31days on market $185,000 Active 19 DOM
-
2026-05-30days on market $185,000 Active 18 DOM
-
2026-05-12$185,000 Active 1312-char remark
-
1991-05-01soldstatus $50,900
ⓘ Source: listings_history table (triggers on properties + properties_extension) + one-shot
backfill from property_details.listing_events for pre-trigger history.
Tax reassessment forecast PA · Partial reset (capped growth)
- Current annual tax
- $2,508 · $209/mo
- Projected year-2 tax
- $2,716 · $226/mo
- Expected delta
- +$207/yr (+$17/mo · 8.3%)
ⓘ Screening estimate from a state-policy table — verify with the county assessor before closing.
Climate risk First Street
- Flood 1/10 Low FEMA zone X (unshaded) · 0% chance over 30 yrs
- Wildfire 1/10 Low
- Heat 6/10 Major 7 d/yr ≥101°F today · 15 d/yr by 30 yrs out
- Wind 4/10 Moderate 16% chance of damaging wind over 30 yrs
- Air quality 4/10 Moderate 4 unhealthy d/yr today · 7 by 30 yrs out
Nearby sold comps map
Loading sold comps map…
Walkable amenities ~0.75 mi
Loading nearby amenities…
Taxation est. · year 1
- Rental income
- $21,072
- − Mortgage interest
- −$10,363
- − Property taxes
- −$2,508
- − Insurance
- −$925
- − Repairs & maintenance
- −$1,686
- − Management
- −$1,686
- − Depreciation
- −$5,382
- Taxable loss
- −$1,477
- Est. tax savings @ 24.0%
- +$355
- After-tax cash flow
- $1,926/yr
For passive investors: Depreciation is non-cash, so a rental often shows a tax loss while cash-flowing — sheltering income. Rental losses are passive: they offset passive income freely, and up to $25,000/yr can offset ordinary (W-2) income if you actively participate and your MAGI is under $100k (phasing out to $0 by $150k); unused losses carry forward. On sale, claimed depreciation is recaptured at up to 25%, and gains may owe capital-gains tax (a 1031 exchange can defer both). Figures are a year-1 estimate at your 24.0% rate — not tax advice; consult a CPA.
Schools (NCES district)
- District
- Lancaster SD
- NCES district ID
- 4213140
- Math proficiency
- 12% ▼ -10.00%
- Reading proficiency
- 25% ▼ -13.00%
- Median HH income
- $38,500
- Composite
- 15.52/100
- National rank
- #9301
- State rank
- #500 of 539 in PA
Livability — Lancaster
- Score
- 85/100
- State rank
- #71
- US rank
- #498
Category grades
Schools grade is shown separately in the Schools card above.
Census & demographics
- Census place
- Lancaster, PA
- County
- Lancaster County · 390,309 people
- City population
- 176,170
- Metro
- Lancaster, PA
- Population (ZIP)
- 67,571
- Household income
- $77,084
- Rent vs Own
- Severe rent burden
- 2557.0
Population outlook (Lancaster County) Hauer SSP2
- Today (2025)
- 561,011 people
- By 2030
- 570,969 · +1.8%
- By 2040
- 585,929 · +4.4%
- By 2050
- 591,056 · +5.4%
- By 2075
- 594,747 · +6.0%
- By 2100
- 558,850 · -0.4%
Race, ethnicity, and origin ACS 2023
- Neighborhood character
- Diverse neighborhood (Simpson 0.59)
- Race & ethnicity
- White 58% Hispanic / Latino 27% Two or more races 12% Black 7% Asian 4%
- Hispanic origin (detail)
- Mexican 1% Puerto Rican 19% Cuban 1% Dominican 2%
- Common ancestry
- Romanian 2% Slovak 2% Lithuanian 1%
- Foreign-born
- 9% · Canada, China, India
- Languages at home
- 77% English-only · Spanish 17% Other Indo-European 1% Chinese 1%
Political lean MEDSL · Lancaster
- 2024 margin
- R (+15.9) · D 41.5% · R 57.5%
- 2008→2024 swing
- -4.1pp toward R · 2008: -11.8pp · 2024: -15.9pp
- All cycles
- 2024: R+15.9 2020: R+15.8 2016: R+19.7 2012: R+19.2 2008: R+11.8
Not yet ingested
- Civics
- —
Market trends
- HPI YoY
- ▼ -508.78%
- Current HPI
- 289.3324
- Rent YoY
- ▲ 0.47%
- Metro
- Lancaster, PA
- State GDP YoY
- ▲ 1.68%
- F500 in state
- 34
Industry mix (Fortune 500 HQ in PA)
| Industry | F500 HQs | Revenue |
|---|---|---|
| Healthcare | 2 | $309B |
|
||
| Insurance | 2 | $27B |
|
||
| Telecommunications / Media | 1 | $124B |
|
||
| Industrial Distribution | 1 | $22B |
|
||
| Financial Services | 1 | $20B |
|
||
| Chemicals / Materials | 1 | $18B |
|
||
Price history
+263.5% since first listed2 events — show timeline
- 2026-05-12 Listed $185,000 BRIGHT MLS
- 1991-05-01 Sold (Public Records) $50,900 Public Records
Property tax history
-0.6%/yrLatest (2026): $2,508 · +3.3% YoY. Source: county tax records.
Cash-flow waterfall
monthlySold comps — $/sqft
last 12 mo · ≤1 miLoading sold comps…