1944 W University Blvd Unit 8A · Brownsville, TX
Flood risk 1/10 · Minimal
- FEMA flood zone
- X (unshaded)
- Chance of flooding over 30 yrs
- 0.0%
- Est. flood insurance / yr
- $507 – $1,088
Fire risk 2/10 · Minimal
- Est. fire insurance / yr
- $1,222 – $2,270
Heat risk 9/10 · Severe
- Hot days now (above 111°F)
- 7 days/yr
- Hot days in 30 yrs
- 25 days/yr
Wind risk 9/10 · Severe
- Chance of severe wind over 30 yrs
- 99.0%
Air-quality risk 3/10 · Minor
- Unhealthy air days now
- 2 days/yr
- Unhealthy air days in 30 yrs
- 3 days/yr
Risk factors via First Street. Map © Google.
Why this score? — see what drove the D grade
The composite is a weighted blend of 9 inputs, each scored 0–100. Each bar is that input's sub-score; the figure is the points it added to the 100-point composite (weight × sub-score).
- Cash flow +10.9/30.0
- 1% rule +9.0/10.0
- ARV discount +7.5/15.0
- Rent growth +5.0/5.0
- Livability +4.0/5.0
- DSCR +3.2/10.0
- Schools +2.2/10.0
- Condition / age +2.2/5.0
- Appreciation +0.0/10.0
$84,900
🖨 Deal sheet 📄 Offer letter ✓ Due diligence
Listing remarks MLS
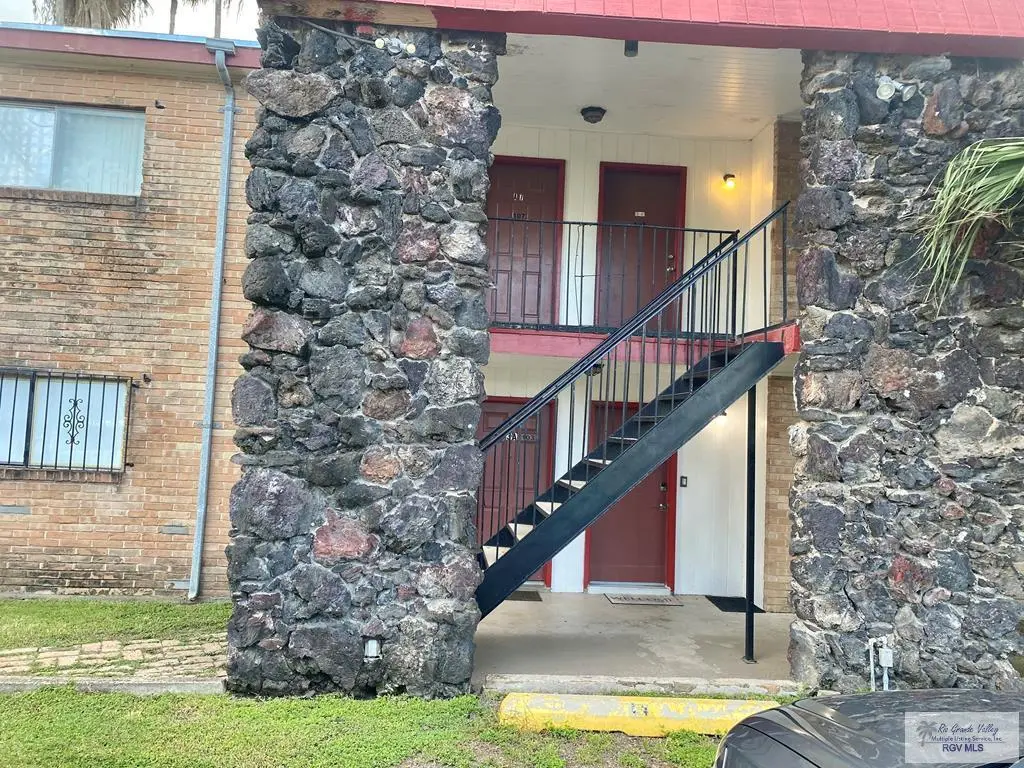
Great Condo across from TSC Recreational Center, walking distance to UTRGV, 2 bad 2 bath Open Living and dining area, kitchen. Inground swimming pool beautiful back view with a man made waterfall surrender by beautiful landscape full of nature and palm trees. Next to International Bridge, walking distance to downtown restaurants not to fare from SPACEX and SPI. HOA FEES INCLUDES, ELECTIC/WATER/ INS/ GROUND MAINTEINANCE , 2 PRIVET PARKINGS IN BUILDING. MUST SEE!
Key facts
- Pool
- Built 1980
- Listed 26 days
Tags
Neighborhood map
What this means for you Summary
Snapshot
- This is a 2-bed/1.0-bath condo listed at $85k. Condition is rated fair.
Deal economics
- At list price, monthly cash flow is $-37 ($-440/yr) — negative.
- The deal already cash-flows at list — no discount required.
- Meets the 1% rule at list price ($1k rent vs $85k).
- Recommended offer: $84k (1.5% below list) — sets the bar for market timing.
Location & tenants
- Location reads 79/100 on livability (#62 in TX, #2,311 nationally) — a middle-class / working-renter tenant base. Strengths: commute A+, cost of living A+, housing A+; Watch: schools C-, amenities D, crime D-.
- Brownsville ISD (urban): math 20% / reading 34% proficiency, ranked #710 of 826 in TX (top 86%) — low school quality limits family demand, transient renter base, plan for 1-2y turnover; 83% free/reduced lunch — lower-income household profile, screen leases tightly.
- Market conditions: Rents rising fast (+11.4%/yr); 346 active listings in the ZIP; 13 comparable units currently listed for rent nearby; rentals lingering (median 44d on market — plan ~5-8 weeks vacancy on turnover, expect pricing pressure); 85% of comp listings sitting > 30 days — soft ceiling on asking rent; 2,326 units permitted in Cameron County in 2024 (503 in 5+ unit buildings).
Forward outlook
- Local home prices are declining (-3.0%/yr); year-one equity from $587 of loan paydown is wiped out by about $3k of value loss. Plan a longer hold.
- Cameron County population projected at +3% by 2050 — modest demand growth; plan on rents tracking national, not racing it.
- At projected returns (-3.0% appreciation + 8.0% rent growth), your $24k cash investment doubles in ~10 years — after that, you're playing with house money.
Negotiation context
- It's been on market 26 days — a 2% lower offer ($84k) is reasonable based on typical stale-listing flexibility.
Risks & watch-outs
- Watch-outs: HOA is 33% of rent.
- Climate carrying-cost: severe wind risk, 99% chance of damaging wind over 30y; extreme-heat days projected 7→25/yr by 2055 (HVAC capex compounding) — expect insurance premiums to compound above CPI over the hold.
Questions for the listing agent
- What do current leases actually rent for vs. the listed asking? Can we see a recent rent roll and the last 12 months of T-12 income?
- Have any recent inspections been done? Can we get a copy of the seller's disclosures and any deferred-maintenance estimates?
- What does the HOA fee cover, when was the last increase, and are there any pending special assessments or reserve-fund shortfalls?
- Any open or pending special assessments — roof, HVAC, plumbing, elevator, façade? What's the per-unit balance and payoff schedule, and is the seller paying it off at close or rolling it to the buyer?
- Is there a deadline driving the sale (1031 exchange, divorce, estate, relocation)? That informs how much negotiation room exists.
- Crime grade is D in this area — have there been break-ins, vandalism, or insurance claims at this property in the last 3 years? What carrier currently insures it and at what premium?
- The area grade is low — what's the realistic commute time and amenity access for the typical tenant pool here? Any planned neighborhood developments (good or bad) we should know about?
- What's the average days-on-market for RENTAL listings here right now (not sales)? A rising rental-DOM trend means longer vacancies and softer asking-rent achievability than the comps imply.
- What's the recent tenant-quality profile in this submarket — average credit score on applications, eviction rate, late-payment / NSF rate, and stable-employment percentage? A property-management company in the area should have these aggregated.
- How much new apartment / multifamily construction is in the pipeline within 1–3 miles? Heavy new supply (>2% of stock underway) typically softens rents 12–24 months out; light construction supports rent growth.
Investment metrics
- 1% rule
- 1.40% ✓
- Cap rate
- 5.77%
- Cash-on-cash
- -1.85%
- DSCR
- 0.92
- GRM
- 6.0
CMA / ARV
No comps found within radius.
Projected returns pro-forma
-3.0% appreciation · 8.0% rent growth · sell at horizon
- IRR
- -10.2%
- Equity multiple
- 0.60×
- Total profit
- $-9,577
- Equity at exit
- $12,659
- IRR
- 7.5%
- Equity multiple
- 1.77×
- Total profit
- $18,188
- Equity at exit
- $7,341
Cash invested: $23,772 (down + closing). Projections, not guarantees.
Landlord ↔ Tenant lean methodology
- Overall (STATE)
- 87 Strongly Landlord-Friendly
- State Texas
- 87 Strongly Landlord-Friendly · R+5
- County
- — inherits STATE
- City
- — inherits STATE
ZIP-level market 78520
- Home prices YoY
- -19.8%
- Rents YoY
- 11.4%
- Active inventory
- 346
- Price-to-rent
- 6.0×
Monthly cashflow live
- Estimated rent
- $1,185 high interval (Pro) →
- Mortgage (P&I)
- −$445
- Tax est. 1.5%
- −$106 /mo · $1,274/yr
- Insurance
- −$35
- HOA est. from 4 same-building comps
- −$386
- Vacancy / Maint / Mgmt
- −$249
- Net cashflow
- $-37
Break-even live
UW: 25.0% down · 7.5% · 30yr · 1.5% tax · 5.0% vac · 8.0% maint · 8.0% mgmt
Financing live
Cash to close
- Down payment
- $21,225
- Closing costs
- $2,547
- Reserves months
- —
- Total cash needed
- —
Loan-product check · same deal, 3 products live
Conventional
25% down · 7.5% · 30yr
- Down + closing
- —
- Monthly P&I
- —
- Monthly cashflow
- —
- DSCR
- —
- Eligible?
- —
Personal DTI + credit; lowest rate.
DSCR
20% down · 8.5% · 30yr
- Down + closing
- —
- Monthly P&I
- —
- Monthly cashflow
- —
- DSCR
- —
- Eligible?
- —
No personal income docs; deal must DSCR.
Hard money
10% down · 12.0% · 12mo
- Down + closing
- —
- Monthly P&I
- —
- Monthly cashflow
- —
- DSCR
- —
- Eligible?
- —
Short-term bridge; refi at stabilization.
Rent comps 13 comps
| Address | Beds | Baths | Sqft | Rent | $/sqft | DOM | Units | Dist |
|---|---|---|---|---|---|---|---|---|
| 1900 W University Blvd Brownsville, TX | 2.0 | 1.0 | 950 | $1,300 | $1.37 | 43d | 1 | 0.22mi |
| 1900 W University Blvd #3012 Brownsville, TX | 2.0 | 2.0 | 980 | $1,000 | $1.02 | 43d | 1 | 0.22mi |
| 801 International Blvd Ste B Brownsville, TX | 1.0 | 1.0 | 1092 | $950 | $0.87 | 43d | 1 | 0.50mi |
| 1234 E Jackson St Brownsville, TX | 2.0 | 1.0 | 640 | $800 | $1.25 | 43d | 1 | 0.72mi |
| 913 E Jefferson St Unit D Brownsville, TX | 2.0 | 2.0 | 1052 | $1,400 | $1.33 | 21d | 1 | 0.84mi |
| 634 E 6th St Apt 2 Brownsville, TX | 2.0 | 1.0 | 713 | $1,000 | $1.40 | 43d | 1 | 1.05mi |
| 305 Calle Amistosa Unit L502 Brownsville, TX | 1.0 | 1.0 | 753 | $1,300 | $1.73 | 43d | 1 | 1.08mi |
| 424 E Levee St Unit 1 & 4 Brownsville, TX | 1.0 | 1.0 | 600 | $650 | $1.08 | 13d | 1 | 1.15mi |
| 424 E Levee St Unit 7 Brownsville, TX | 1.0 | 1.0 | 600 | $650 | $1.08 | 43d | 1 | 1.15mi |
| 351 E Saint Charles St Brownsville, TX | 1.0 | 1.0 | 650 | $650 | $1.00 | 43d | 1 | 1.19mi |
| 219 E 3rd St Brownsville, TX | 2.0 | 1.0 | 900 | $1,275 | $1.42 | 43d | 1 | 1.26mi |
| 221 E 3rd St Brownsville, TX | 2.0 | 1.0 | 850 | $1,325 | $1.56 | 43d | 1 | 1.26mi |
| 508 Truman Dr Unit B Brownsville, TX | 3.0 | 1.0 | 960 | $975 | $1.02 | 43d | 1 | 1.43mi |
HOA detail condo
- Monthly dues
- $0 · $0/yr
- Likely covers
- waterpool
- Assessments
- None detected in remarks — confirm with the listing agent.
Listing history 18 events
-
2026-06-18days on market $84,900 Active 26 DOM
-
2026-06-17days on market $84,900 Active 25 DOM
-
2026-06-16days on market $84,900 Active 24 DOM
-
2026-06-15days on market $84,900 Active 23 DOM
-
2026-06-14days on market $84,900 Active 21 DOM
-
2026-06-13days on market $84,900 Active 20 DOM
-
2026-06-10days on market $84,900 Active 18 DOM
-
2026-06-09days on market $84,900 Active 17 DOM
-
2026-06-08days on market $84,900 Active 16 DOM
-
2026-06-07days on market $84,900 Active 15 DOM
-
2026-06-05days on market $84,900 Active 12 DOM
-
2026-06-03days on market $84,900 Active 11 DOM
-
2026-06-02days on market $84,900 Active 10 DOM
-
2026-06-01days on market $84,900 Active 9 DOM
-
2026-05-31days on market $84,900 Active 8 DOM
-
2026-05-30days on market $84,900 Active 7 DOM
-
2026-03-11price $79,900 466-char remark
Show marketing remark (466 chars)
Great Condo across from TSC Recreational Center, walking distance to UTRGV, 2 bad 2 bath Open Living and dining area, kitchen. Inground swimming pool beautiful back view with a man made waterfall surrender by beautiful landscape full of nature and palm trees. Next to International Bridge, walking distance to downtown restaurants not to fare from SPACEX and SPI. HOA FEES INCLUDES, ELECTIC/WATER/ INS/ GROUND MAINTEINANCE , 2 PRIVET PARKINGS IN BUILDING. MUST SEE!
-
2025-10-07$89,900 Active 466-char remark
Show marketing remark (466 chars)
Great Condo across from TSC Recreational Center, walking distance to UTRGV, 2 bad 2 bath Open Living and dining area, kitchen. Inground swimming pool beautiful back view with a man made waterfall surrender by beautiful landscape full of nature and palm trees. Next to International Bridge, walking distance to downtown restaurants not to fare from SPACEX and SPI. HOA FEES INCLUDES, ELECTIC/WATER/ INS/ GROUND MAINTEINANCE , 2 PRIVET PARKINGS IN BUILDING. MUST SEE!
ⓘ Source: listings_history table (triggers on properties + properties_extension) + one-shot
backfill from property_details.listing_events for pre-trigger history.
Climate risk First Street
- Flood 1/10 Low FEMA zone X (unshaded) · 0% chance over 30 yrs
- Wildfire 2/10 Low
- Heat 9/10 Extreme 7 d/yr ≥111°F today · 25 d/yr by 30 yrs out
- Wind 9/10 Extreme 99% chance of damaging wind over 30 yrs
- Air quality 3/10 Moderate 2 unhealthy d/yr today · 3 by 30 yrs out
Nearby sold comps map
Loading sold comps map…
Walkable amenities ~0.75 mi
Loading nearby amenities…
Taxation est. · year 1
- Rental income
- $14,218
- − Mortgage interest
- −$4,756
- − Property taxes
- −$1,274
- − Insurance
- −$424
- − Repairs & maintenance
- −$1,137
- − Management
- −$1,137
- − HOA
- −$4,632
- − Depreciation
- −$2,470
- Taxable loss
- −$1,612
- Est. tax savings @ 24.0%
- +$387
- After-tax cash flow
- $-53/yr
For passive investors: Depreciation is non-cash, so a rental often shows a tax loss while cash-flowing — sheltering income. Rental losses are passive: they offset passive income freely, and up to $25,000/yr can offset ordinary (W-2) income if you actively participate and your MAGI is under $100k (phasing out to $0 by $150k); unused losses carry forward. On sale, claimed depreciation is recaptured at up to 25%, and gains may owe capital-gains tax (a 1031 exchange can defer both). Figures are a year-1 estimate at your 24.0% rate — not tax advice; consult a CPA.
Condition & rehab AI · 12 photos
This property requires moderate renovations to improve its condition and increase its value. Key areas for improvement include the kitchen, bathroom, and landscaping.
Repairs flagged
- Major kitchen cabinets — severely worn and outdated
- Major bathroom fixtures — small and outdated
- Major concrete foundation — cracked and in need of repair
- Major interior walls — dated paint and peeling
- Major landscaping — overgrown and in need of maintenance
Value-add opportunities
- Both new kitchen cabinets and countertops — modernizes the kitchen and improves functionality
- Both new bathroom fixtures — enhances the bathroom and adds value
- Both landscaping and maintenance — improves curb appeal and adds value
- Both paint interior walls — updates the interior and enhances the home's appearance
Renovation cost estimate screening
| Repair item | Severity | Est. cost |
|---|---|---|
| kitchen cabinets · severely worn and outdated | Major | $15,000–50,000 |
| bathroom fixtures · small and outdated | Major | $15,000–50,000 |
| concrete foundation · cracked and in need of repair | Major | $15,000–50,000 |
| interior walls · dated paint and peeling | Major | $15,000–50,000 |
| landscaping · overgrown and in need of maintenance | Major | $15,000–50,000 |
| Total estimated repair cost · 5 items | $75,000–250,000 |
Value-add ROI direction
- Both new kitchen cabinets and countertops — modernizes the kitchen and improves functionality ↑
- Both new bathroom fixtures — enhances the bathroom and adds value ↑
- Both landscaping and maintenance — improves curb appeal and adds value ↑
- Both paint interior walls — updates the interior and enhances the home's appearance ↑
ⓘ Cost ranges are severity-bucket heuristics (US national rule-of-thumb). Get contractor quotes + a written scope before underwriting a rehab budget.
Schools (NCES district)
- District
- Brownsville ISD
- NCES district ID
- 4811680
- Math proficiency
- 20% ▼ -36.00%
- Reading proficiency
- 34% ▼ -13.00%
- Median HH income
- $30,490
- Composite
- 21.8/100
- National rank
- #8249
- State rank
- #710 of 826 in TX
Livability — Brownsville
- Score
- 79/100
- State rank
- #62
- US rank
- #2311
Category grades
Schools grade is shown separately in the Schools card above.
Census & demographics
- Census place
- Brownsville, TX
- County
- Cameron County · 310,734 people
- City population
- 212,132
- Metro
- Brownsville-Harlingen, TX
- Population (ZIP)
- 64,740
- Household income
- $50,116
- Rent vs Own
- Severe rent burden
- 1800.0
Population outlook (Cameron County) Hauer SSP2
- Today (2025)
- 441,603 people
- By 2030
- 448,113 · +1.5%
- By 2040
- 456,385 · +3.3%
- By 2050
- 456,294 · +3.3%
- By 2075
- 423,851 · -4.0%
- By 2100
- 342,787 · -22.4%
Race, ethnicity, and origin ACS 2023
- Neighborhood character
- Predominantly Hispanic (93%)
- Race & ethnicity
- Hispanic / Latino 93% Two or more races 44% White 6%
- Hispanic origin (detail)
- Mexican 88%
- Foreign-born
- 26% · Canada
- Languages at home
- 18% English-only · Spanish 82%
Political lean MEDSL · Cameron
- 2024 margin
- Lean R (+5.8) · D 46.7% · R 52.5%
- 2008→2024 swing
- -34.6pp toward R · 2008: 28.8pp · 2024: -5.8pp
- All cycles
- 2024: R+5.8 2020: D+13.2 2016: D+32.5 2012: D+32.4 2008: D+28.8
Not yet ingested
- Civics
- —
Market trends
- HPI YoY
- ▼ -52.91%
- Current HPI
- 214.4335
- Rent YoY
- ▲ 11.41%
- Metro
- Brownsville-Harlingen, TX
- State GDP YoY
- ▲ 3.95%
- F500 in state
- 110
Industry mix (Fortune 500 HQ in TX)
| Industry | F500 HQs | Revenue |
|---|---|---|
| Energy | 16 | $1,198B |
|
||
| Technology | 5 | $198B |
|
||
| Engineering / Construction | 4 | $72B |
|
||
| Energy Services | 3 | $60B |
|
||
| Utilities | 3 | $41B |
|
||
| Healthcare | 2 | $330B |
|
||
Price history
-11.1% since first listed2 events — show timeline
- 2026-03-11 Price Changed $79,900 RGVMLS
- 2025-10-07 Listed $89,900 RGVMLS
Cash-flow waterfall
monthlySold comps — $/sqft
last 12 mo · ≤1 miLoading sold comps…