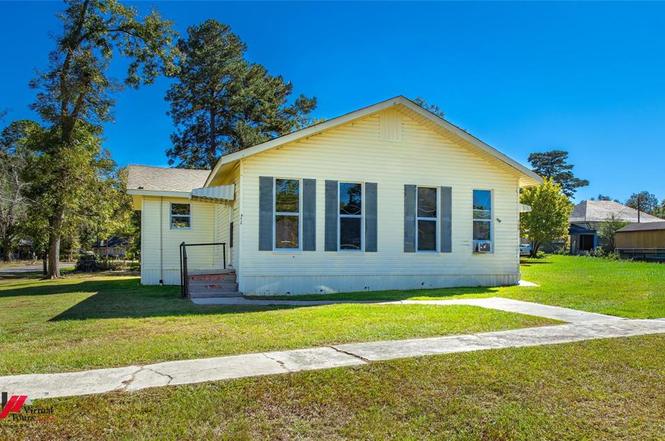
309-311 Sycamore St · Logansport, LA
Flood risk 1/10 · Minimal
- FEMA flood zone
- X (unshaded)
- Chance of flooding over 30 yrs
- 0.0%
- Est. flood insurance / yr
- $507 – $1,088
Fire risk 3/10 · Minor
- Est. fire insurance / yr
- $1,269 – $2,357
Heat risk 7/10 · Major
- Hot days now (above 111°F)
- 7 days/yr
- Hot days in 30 yrs
- 22 days/yr
Wind risk 8/10 · Major
- Chance of severe wind over 30 yrs
- 80.0%
Air-quality risk 1/10 · Minimal
- Unhealthy air days now
- 0 days/yr
- Unhealthy air days in 30 yrs
- 0 days/yr
Risk factors via First Street. Map © Google.
Why this score? — see what drove the B- grade
The composite is a weighted blend of 9 inputs, each scored 0–100. Each bar is that input's sub-score; the figure is the points it added to the 100-point composite (weight × sub-score).
- Cash flow +24.6/30.0
- ARV discount +14.4/15.0
- DSCR +8.0/10.0
- 1% rule +5.4/10.0
- Appreciation +5.0/10.0
- Schools +3.5/10.0
- Livability +3.2/5.0
- Rent growth +2.5/5.0
- Condition / age +2.5/5.0
$124,900
🖨 Deal sheet (PDF) 📄 Offer letter ✓ Due diligence
Listing remarks
Dont miss out on this income producing duplex in Logansport. Each unit is a 2 bedroom 1 bath. Each unit has washer and dryer hookups. Nice size living room and a dining room. Right side is rented out with long time tenant. Move in ready close to down town Logansport, shopping, eating and more. Corner lot with large lot.
Key facts
- Corner lot
- 0.32 acre lot
- Built 1980
Tags
Property features AI
Finance
- Other: Corner parcel (APN indicated); Photos available
- Financial info: Treat as clear loan type; No second mortgage
- HOA & community: No association
Exterior
- Parking: Outside parking
- Utilities: City water; City sewer; Not in a municipal utility district
- Home design: Single-family residence; One story; Property attached: Yes; Residential property
- Construction: Built in 1980; Wood construction; Shingle roof; Pillar/post/pier foundation
- Exterior features: Corner lot
Interior
- Kitchen: No appliances included
- Bedrooms: 4 bedrooms; Primary bedroom on level 1
- Flooring: Vinyl flooring
- Bathrooms: 2 full bathrooms
- Heating & cooling: Electric heating; Central air conditioning
- Interior features: Decorative lighting; High-speed internet available; Window coverings; One living area; One dining area; Room count: 4
- Laundry & utility: Washer hookup; Electric dryer hookup
Neighborhood map
What this means for you Summary
Snapshot
- This is a 4-bed/2.0-bath single-family listed at $125k.
Deal economics
- At list price, monthly cash flow is $259 ($3k/yr) — positive.
- The deal already cash-flows at list — no discount required.
- Meets the 1% rule at list price ($1k rent vs $125k).
Location & tenants
- Location reads 64/100 on livability (#162 in LA) — a middle-class / working-renter tenant base. Strengths: cost of living A+, housing A+, crime B; Watch: amenities F, commute F, employment D-.
- Desoto Parish (rural): math 35% / reading 48% proficiency, ranked #21 of 98 in LA (top 21%) — families likely to look elsewhere, expect single-tenant / working-renter base with shorter leases.
- Market conditions: 7 active listings in the ZIP; 113 units permitted in De Soto Parish in 2024 (0 in 5+ unit buildings).
Forward outlook
- In year one you build about $5k of equity ($864 loan paydown + $4k appreciation (3.0% local appreciation)).
- De Soto County population projected at +8% by 2050 — modest demand growth; plan on rents tracking national, not racing it.
- At projected returns (3.0% appreciation + 3.0% rent growth), your $35k cash investment doubles in ~5 years — after that, you're playing with house money.
- By year 8, paydown + projected appreciation supports a ~$34k cash-out refi (75% LTV) — recoverable capital for the next deal without selling this one.
Negotiation context
- Only 5 days on market — expect competitive offers; lowballing is unlikely to land.
- Current owner paid $56k; list at $125k implies a 123% gain — meaningful room to come down on a strong offer.
Risks & watch-outs
- Climate carrying-cost: severe wind risk, 80% chance of damaging wind over 30y; extreme-heat days projected 7→22/yr by 2055 (HVAC capex compounding) — expect insurance premiums to compound above CPI over the hold.
Questions for the listing agent
- Is there a deadline driving the sale (1031 exchange, divorce, estate, relocation)? That informs how much negotiation room exists.
- What's the average days-on-market for RENTAL listings here right now (not sales)? A rising rental-DOM trend means longer vacancies and softer asking-rent achievability than the comps imply.
- What's the recent tenant-quality profile in this submarket — average credit score on applications, eviction rate, late-payment / NSF rate, and stable-employment percentage? A property-management company in the area should have these aggregated.
- How much new for-sale + rental construction is in the pipeline within 1–3 miles? Heavy new supply typically softens prices + rents 12–24 months out; constrained supply supports both.
Investment metrics
- 1% rule
- 1.04% ✓
- Cap rate
- 8.78%
- Cash-on-cash
- 8.89%
- DSCR
- 1.40
- GRM
- 8.0
CMA / ARV
- ARV (on-the-fly)
- $147,620
- Comps found
- 1
Show comp detail 1 sale within ~0.75 mi
| Address | Dist | Beds/Ba | Sqft | Sold | Price | $/sf | Match |
|---|---|---|---|---|---|---|---|
| 202 Pine St | 0.11mi | 3/2.0 (-1) | 2,200 (-9%) | 2mo | $135,000 | $61 | 74 |
Match score weights: distance 35% · size 25% · config 20% · recency 20%. Top-matched comps best support the ARV.
Projected returns pro-forma
3.0% appreciation · 3.0% rent growth · sell at horizon
- IRR
- 15.8%
- Equity multiple
- 1.90×
- Total profit
- $31,517
- Equity at exit
- $56,160
- IRR
- 17.4%
- Equity multiple
- 3.55×
- Total profit
- $89,029
- Equity at exit
- $86,550
Cash invested: $34,972 (down + closing). Projections, not guarantees.
Landlord ↔ Tenant lean methodology
- Overall (STATE)
- 90 Strongly Landlord-Friendly
- State Louisiana
- 90 Strongly Landlord-Friendly · R+12
- County
- — inherits STATE
- City
- — inherits STATE
ZIP-level market 71049
- Active inventory
- 7
- Price-to-rent
- 8.0×
Monthly cashflow live
- Estimated rent
- $1,303 medium interval (Pro) →
- Mortgage (P&I)
- −$655
- Tax from tax record
- −$63 /mo · $758/yr
- Insurance
- −$52
- HOA
- −$0
- Vacancy / Maint / Mgmt
- −$274
- Net cashflow
- $259
Break-even live
Sensitivity live
| Price | -10% $330 | -5% $295 | +0% $259 | +5% $224 | +10% $188 |
|---|---|---|---|---|---|
| Rent | -10% $156 | -5% $208 | +0% $259 | +5% $311 | +10% $362 |
| Rate | -1.0pp $322 | -0.5pp $291 | base $259 | +0.5pp $227 | +1.0pp $194 |
UW: 25.0% down · 7.5% · 30yr · 1.5% tax · 5.0% vac · 8.0% maint · 8.0% mgmt
Financing live
Cash to close
- Down payment
- $31,225
- Closing costs
- $3,747
- Reserves months
- —
- Total cash needed
- —
Loan-product check · same deal, 3 products live
Conventional
25% down · 7.5% · 30yr
- Down + closing
- —
- Monthly P&I
- —
- Monthly cashflow
- —
- DSCR
- —
- Eligible?
- —
Personal DTI + credit; lowest rate.
DSCR
20% down · 8.5% · 30yr
- Down + closing
- —
- Monthly P&I
- —
- Monthly cashflow
- —
- DSCR
- —
- Eligible?
- —
No personal income docs; deal must DSCR.
Hard money
10% down · 12.0% · 12mo
- Down + closing
- —
- Monthly P&I
- —
- Monthly cashflow
- —
- DSCR
- —
- Eligible?
- —
Short-term bridge; refi at stabilization.
Listing history 19 events
-
2026-06-22days on market $124,900 Active 5 DOM
-
2026-06-18days on market $124,900 Active 2 DOM
-
2026-06-16pricedays on market $124,900 Active 1 DOM
-
2026-06-16days on market $125,900 Active 235 DOM
-
2026-06-15days on market $125,900 Active 234 DOM
-
2026-06-14days on market $125,900 Active 232 DOM
-
2026-06-13days on market $125,900 Active 231 DOM
-
2026-06-10days on market $125,900 Active 229 DOM
-
2026-06-09days on market $125,900 Active 228 DOM
-
2026-06-08days on market $125,900 Active 227 DOM
-
2026-06-07days on market $125,900 Active 226 DOM
-
2026-06-02days on market $125,900 Active 221 DOM
-
2026-06-01days on market $125,900 Active 220 DOM
-
2026-05-31days on market $125,900 Active 219 DOM
-
2026-05-30days on market $125,900 Active 218 DOM
-
2026-02-21price $125,900
-
2026-01-23price $127,900
-
2025-10-24$129,900 Active
-
2006-05-17soldstatus $56,000
ⓘ Source: listings_history table (triggers on properties + properties_extension) + one-shot
backfill from property_details.listing_events for pre-trigger history.
Tax reassessment forecast LA · Resets to sale price
- Current annual tax
- $758 · $63/mo
- Projected year-2 tax
- $758 · $63/mo
- Expected delta
- $0/yr ($0/mo · 0.0%)
ⓘ Screening estimate from a state-policy table — verify with the county assessor before closing.
Climate risk First Street
- Flood 1/10 Low FEMA zone X (unshaded) · 0% chance over 30 yrs
- Wildfire 3/10 Moderate
- Heat 7/10 Severe 7 d/yr ≥111°F today · 22 d/yr by 30 yrs out
- Wind 8/10 Severe 80% chance of damaging wind over 30 yrs
- Air quality 1/10 Low 0 unhealthy d/yr today · 0 by 30 yrs out
Nearby sold comps map
Loading sold comps map…
Walkable amenities ~0.75 mi
Loading nearby amenities…
Taxation est. · year 1
- Rental income
- $15,636
- − Mortgage interest
- −$6,996
- − Property taxes
- −$758
- − Insurance
- −$624
- − Repairs & maintenance
- −$1,251
- − Management
- −$1,251
- − Depreciation
- −$3,633
- Taxable income
- $1,122
- Est. tax owed @ 24.0%
- −$269
- After-tax cash flow
- $2,841/yr
For passive investors: Depreciation is non-cash, so a rental often shows a tax loss while cash-flowing — sheltering income. Rental losses are passive: they offset passive income freely, and up to $25,000/yr can offset ordinary (W-2) income if you actively participate and your MAGI is under $100k (phasing out to $0 by $150k); unused losses carry forward. On sale, claimed depreciation is recaptured at up to 25%, and gains may owe capital-gains tax (a 1031 exchange can defer both). Figures are a year-1 estimate at your 24.0% rate — not tax advice; consult a CPA.
Schools (NCES district)
- District
- Desoto Parish
- NCES district ID
- 2200510
- Math proficiency
- 35% ▼ -37.00%
- Reading proficiency
- 48% ▼ -31.00%
- Median HH income
- $40,201
- Composite
- 34.75/100
- National rank
- #5130
- State rank
- #21 of 98 in LA
Livability — Logansport
- Score
- 64/100
- State rank
- #162
- US rank
- #13822
Category grades
Schools grade is shown separately in the Schools card above.
Census & demographics
- Census place
- Logansport, LA
- Population (ZIP)
- 3,366
Population outlook (De Soto County) Hauer SSP2
- Today (2025)
- 28,142 people
- By 2030
- 28,546 · +1.4%
- By 2040
- 29,357 · +4.3%
- By 2050
- 30,239 · +7.5%
- By 2075
- 33,412 · +18.7%
- By 2100
- 35,428 · +25.9%
Race, ethnicity, and origin ACS 2023
- Neighborhood character
- Predominantly White (72%)
- Race & ethnicity
- White 72% Black 23% Two or more races 4% Hispanic / Latino 2%
- Common ancestry
- Iranian 4% Lithuanian 4% Serbian 3%
- Foreign-born
- 0%
- Languages at home
- 99% English-only · French/Haitian/Cajun 1%
Political lean MEDSL · De Soto
- 2024 margin
- Solid R (+35.5) · D 31.8% · R 67.3%
- 2008→2024 swing
- -22.1pp toward R · 2008: -13.4pp · 2024: -35.5pp
- All cycles
- 2024: R+35.5 2020: R+24.8 2016: R+21.5 2012: R+13.8 2008: R+13.4
Not yet ingested
- Civics
- —
Market trends
- HPI YoY
- —
- Current HPI
- —
- Rent YoY
- —
- Metro
- —
- State GDP YoY
- ▲ 3.29%
- F500 in state
- 10
Industry mix (Fortune 500 HQ in LA)
| Industry | F500 HQs | Revenue |
|---|---|---|
| Telecommunications | 2 | $23B |
|
||
| Utilities | 1 | $12B |
|
||
| Wholesale / Distribution | 1 | $5B |
|
||
| Advertising | 1 | $2B |
|
||
Price history
+124.8% since first listed4 events — show timeline
- 2026-02-21 Price Changed $125,900 NTREIS
- 2026-01-23 Price Changed $127,900 NTREIS
- 2025-10-24 Listed $129,900 NTREIS
- 2006-05-17 Sold (Public Records) $56,000 Public Records
Property tax history
+1.0%/yrLatest (2025): $758 · -2.3% YoY. Source: county tax records.
Cash-flow waterfall
monthlySold comps — $/sqft
last 12 mo · ≤1 miLoading sold comps…