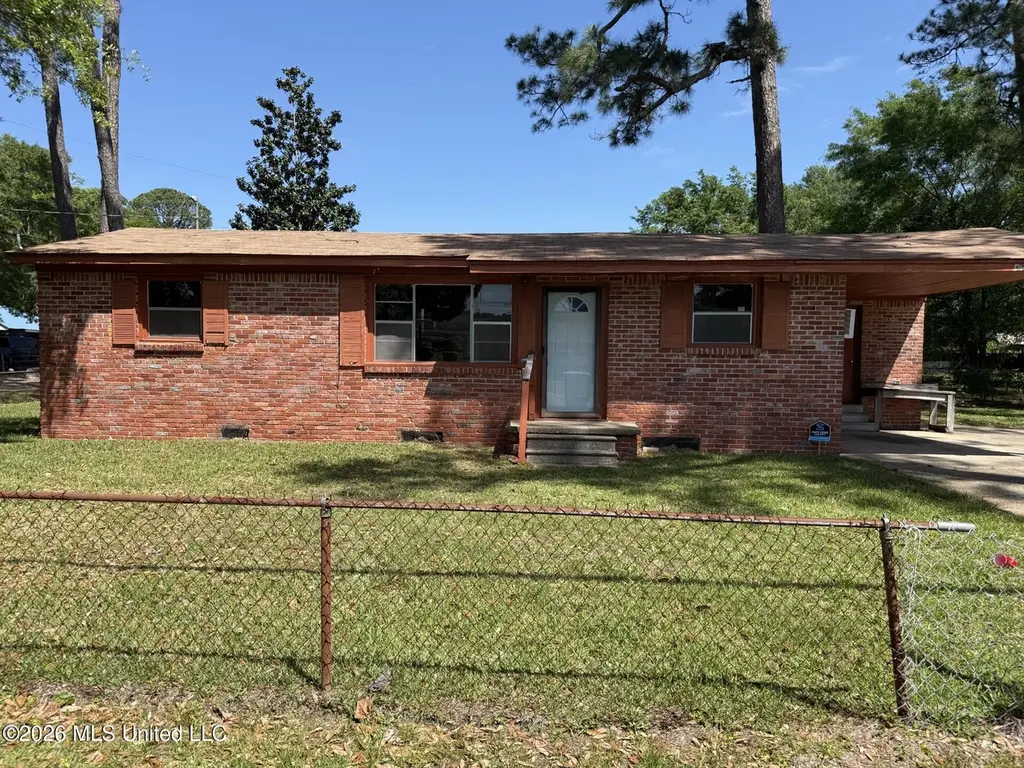
4519 General Ike · Moss Point, MS
Flood risk 5/10 · Moderate
- FEMA flood zone
- X (unshaded)
- Chance of flooding over 30 yrs
- 0.67%
- Est. flood insurance / yr
- $507 – $1,088
Fire risk 1/10 · Minimal
- Est. fire insurance / yr
- $1,241 – $2,305
Heat risk 10/10 · Severe
- Hot days now (above 105°F)
- 7 days/yr
- Hot days in 30 yrs
- 23 days/yr
Wind risk 9/10 · Severe
- Chance of severe wind over 30 yrs
- 99.0%
Air-quality risk 3/10 · Minor
- Unhealthy air days now
- 2 days/yr
- Unhealthy air days in 30 yrs
- 3 days/yr
Risk factors via First Street. Map © Google.
Why this score? — see what drove the B grade
The composite is a weighted blend of 9 inputs, each scored 0–100. Each bar is that input's sub-score; the figure is the points it added to the 100-point composite (weight × sub-score).
- Cash flow +30.0/30.0
- 1% rule +10.0/10.0
- DSCR +10.0/10.0
- Appreciation +7.3/10.0
- ARV discount +5.6/15.0
- Livability +3.4/5.0
- Rent growth +2.5/5.0
- Condition / age +2.5/5.0
- Schools +1.6/10.0
$70,000
🖨 Deal sheet 📄 Offer letter ✓ Due diligence
Listing remarks
Calling all investors and DIY enthusiasts! This solid brick home in Moss Point offers a fantastic opportunity to build sweat equity or expand your rental portfolio. While it needs some work, the bones are there, featuring a classic brick exterior and a convenient attached carport. Whether you're looking for your next ''fix and flip, '' a steady long-term rental, or a budget-friendly starter home to customize, this property is full of potential. Tucked away in an established neighborhood, it's just waiting for the right vision to bring it back to life. Sold as-is--bring your tools and your imagination!
Key facts
- Brick exterior
- Attached carport
- 8,276 sq ft lot
Tags
Property features AI
Finance
- Other:
- Financial info:
- HOA & community:
Exterior
- Parking: Carport (1 space)
- Security:
- Utilities: Public water; Public sewer; Electricity connected
- Home design: Single family residence (house); Built with brick construction; Pillar/post/pier foundation
- Construction: Brick construction; Shingle roof; Pillar/post/pier foundation; One story
- Exterior features: Shingle roof; Other exterior features
Interior
- Kitchen:
- Bedrooms:
- Flooring:
- Bathrooms: 1 full bathroom
- Heating & cooling: Heating present (unspecified type); Cooling present (unspecified type)
- Interior features: One-level layout
- Laundry & utility:
Neighborhood map
What this means for you Summary
Snapshot
- This is a 3-bed/1.0-bath single-family listed at $70k.
Deal economics
- At list price, monthly cash flow is $679 ($8k/yr) — positive.
- The deal already cash-flows at list — no discount required.
- Meets the 1% rule at list price ($1k rent vs $70k).
- Recommended offer: $66k (6.0% below list) — sets the bar for market timing.
- Cap rate 17.9% vs local median 6.8% in Moss Point — top-decile yield for the area; either an underpriced asset or a hidden risk that comps aren't pricing in. Stress-test before assuming the spread holds.
Location & tenants
- Location reads 67/100 on livability (#77 in MS) — a middle-class / working-renter tenant base. Strengths: cost of living A+, housing A+, crime A-; Watch: health & safety D+, schools D, amenities F.
- Moss Point Separate School District (suburban): math 17% / reading 22% proficiency, ranked #94 of 130 in MS (top 72%) — low school quality limits family demand, transient renter base, plan for 1-2y turnover; 83% free/reduced lunch — lower-income household profile, screen leases tightly.
- Market conditions: 86 active listings in the ZIP; 1 comparable units currently listed for rent nearby; 516 units permitted in Jackson County in 2024 (6 in 5+ unit buildings).
Forward outlook
- In year one you build about $4k of equity ($484 loan paydown + $3k appreciation (4.6% local appreciation)).
- At projected returns (4.6% appreciation + 3.0% rent growth), your $20k cash investment doubles in ~2 years — after that, you're playing with house money.
- By year 9, paydown + projected appreciation supports a ~$32k cash-out refi (75% LTV) — recoverable capital for the next deal without selling this one.
Negotiation context
- It's been on market 66 days — a 6% lower offer ($66k) is reasonable based on typical stale-listing flexibility.
Risks & watch-outs
- Climate carrying-cost: moderate flood risk; severe wind risk, 99% chance of damaging wind over 30y; extreme-heat days projected 7→23/yr by 2055 (HVAC capex compounding) — expect insurance premiums to compound above CPI over the hold.
Questions for the listing agent
- It's been on market 66 days. Have you received any prior offers? Is the seller open to a 6% concession, seller financing, or rate buy-down credit?
- Built in 1965 — when were the roof, HVAC, electrical panel, plumbing, and water heater last replaced?
- Why hasn't it sold? Are there any deal-killer items the seller is aware of (foundation, flood, title, zoning, code violations)?
- Is there a deadline driving the sale (1031 exchange, divorce, estate, relocation)? That informs how much negotiation room exists.
- Schools are D-rated, which usually means shorter tenancies and higher turnover. Who's the typical renter profile here, and what's been the actual vacancy rate?
- What's the average days-on-market for RENTAL listings here right now (not sales)? A rising rental-DOM trend means longer vacancies and softer asking-rent achievability than the comps imply.
- What's the recent tenant-quality profile in this submarket — average credit score on applications, eviction rate, late-payment / NSF rate, and stable-employment percentage? A property-management company in the area should have these aggregated.
- How much new for-sale + rental construction is in the pipeline within 1–3 miles? Heavy new supply typically softens prices + rents 12–24 months out; constrained supply supports both.
Investment metrics
- 1% rule
- 2.04% ✓
- Cap rate
- 17.93%
- Cash-on-cash
- 41.55%
- DSCR
- 2.85
- GRM
- 4.1
CMA / ARV
- ARV (on-the-fly)
- $67,200
- Comps found
- 3
Show comp detail 3 sales within ~0.75 mi
| Address | Dist | Beds/Ba | Sqft | Sold | Price | $/sf | Match |
|---|---|---|---|---|---|---|---|
| 4718 Jackson Ave | 0.52mi | 3/1.0 | 938 (+12%) | 0mo | $74,900 | $80 | 56 |
| 5148 Meridian St | 0.67mi | 3/1.0 | 840 (0%) | 24mo | $32,000 | $38 | 49 |
| 4837 Diamond Ave | 0.57mi | 3/1.0 | 954 (+14%) | 3mo | $129,900 | $136 | 48 |
Match score weights: distance 35% · size 25% · config 20% · recency 20%. Top-matched comps best support the ARV.
Projected returns pro-forma
4.6% appreciation · 3.0% rent growth · sell at horizon
- IRR
- 49.2%
- Equity multiple
- 3.95×
- Total profit
- $57,775
- Equity at exit
- $37,987
- IRR
- 47.4%
- Equity multiple
- 8.05×
- Total profit
- $138,087
- Equity at exit
- $64,211
Cash invested: $19,600 (down + closing). Projections, not guarantees.
Landlord ↔ Tenant lean methodology
- Overall (STATE)
- 90 Strongly Landlord-Friendly
- State Mississippi
- 90 Strongly Landlord-Friendly · R+11
- County
- — inherits STATE
- City
- — inherits STATE
ZIP-level market 39563
- Home prices YoY
- 3.0%
- Active inventory
- 86
- Price-to-rent
- 4.1×
Monthly cashflow live
- Estimated rent
- $1,430 medium interval (Pro) →
- Mortgage (P&I)
- −$367
- Tax from tax record
- −$55 /mo · $658/yr
- Insurance
- −$29
- HOA
- −$0
- Vacancy / Maint / Mgmt
- −$300
- Net cashflow
- $679
Break-even live
UW: 25.0% down · 7.5% · 30yr · 1.5% tax · 5.0% vac · 8.0% maint · 8.0% mgmt
Financing live
Cash to close
- Down payment
- $17,500
- Closing costs
- $2,100
- Reserves months
- —
- Total cash needed
- —
Loan-product check · same deal, 3 products live
Conventional
25% down · 7.5% · 30yr
- Down + closing
- —
- Monthly P&I
- —
- Monthly cashflow
- —
- DSCR
- —
- Eligible?
- —
Personal DTI + credit; lowest rate.
DSCR
20% down · 8.5% · 30yr
- Down + closing
- —
- Monthly P&I
- —
- Monthly cashflow
- —
- DSCR
- —
- Eligible?
- —
No personal income docs; deal must DSCR.
Hard money
10% down · 12.0% · 12mo
- Down + closing
- —
- Monthly P&I
- —
- Monthly cashflow
- —
- DSCR
- —
- Eligible?
- —
Short-term bridge; refi at stabilization.
Rent comps 1 comps
| Address | Beds | Baths | Sqft | Rent | $/sqft | DOM | Units | Dist |
|---|---|---|---|---|---|---|---|---|
| 3801 Melton Dr Pascagoula, MS | 1.0–3.0 | 1.0–2.0 | 825 | $1,430 | $1.73 | 13d | 43 | 1.48mi |
Listing history 15 events
-
2026-06-18days on market $70,000 Active 66 DOM
-
2026-06-17days on market $70,000 Active 65 DOM
-
2026-06-16days on market $70,000 Active 64 DOM
-
2026-06-15days on market $70,000 Active 63 DOM
-
2026-06-14days on market $70,000 Active 61 DOM
-
2026-06-13days on market $70,000 Active 60 DOM
-
2026-06-10days on market $70,000 Active 58 DOM
-
2026-06-09days on market $70,000 Active 57 DOM
-
2026-06-08days on market $70,000 Active 56 DOM
-
2026-06-07days on market $70,000 Active 55 DOM
-
2026-06-02days on market $70,000 Active 50 DOM
-
2026-06-01days on market $70,000 Active 49 DOM
-
2026-05-31days on market $70,000 Active 48 DOM
-
2026-05-30days on market $70,000 Active 47 DOM
-
2026-04-13$70,000 Active
ⓘ Source: listings_history table (triggers on properties + properties_extension) + one-shot
backfill from property_details.listing_events for pre-trigger history.
Tax reassessment forecast MS · Resets to sale price
- Current annual tax
- $658 · $55/mo
- Projected year-2 tax
- $658 · $55/mo
- Expected delta
- $0/yr ($0/mo · 0.0%)
ⓘ Screening estimate from a state-policy table — verify with the county assessor before closing.
Climate risk First Street
- Flood 5/10 Major FEMA zone X (unshaded) · 67% chance over 30 yrs
- Wildfire 1/10 Low
- Heat 10/10 Extreme 7 d/yr ≥105°F today · 23 d/yr by 30 yrs out
- Wind 9/10 Extreme 99% chance of damaging wind over 30 yrs
- Air quality 3/10 Moderate 2 unhealthy d/yr today · 3 by 30 yrs out
Nearby sold comps map
Loading sold comps map…
Walkable amenities ~0.75 mi
Loading nearby amenities…
Taxation est. · year 1
- Rental income
- $17,160
- − Mortgage interest
- −$3,921
- − Property taxes
- −$658
- − Insurance
- −$350
- − Repairs & maintenance
- −$1,373
- − Management
- −$1,373
- − Depreciation
- −$2,036
- Taxable income
- $7,449
- Est. tax owed @ 24.0%
- −$1,788
- After-tax cash flow
- $6,355/yr
For passive investors: Depreciation is non-cash, so a rental often shows a tax loss while cash-flowing — sheltering income. Rental losses are passive: they offset passive income freely, and up to $25,000/yr can offset ordinary (W-2) income if you actively participate and your MAGI is under $100k (phasing out to $0 by $150k); unused losses carry forward. On sale, claimed depreciation is recaptured at up to 25%, and gains may owe capital-gains tax (a 1031 exchange can defer both). Figures are a year-1 estimate at your 24.0% rate — not tax advice; consult a CPA.
Schools (NCES district)
- District
- Moss Point Separate School District
- NCES district ID
- 2803000
- Math proficiency
- 17% ▼ -3.00%
- Reading proficiency
- 22% ▬ 0.00%
- Median HH income
- $38,041
- Composite
- 16.34/100
- National rank
- #9205
- State rank
- #94 of 130 in MS
Livability — Moss Point
- Score
- 67/100
- State rank
- #77
- US rank
- #10398
Category grades
Schools grade is shown separately in the Schools card above.
Census & demographics
- Census place
- Moss Point, MS
- City population
- 12,023
- Population (ZIP)
- 12,023
Population outlook (Jackson County) Hauer SSP2
- Today (2025)
- 146,926 people
- By 2030
- 148,442 · +1.0%
- By 2040
- 149,631 · +1.8%
- By 2050
- 148,723 · +1.2%
- By 2075
- 147,845 · +0.6%
- By 2100
- 144,510 · -1.6%
Race, ethnicity, and origin ACS 2023
- Neighborhood character
- Predominantly Black (74%)
- Race & ethnicity
- Black 74% White 18% Hispanic / Latino 4% Two or more races 2%
- Common ancestry
- Lithuanian 0%
- Foreign-born
- 1% · Canada
- Languages at home
- 97% English-only · Spanish 3%
Political lean MEDSL · Jackson
- 2024 margin
- Solid R (+39.9) · D 29.5% · R 69.4% · Other 1.1%
- 2008→2024 swing
- -6.4pp toward R · 2008: -33.5pp · 2024: -39.9pp
- All cycles
- 2024: R+39.9 2020: R+34.6 2016: R+39.9 2012: R+36.1 2008: R+33.5
Not yet ingested
- Civics
- —
Market trends
- HPI YoY
- ▲ 4.60%
- Current HPI
- 155.3138
- Rent YoY
- —
- Metro
- —
- State GDP YoY
- —
- F500 in state
- 0
Price history
1 event — show timeline
- 2026-04-13 Listed $70,000 MLSU
Property tax history
+3.5%/yrLatest (2025): $658 · +5.3% YoY. Source: county tax records.
Cash-flow waterfall
monthlySold comps — $/sqft
last 12 mo · ≤1 miLoading sold comps…