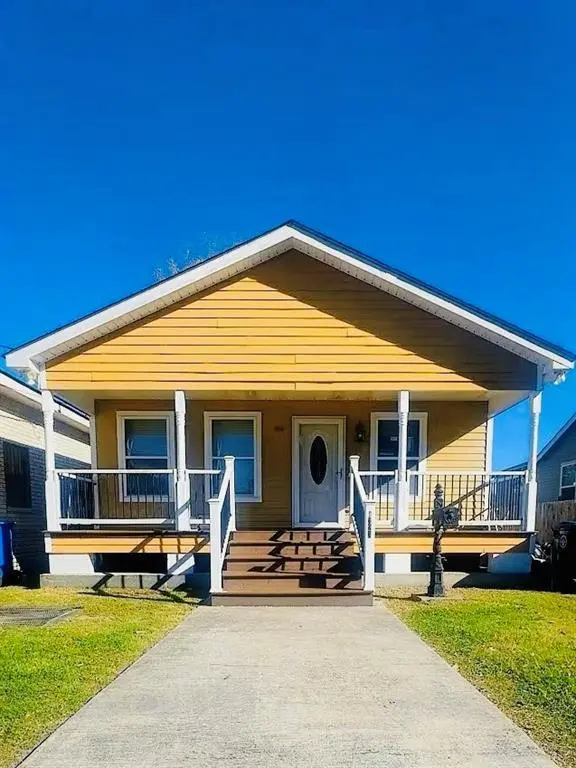
1323 Lizardi St · New Orleans, LA
Flood risk 8/10 · Major
- FEMA flood zone
- X (shaded)
- Chance of flooding over 30 yrs
- 0.6%
- Est. flood insurance / yr
- $507 – $1,088
Fire risk 1/10 · Minimal
- Est. fire insurance / yr
- $1,269 – $2,357
Heat risk 10/10 · Severe
- Hot days now (above 108°F)
- 7 days/yr
- Hot days in 30 yrs
- 21 days/yr
Wind risk 10/10 · Severe
- Chance of severe wind over 30 yrs
- 99.0%
Air-quality risk 3/10 · Minor
- Unhealthy air days now
- 3 days/yr
- Unhealthy air days in 30 yrs
- 3 days/yr
Risk factors via First Street. Map © Google.
Why this score? — see what drove the B- grade
The composite is a weighted blend of 9 inputs, each scored 0–100. Each bar is that input's sub-score; the figure is the points it added to the 100-point composite (weight × sub-score).
- Cash flow +25.8/30.0
- ARV discount +15.0/15.0
- DSCR +8.6/10.0
- 1% rule +6.8/10.0
- Livability +4.0/5.0
- Rent growth +3.1/5.0
- Condition / age +2.5/5.0
- Schools +1.6/10.0
- Appreciation +0.0/10.0
$127,000
🖨 Deal sheet 📄 Offer letter ✓ Due diligence
Listing remarks MLS
Great opportunity in the heart of the Lower Ninth Ward! This 3-bedroom, 2-bath fixer-upper offers an open floor plan and neutral paint throughout, providing the perfect canvas to make it your own. Whether you're looking for your next home or a smart investment property, this one has strong potential. Conveniently located near shopping centers, parks, and just minutes from the heart of New Orleans. Priced attractively at $137,000 and sold as-is. Don't miss this chance to bring your vision to life!
Key facts
- Open floor plan
- Near parks
- 4,787 sq ft lot
Tags
Neighborhood map
What this means for you Summary
Snapshot
- This is a 3-bed/2.0-bath single-family listed at $127k.
Deal economics
- At list price, monthly cash flow is $240 ($3k/yr) — positive.
- The deal already cash-flows at list — no discount required.
- Meets the 1% rule at list price ($1k rent vs $127k).
- Recommended offer: $116k (9.0% below list) — sets the bar for market timing.
- Cap rate 9.2% vs local median 4.4% in New Orleans — top-decile yield for the area; either an underpriced asset or a hidden risk that comps aren't pricing in. Stress-test before assuming the spread holds.
Location & tenants
- Location reads 81/100 on livability (#3 in LA, #1,383 nationally) — a professional / high-income tenant draw. Strengths: amenities A+, commute A+, health & safety A+; Watch: crime C-, employment D.
- Orleans Parish (urban): math 11% / reading 27% proficiency, ranked #69 of 98 in LA (top 70%) — low school quality limits family demand, transient renter base, plan for 1-2y turnover; 68% free/reduced lunch — lower-income household profile, screen leases tightly.
- Market conditions: Rents rising (+2.5%/yr); 581 active listings in the ZIP; 40 comparable units currently listed for rent nearby; rentals at typical pace (median 24d on market — plan ~3-4 weeks tenant-placement turnaround); 710 units permitted in Orleans Parish in 2024 (244 in 5+ unit buildings).
- This rent runs 39% of the median local income ($46k/yr) — at the standard rent-burdened threshold; future hikes will face affordability resistance.
Forward outlook
- Local home prices are declining (-3.0%/yr); year-one equity from $878 of loan paydown is wiped out by about $4k of value loss. Plan a longer hold.
- Orleans County population projected at +61% by 2050 — long-run rental-demand tailwind backs the buy-and-hold thesis.
Negotiation context
- It's been on market 115 days — a 9% lower offer ($116k) is reasonable based on typical stale-listing flexibility.
- 2 sale attempts; this cycle's ask has dropped $10k (7%) from the opening price — seller is motivated, your offer sets the floor, not the list.
Risks & watch-outs
- Watch-outs: flood insurance adds $66/mo.
- Climate carrying-cost: severe flood risk; severe wind risk, 99% chance of damaging wind over 30y; extreme-heat days projected 7→21/yr by 2055 (HVAC capex compounding) — expect insurance premiums to compound above CPI over the hold.
Questions for the listing agent
- It's been on market 115 days. Have you received any prior offers? Is the seller open to a 9% concession, seller financing, or rate buy-down credit?
- What's the actual annual flood-insurance premium (NFIP or private), and is the property in a SFHA with mandatory coverage?
- Why hasn't it sold? Are there any deal-killer items the seller is aware of (foundation, flood, title, zoning, code violations)?
- Is there a deadline driving the sale (1031 exchange, divorce, estate, relocation)? That informs how much negotiation room exists.
- What's the average days-on-market for RENTAL listings here right now (not sales)? A rising rental-DOM trend means longer vacancies and softer asking-rent achievability than the comps imply.
- What's the recent tenant-quality profile in this submarket — average credit score on applications, eviction rate, late-payment / NSF rate, and stable-employment percentage? A property-management company in the area should have these aggregated.
- How much new for-sale + rental construction is in the pipeline within 1–3 miles? Heavy new supply typically softens prices + rents 12–24 months out; constrained supply supports both.
Investment metrics
- 1% rule
- 1.18% ✓
- Cap rate
- 9.19%
- Cash-on-cash
- 10.34%
- DSCR
- 1.46
- GRM
- 7.1
CMA / ARV
- ARV (median comp)
- $158,820
- List price
- $127,000
- Delta
- -20.04%
- Verdict
- UNDERPRICED
- Comps
- 20 within 1.0 mi
Show comp detail 4 sales within ~0.75 mi
| Address | Dist | Beds/Ba | Sqft | Sold | Price | $/sf | Match |
|---|---|---|---|---|---|---|---|
| 5412 Marais St | 0.18mi | 3/1.0 | 900 (+2%) | 14mo | $131,500 | $146 | 72 |
| 1835 Andry St | 0.41mi | 3/2.0 | 918 (+4%) | 20mo | $125,000 | $136 | 57 |
| 622 Lizardi St | 0.50mi | 3/1.0 | 926 (+5%) | 9mo | $140,000 | $151 | 56 |
| 5859 N Claiborne Ave | 0.48mi | 3/2.0 | 903 (+2%) | 22mo | $55,000 | $61 | 56 |
Match score weights: distance 35% · size 25% · config 20% · recency 20%. Top-matched comps best support the ARV.
Projected returns pro-forma
-3.0% appreciation · 2.49% rent growth · sell at horizon
- IRR
- -4.5%
- Equity multiple
- 0.83×
- Total profit
- $-5,995
- Equity at exit
- $18,936
- IRR
- 4.6%
- Equity multiple
- 1.33×
- Total profit
- $11,612
- Equity at exit
- $10,981
Cash invested: $35,560 (down + closing). Projections, not guarantees.
Landlord ↔ Tenant lean methodology
- Overall (STATE)
- 90 Strongly Landlord-Friendly
- State Louisiana
- 90 Strongly Landlord-Friendly · R+12
- County
- — inherits STATE
- City
- — inherits STATE
ZIP-level market 70117
- Rents YoY
- 2.5%
- Active inventory
- 581
- Price-to-rent
- 7.1×
Monthly cashflow live
- Estimated rent
- $1,499 high interval (Pro) →
- Mortgage (P&I)
- −$666
- Tax est. 1.5%
- −$159 /mo · $1,905/yr
- Insurance
- −$53
- Flood insurance flood zone
- −$66 /mo · $798/yr
- HOA
- −$0
- Vacancy / Maint / Mgmt
- −$315
- Net cashflow
- $240
Break-even live
UW: 25.0% down · 7.5% · 30yr · 1.5% tax · 5.0% vac · 8.0% maint · 8.0% mgmt
Financing live
Cash to close
- Down payment
- $31,750
- Closing costs
- $3,810
- Reserves months
- —
- Total cash needed
- —
Loan-product check · same deal, 3 products live
Conventional
25% down · 7.5% · 30yr
- Down + closing
- —
- Monthly P&I
- —
- Monthly cashflow
- —
- DSCR
- —
- Eligible?
- —
Personal DTI + credit; lowest rate.
DSCR
20% down · 8.5% · 30yr
- Down + closing
- —
- Monthly P&I
- —
- Monthly cashflow
- —
- DSCR
- —
- Eligible?
- —
No personal income docs; deal must DSCR.
Hard money
10% down · 12.0% · 12mo
- Down + closing
- —
- Monthly P&I
- —
- Monthly cashflow
- —
- DSCR
- —
- Eligible?
- —
Short-term bridge; refi at stabilization.
Rent comps 40 comps
| Address | Beds | Baths | Sqft | Rent | $/sqft | DOM | Units | Dist |
|---|---|---|---|---|---|---|---|---|
| 1422 Andry St New Orleans, LA | 3.0 | 2.0 | 1100 | $1,400 | $1.27 | 3d | 1 | 0.09mi |
| 1449 Andry St New Orleans, LA | 2.0 | 1.0 | 833 | $1,300 | $1.56 | 23d | 1 | 0.13mi |
| 18 Saint Claude Ct New Orleans, LA | 3.0 | 1.0 | 864 | $1,200 | $1.39 | 11d | 1 | 0.29mi |
| 1137 Deslonde St New Orleans, LA | 2.0 | 1.0 | 1017 | $1,500 | $1.47 | 23d | 1 | 0.30mi |
| 1301 Lamanche St New Orleans, LA | 3.0 | 2.0 | 1090 | $1,600 | $1.47 | 3d | 1 | 0.34mi |
| 1301 Lamanche St New Orleans, LA | 3.0 | 2.0 | 1090 | $1,600 | $1.47 | 3d | 1 | 0.34mi |
| 918 Forstall St New Orleans, LA | 2.0 | 1.0 | 800 | $2,290 | $2.86 | 23d | 1 | 0.35mi |
| 920 Forstall St New Orleans, LA | 2.0 | 1.0 | 800 | $1,600 | $2.00 | 23d | 1 | 0.35mi |
| 1304 Jourdan Ave New Orleans, LA | 2.0 | 2.0 | 890 | $959 | $1.08 | 16d | 6 | 0.35mi |
| 5109 Burgundy St New Orleans, LA | 2.0 | 1.0 | 1122 | $1,474 | $1.31 | 17d | 1 | 0.36mi |
| 1835 Andry St New Orleans, LA | 3.0 | 2.0 | 918 | $1,800 | $1.96 | 23d | 1 | 0.38mi |
| 1810 Fats Domino Ave New Orleans, LA | 2.0 | 2.0 | 975 | $916 | $0.94 | 23d | 1 | 0.41mi |
| 816 Forstall St New Orleans, LA | 3.0 | 1.0 | 850 | $1,600 | $1.88 | 23d | 1 | 0.42mi |
| 4824 N Rampart St New Orleans, LA | 2.0 | 1.0 | 606 | $1,450 | $2.39 | 23d | 1 | 0.42mi |
| 4824 N Rampart St New Orleans, LA | 2.0 | 1.0 | 606 | $1,450 | $2.39 | 3d | 1 | 0.42mi |
| 4826 N Rampart St Unit 4826 New Orleans, LA | 2.0 | 1.0 | 850 | $1,200 | $1.41 | 23d | 1 | 0.42mi |
| 5805 Saint Claude Ave New Orleans, LA | 2.0 | 1.0 | 800 | $1,200 | $1.50 | 23d | 1 | 0.42mi |
| 924 Deslonde St Unit B New Orleans, LA | 2.0 | 1.0 | 658 | $1,250 | $1.90 | 23d | 1 | 0.43mi |
| 5900 N Derbigny St Unit 1 New Orleans, LA | 3.0 | 2.0 | 1000 | $1,950 | $1.95 | 3d | 1 | 0.52mi |
| 1030 Gordon St New Orleans, LA | 2.0 | 1.0 | 675 | $12,000 | $17.78 | 43d | 1 | 0.52mi |
| 1030 Gordon St New Orleans, LA | 2.0 | 1.0 | 675 | $1,200 | $1.78 | 3d | 1 | 0.52mi |
| 1030 Gordon St New Orleans, LA | 2.0 | 1.0 | 675 | $1,200 | $1.78 | 3d | 1 | 0.52mi |
| 6002 Saint Claude Ave New Orleans, LA | 2.0 | 2.0 | 965 | $1,275 | $1.32 | 21d | 1 | 0.53mi |
| 4801 Dauphine St Unit B New Orleans, LA | 2.0 | 1.0 | 875 | $1,100 | $1.26 | 23d | 1 | 0.53mi |
| 5317 N Galvez St New Orleans, LA | 2.0 | 1.0 | 796 | $1,275 | $1.60 | 3d | 1 | 0.55mi |
| 5434 Chartres St New Orleans, LA | 2.0 | 1.0 | 800 | $1,150 | $1.44 | 23d | 1 | 0.60mi |
| 4545 Urquhart St Unit B New Orleans, LA | 2.0 | 1.0 | 700 | $1,150 | $1.64 | 23d | 1 | 0.61mi |
| 6038 N Rampart St New Orleans, LA | 3.0 | 2.0 | 1080 | $1,795 | $1.66 | 23d | 1 | 0.61mi |
| 4543 Urquhart St Unit B New Orleans, LA | 2.0 | 1.0 | 700 | $1,150 | $1.64 | 11d | 1 | 0.61mi |
| 6019 Royal St New Orleans, LA | 2.0 | 1.0 | 790 | $1,200 | $1.52 | 23d | 1 | 0.68mi |
| 1334 Tricou St New Orleans, LA | 2.0 | 1.0 | 1117 | $1,500 | $1.34 | 21d | 1 | 0.69mi |
| 924 Kentucky St New Orleans, LA | 2.0 | 1.0 | 1102 | $1,700 | $1.54 | 3d | 1 | 0.75mi |
| 1420 Delery St New Orleans, LA | 2.0 | 1.0 | 900 | $1,250 | $1.39 | 11d | 1 | 0.76mi |
| 4318 N Rampart St New Orleans, LA | 2.0 | 1.0 | 750 | $1,100 | $1.47 | 23d | 1 | 0.82mi |
| 1319 France St New Orleans, LA | 2.0 | 1.0 | 923 | $975 | $1.06 | 21d | 1 | 0.84mi |
| 716 Delery St Unit 716 New Orleans, LA | 2.0 | 1.0 | 900 | $1,200 | $1.33 | 23d | 1 | 0.85mi |
| 4222 N Johnson St New Orleans, LA | 3.0 | 2.0 | 1100 | $1,895 | $1.72 | 23d | 1 | 0.92mi |
| 1015 Government St Unit 11 Arabi, LA | 2.0 | 1.0 | 720 | $999 | $1.39 | 43d | 1 | 0.92mi |
| 1333 Angela Ave Arabi, LA | 3.0 | 2.0 | 1090 | $1,850 | $1.70 | 2d | 1 | 0.94mi |
| 4217 N Johnson St New Orleans, LA | 3.0 | 2.0 | 904 | $1,650 | $1.83 | 23d | 1 | 0.94mi |
Listing history 18 events
-
2026-06-18days on market $127,000 Active 115 DOM
-
2026-06-17days on market $127,000 Active 114 DOM
-
2026-06-16days on market $127,000 Active 113 DOM
-
2026-06-15days on market $127,000 Active 112 DOM
-
2026-06-13days on market $127,000 Active 110 DOM
-
2026-06-10days on market $127,000 Active 107 DOM
-
2026-06-09days on market $127,000 Active 106 DOM
-
2026-06-08days on market $127,000 Active 105 DOM
-
2026-06-07days on market $127,000 Active 104 DOM
-
2026-06-05days on market $127,000 Active 101 DOM
-
2026-06-03days on market $127,000 Active 100 DOM
-
2026-06-02days on market $127,000 Active 99 DOM
-
2026-06-01days on market $127,000 Active 98 DOM
-
2026-05-31days on market $127,000 Active 97 DOM
-
2026-04-06price $127,000 501-char remark
Show marketing remark (513 chars)
Great opportunity in the heart of the Lower Ninth Ward! This 3-bedroom, 2-bath fixer-upper offers an open floor plan and neutral paint throughout, providing the perfect canvas to make it your own. Whether you’re looking for your next home or a smart investment property, this one has strong potential. Conveniently located near shopping centers, parks, and just minutes from the heart of New Orleans. Priced attractively at $137,000 and sold as-is. Don’t miss this chance to bring your vision to life!
-
2026-04-06price $127,000 513-char remark
Show marketing remark (513 chars)
Great opportunity in the heart of the Lower Ninth Ward! This 3-bedroom, 2-bath fixer-upper offers an open floor plan and neutral paint throughout, providing the perfect canvas to make it your own. Whether you’re looking for your next home or a smart investment property, this one has strong potential. Conveniently located near shopping centers, parks, and just minutes from the heart of New Orleans. Priced attractively at $137,000 and sold as-is. Don’t miss this chance to bring your vision to life!
-
2026-02-23$137,000 Active 501-char remark
Show marketing remark (513 chars)
Great opportunity in the heart of the Lower Ninth Ward! This 3-bedroom, 2-bath fixer-upper offers an open floor plan and neutral paint throughout, providing the perfect canvas to make it your own. Whether you’re looking for your next home or a smart investment property, this one has strong potential. Conveniently located near shopping centers, parks, and just minutes from the heart of New Orleans. Priced attractively at $137,000 and sold as-is. Don’t miss this chance to bring your vision to life!
-
2026-02-23$137,000 Active 513-char remark
Show marketing remark (513 chars)
Great opportunity in the heart of the Lower Ninth Ward! This 3-bedroom, 2-bath fixer-upper offers an open floor plan and neutral paint throughout, providing the perfect canvas to make it your own. Whether you’re looking for your next home or a smart investment property, this one has strong potential. Conveniently located near shopping centers, parks, and just minutes from the heart of New Orleans. Priced attractively at $137,000 and sold as-is. Don’t miss this chance to bring your vision to life!
ⓘ Source: listings_history table (triggers on properties + properties_extension) + one-shot
backfill from property_details.listing_events for pre-trigger history.
Climate risk First Street
- Flood 8/10 Severe FEMA zone X (shaded) · 60% chance over 30 yrs
- Wildfire 1/10 Low
- Heat 10/10 Extreme 7 d/yr ≥108°F today · 21 d/yr by 30 yrs out
- Wind 10/10 Extreme 99% chance of damaging wind over 30 yrs
- Air quality 3/10 Moderate 3 unhealthy d/yr today · 3 by 30 yrs out
Nearby sold comps map
Loading sold comps map…
Walkable amenities ~0.75 mi
Loading nearby amenities…
Taxation est. · year 1
- Rental income
- $17,987
- − Mortgage interest
- −$7,114
- − Property taxes
- −$1,905
- − Insurance
- −$1,432
- − Repairs & maintenance
- −$1,439
- − Management
- −$1,439
- − Depreciation
- −$3,695
- Taxable income
- $963
- Est. tax owed @ 24.0%
- −$231
- After-tax cash flow
- $2,649/yr
For passive investors: Depreciation is non-cash, so a rental often shows a tax loss while cash-flowing — sheltering income. Rental losses are passive: they offset passive income freely, and up to $25,000/yr can offset ordinary (W-2) income if you actively participate and your MAGI is under $100k (phasing out to $0 by $150k); unused losses carry forward. On sale, claimed depreciation is recaptured at up to 25%, and gains may owe capital-gains tax (a 1031 exchange can defer both). Figures are a year-1 estimate at your 24.0% rate — not tax advice; consult a CPA.
Schools (NCES district)
- District
- Orleans Parish
- NCES district ID
- 2201170
- Math proficiency
- 11% ▼ -52.00%
- Reading proficiency
- 27% ▼ -46.00%
- Median HH income
- $37,011
- Composite
- 15.78/100
- National rank
- #9271
- State rank
- #69 of 98 in LA
Livability — New Orleans
- Score
- 81/100
- State rank
- #3
- US rank
- #1383
Category grades
Schools grade is shown separately in the Schools card above.
Census & demographics
- Census place
- New Orleans, LA
- County
- Orleans Parish · 338,817 people
- City population
- 338,817
- Metro
- New Orleans-Metairie, LA
- Population (ZIP)
- 25,652
- Household income
- $45,764
- Rent vs Own
- Severe rent burden
- 1988.0
Population outlook (Orleans County) Hauer SSP2
- Today (2025)
- 513,025 people
- By 2030
- 575,781 · +12.2%
- By 2040
- 700,174 · +36.5%
- By 2050
- 826,541 · +61.1%
- By 2075
- 1,123,374 · +119.0%
- By 2100
- 1,355,609 · +164.2%
Race, ethnicity, and origin ACS 2023
- Neighborhood character
- Majority Black (60%)
- Race & ethnicity
- Black 60% White 30% Two or more races 6% Hispanic / Latino 5%
- Common ancestry
- Lithuanian 5% Italian 1% Romanian 1%
- Foreign-born
- 5% · Canada, South Korea
- Languages at home
- 93% English-only · Spanish 3% Other Indo-European 1% French/Haitian/Cajun 1%
Political lean MEDSL · Orleans
- 2024 margin
- Solid D (+67.0) · D 82.2% · R 15.2% · Other 2.7%
- 2008→2024 swing
- +6.7pp toward D · 2008: 60.3pp · 2024: 67.0pp
- All cycles
- 2024: D+67.0 2020: D+68.2 2016: D+66.2 2012: D+62.5 2008: D+60.3
Not yet ingested
- Civics
- —
Market trends
- HPI YoY
- ▼ -177.22%
- Current HPI
- 184.6061
- Rent YoY
- ▲ 2.49%
- Metro
- New Orleans-Metairie, LA
- State GDP YoY
- ▲ 3.29%
- F500 in state
- 10
Industry mix (Fortune 500 HQ in LA)
| Industry | F500 HQs | Revenue |
|---|---|---|
| Telecommunications | 2 | $23B |
|
||
| Utilities | 1 | $12B |
|
||
| Wholesale / Distribution | 1 | $5B |
|
||
| Advertising | 1 | $2B |
|
||
Price history
-7.3% since first listed4 events — show timeline
- 2026-04-06 Price Changed $127,000 AcadianaMLS
- 2026-04-06 Price Changed $127,000 GSREIN
- 2026-02-23 Listed $137,000 GSREIN
- 2026-02-23 Listed $137,000 AcadianaMLS
Property tax history
-14.2%/yrLatest (2026): $156 · +0.0% YoY. Source: county tax records.
Cash-flow waterfall
monthlySold comps — $/sqft
last 12 mo · ≤1 miLoading sold comps…