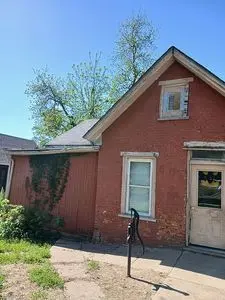
509 1st Corso · Nebraska City, NE
Flood risk 1/10 · Minimal
- FEMA flood zone
- X (unshaded)
- Chance of flooding over 30 yrs
- 0.0%
- Est. flood insurance / yr
- $473 – $860
Fire risk 4/10 · Minor
- Est. fire insurance / yr
- $1,161 – $2,155
Heat risk 4/10 · Minor
- Hot days now (above 104°F)
- 7 days/yr
- Hot days in 30 yrs
- 15 days/yr
Wind risk 2/10 · Minimal
- Chance of severe wind over 30 yrs
- —
Air-quality risk 1/10 · Minimal
- Unhealthy air days now
- 0 days/yr
- Unhealthy air days in 30 yrs
- 0 days/yr
Risk factors via First Street. Map © Google.
Why this score? — see what drove the B- grade
The composite is a weighted blend of 9 inputs, each scored 0–100. Each bar is that input's sub-score; the figure is the points it added to the 100-point composite (weight × sub-score).
- Cash flow +30.0/30.0
- DSCR +10.0/10.0
- 1% rule +9.1/10.0
- ARV discount +7.5/15.0
- Livability +4.0/5.0
- Rent growth +2.5/5.0
- Schools +2.5/10.0
- Condition / age +2.5/5.0
- Appreciation +0.0/10.0
$75,000
🖨 Deal sheet 📄 Offer letter ✓ Due diligence
Listing remarks
This house is a block from main street. Features a private wrap around drive, gazebo, back patio, and indoor patio with surrounding windows to look into the back yard in the mornings. It& apos; s a fixer upper as it is old. Just to small for us and buying some thing bigger. Not willing to finance. Has a new hot water heater, central cooling and heating, and new windows. Selling as is. Im a quiet friendly neighborhood. The yards are decent size and very private. Serious Inquiries only. Firm on price but may be willing to negotiate.
Key facts
- Gazebo
- New hot water heater
- Indoor patio
Tags
Neighborhood map
What this means for you Summary
Snapshot
- This is a 1-bed/1.0-bath single-family listed at $75k.
Deal economics
- At list price, monthly cash flow is $377 ($5k/yr) — positive.
- The deal already cash-flows at list — no discount required.
- Meets the 1% rule at list price ($1k rent vs $75k).
- Cap rate 12.3% vs local median 4.0% in Nebraska City — top-decile yield for the area; either an underpriced asset or a hidden risk that comps aren't pricing in. Stress-test before assuming the spread holds.
Location & tenants
- Location reads 80/100 on livability (#36 in NE, #1,882 nationally) — a professional / high-income tenant draw. Strengths: crime A+, cost of living A+, housing A+; Watch: schools D, commute F.
- Nebraska City Public Schools (town): math 26% / reading 32% proficiency, ranked #107 of 111 in NE (top 96%) — low school quality limits family demand, transient renter base, plan for 1-2y turnover.
- Market conditions: 33 active listings in the ZIP; 3 comparable units currently listed for rent nearby; rentals leasing fast (median 10d on market — plan ~1-2 weeks tenant-placement turnaround); 29 units permitted in Otoe County in 2024 (0 in 5+ unit buildings).
Forward outlook
- Local home prices are declining (-3.0%/yr); year-one equity from $519 of loan paydown is wiped out by about $2k of value loss. Plan a longer hold.
- Otoe County population projected at +4% by 2050 — modest demand growth; plan on rents tracking national, not racing it.
- At projected returns (-3.0% appreciation + 3.0% rent growth), your $21k cash investment doubles in ~6 years — after that, you're playing with house money.
Negotiation context
- Only 8 days on market — expect competitive offers; lowballing is unlikely to land.
Risks & watch-outs
- Watch-outs: built in 1930 — expect roof / HVAC / electrical / plumbing capex.
Questions for the listing agent
- Built in 1930 — when were the roof, HVAC, electrical panel, plumbing, and water heater last replaced?
- Is there a deadline driving the sale (1031 exchange, divorce, estate, relocation)? That informs how much negotiation room exists.
- Schools are D-rated, which usually means shorter tenancies and higher turnover. Who's the typical renter profile here, and what's been the actual vacancy rate?
- What's the average days-on-market for RENTAL listings here right now (not sales)? A rising rental-DOM trend means longer vacancies and softer asking-rent achievability than the comps imply.
- What's the recent tenant-quality profile in this submarket — average credit score on applications, eviction rate, late-payment / NSF rate, and stable-employment percentage? A property-management company in the area should have these aggregated.
- How much new for-sale + rental construction is in the pipeline within 1–3 miles? Heavy new supply typically softens prices + rents 12–24 months out; constrained supply supports both.
Investment metrics
- 1% rule
- 1.41% ✓
- Cap rate
- 12.32%
- Cash-on-cash
- 21.53%
- DSCR
- 1.96
- GRM
- 5.9
CMA / ARV
- ARV (on-the-fly)
- $154,350
- Comps found
- 7
Show comp detail 7 sales within ~0.75 mi
| Address | Dist | Beds/Ba | Sqft | Sold | Price | $/sf | Match |
|---|---|---|---|---|---|---|---|
| 421 1st Corso | 0.04mi | 2/1.0 (+1) | 960 (-9%) | 6mo | $143,000 | $149 | 74 |
| 219 6th Ter | 0.48mi | 2/1.0 (+1) | 1,020 (-3%) | 9mo | $150,000 | $147 | 60 |
| 1502 2nd Ave | 0.69mi | 2/2.0 (+1) | 1,029 (-2%) | 3mo | $160,000 | $155 | 53 |
| 318 N 14 St | 0.62mi | 2/1.0 (+1) | 1,071 (+2%) | 14mo | $90,000 | $84 | 51 |
| 409 N 14th St | 0.66mi | 2/1.0 (+1) | 979 (-7%) | 9mo | $129,000 | $132 | 46 |
| 712 4th Corso | 0.17mi | 2/2.0 (+1) | 1,180 (+12%) | 24mo | $185,000 | $157 | 42 |
| 1315 4th Corso | 0.58mi | 2/2.0 (+1) | 1,193 (+14%) | 10mo | $167,500 | $140 | 33 |
Match score weights: distance 35% · size 25% · config 20% · recency 20%. Top-matched comps best support the ARV.
Projected returns pro-forma
-3.0% appreciation · 3.0% rent growth · sell at horizon
- IRR
- 14.1%
- Equity multiple
- 1.56×
- Total profit
- $11,824
- Equity at exit
- $11,183
- IRR
- 22.9%
- Equity multiple
- 2.96×
- Total profit
- $41,118
- Equity at exit
- $6,485
Cash invested: $21,000 (down + closing). Projections, not guarantees.
Landlord ↔ Tenant lean methodology
- Overall (STATE)
- 83 Strongly Landlord-Friendly
- State Nebraska
- 83 Strongly Landlord-Friendly · R+13
- County
- — inherits STATE
- City
- — inherits STATE
ZIP-level market 68410
- Home prices YoY
- -31.5%
- Active inventory
- 33
- Price-to-rent
- 5.9×
Monthly cashflow live
- Estimated rent
- $1,060 medium interval (Pro) →
- Mortgage (P&I)
- −$393
- Tax from tax record
- −$36 /mo · $433/yr
- Insurance
- −$31
- HOA
- −$0
- Vacancy / Maint / Mgmt
- −$223
- Net cashflow
- $377
Break-even live
UW: 25.0% down · 7.5% · 30yr · 1.5% tax · 5.0% vac · 8.0% maint · 8.0% mgmt
Financing live
Cash to close
- Down payment
- $18,750
- Closing costs
- $2,250
- Reserves months
- —
- Total cash needed
- —
Loan-product check · same deal, 3 products live
Conventional
25% down · 7.5% · 30yr
- Down + closing
- —
- Monthly P&I
- —
- Monthly cashflow
- —
- DSCR
- —
- Eligible?
- —
Personal DTI + credit; lowest rate.
DSCR
20% down · 8.5% · 30yr
- Down + closing
- —
- Monthly P&I
- —
- Monthly cashflow
- —
- DSCR
- —
- Eligible?
- —
No personal income docs; deal must DSCR.
Hard money
10% down · 12.0% · 12mo
- Down + closing
- —
- Monthly P&I
- —
- Monthly cashflow
- —
- DSCR
- —
- Eligible?
- —
Short-term bridge; refi at stabilization.
Rent comps 3 comps
| Address | Beds | Baths | Sqft | Rent | $/sqft | DOM | Units | Dist |
|---|---|---|---|---|---|---|---|---|
| 1306 1st Ave Unit 2 Nebraska City, NE | 1.0 | 1.0 | 850 | $1,100 | $1.29 | 1d | 1 | 0.55mi |
| 1116 S 2nd St Unit 207 Nebraska City, NE | 2.0 | 1.0 | 735 | $895 | $1.22 | 10d | 1 | 0.60mi |
| 1413 2nd Ave Unit 2 Nebraska City, NE | 2.0 | 1.0 | 1100 | $1,150 | $1.05 | 19d | 1 | 0.64mi |
Listing history 7 events
-
2026-06-18days on market $75,000 Active 8 DOM
-
2026-06-17days on market $75,000 Active 7 DOM
-
2026-06-16days on market $75,000 Active 6 DOM
-
2026-06-15days on market $75,000 Active 5 DOM
-
2026-06-13days on market $75,000 Active 3 DOM
-
2026-06-12remarks 536-char remark
-
2026-06-12$75,000 Active 2 DOM
ⓘ Source: listings_history table (triggers on properties + properties_extension) + one-shot
backfill from property_details.listing_events for pre-trigger history.
Tax reassessment forecast NE · Resets to sale price
- Current annual tax
- $433 · $36/mo
- Projected year-2 tax
- $1,298 · $108/mo
- Expected delta
- +$865/yr (+$72/mo · 199.7%)
ⓘ Screening estimate from a state-policy table — verify with the county assessor before closing.
Climate risk First Street
- Flood 1/10 Low FEMA zone X (unshaded) · 0% chance over 30 yrs
- Wildfire 4/10 Moderate
- Heat 4/10 Moderate 7 d/yr ≥104°F today · 15 d/yr by 30 yrs out
- Wind 2/10 Low
- Air quality 1/10 Low 0 unhealthy d/yr today · 0 by 30 yrs out
Nearby sold comps map
Loading sold comps map…
Walkable amenities ~0.75 mi
Loading nearby amenities…
Taxation est. · year 1
- Rental income
- $12,720
- − Mortgage interest
- −$4,201
- − Property taxes
- −$433
- − Insurance
- −$375
- − Repairs & maintenance
- −$1,018
- − Management
- −$1,018
- − Depreciation
- −$2,182
- Taxable income
- $3,494
- Est. tax owed @ 24.0%
- −$839
- After-tax cash flow
- $3,683/yr
For passive investors: Depreciation is non-cash, so a rental often shows a tax loss while cash-flowing — sheltering income. Rental losses are passive: they offset passive income freely, and up to $25,000/yr can offset ordinary (W-2) income if you actively participate and your MAGI is under $100k (phasing out to $0 by $150k); unused losses carry forward. On sale, claimed depreciation is recaptured at up to 25%, and gains may owe capital-gains tax (a 1031 exchange can defer both). Figures are a year-1 estimate at your 24.0% rate — not tax advice; consult a CPA.
Schools (NCES district)
- District
- Nebraska City Public Schools
- NCES district ID
- 3174160
- Math proficiency
- 26% ▼ -7.00%
- Reading proficiency
- 32% ▼ -2.00%
- Median HH income
- $46,153
- Composite
- 24.99/100
- National rank
- #7559
- State rank
- #107 of 111 in NE
Livability — Nebraska City
- Score
- 80/100
- State rank
- #36
- US rank
- #1882
Category grades
Schools grade is shown separately in the Schools card above.
Census & demographics
- Census place
- Nebraska City, NE
- Population (ZIP)
- 8,946
Population outlook (Otoe County) Hauer SSP2
- Today (2025)
- 16,475 people
- By 2030
- 16,627 · +0.9%
- By 2040
- 16,911 · +2.6%
- By 2050
- 17,186 · +4.3%
- By 2075
- 18,549 · +12.6%
- By 2100
- 19,590 · +18.9%
Race, ethnicity, and origin ACS 2023
- Neighborhood character
- Predominantly White (83%)
- Race & ethnicity
- White 83% Hispanic / Latino 12% Two or more races 7% Black 1%
- Hispanic origin (detail)
- Mexican 2%
- Common ancestry
- Romanian 3% Italian 2% Iranian 1%
- Foreign-born
- 11% · Canada, Jamaica
- Languages at home
- 89% English-only · Spanish 10%
Political lean MEDSL · Otoe
- 2024 margin
- Solid R (+38.9) · D 30.0% · R 68.9% · Other 1.0%
- 2008→2024 swing
- -23.1pp toward R · 2008: -15.8pp · 2024: -38.9pp
- All cycles
- 2024: R+38.9 2020: R+37.8 2016: R+38.7 2012: R+24.4 2008: R+15.8
Not yet ingested
- Civics
- —
Market trends
- HPI YoY
- ▼ -87.60%
- Current HPI
- 190.5812
- Rent YoY
- —
- Metro
- —
- State GDP YoY
- ▲ 0.68%
- F500 in state
- 2
Industry mix (Fortune 500 HQ in NE)
| Industry | F500 HQs | Revenue |
|---|---|---|
| Conglomerate | 1 | $371B |
|
||
Price history
1 event — show timeline
- 2026-06-11 Listed $75,000 FSBO.com
Property tax history
-3.3%/yrLatest (2025): $433 · +15.4% YoY. Source: county tax records.
Cash-flow waterfall
monthlySold comps — $/sqft
last 12 mo · ≤1 miLoading sold comps…