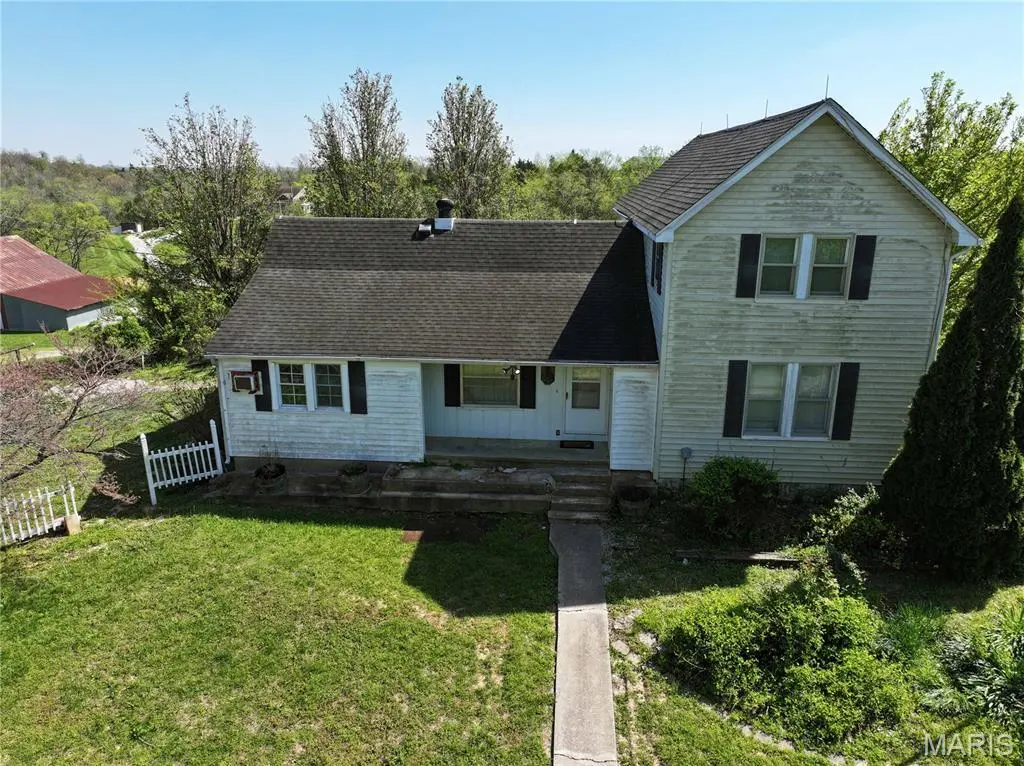
5459 Highway A · Frohna, MO
Flood risk No data
- FEMA flood zone
- —
- Chance of flooding over 30 yrs
- —
- Est. flood insurance / yr
- —
Fire risk No data
- Est. fire insurance / yr
- —
Heat risk No data
- Hot days now (above threshold)
- —
- Hot days in 30 yrs
- —
Wind risk No data
- Chance of severe wind over 30 yrs
- —
Air-quality risk No data
- Unhealthy air days now
- —
- Unhealthy air days in 30 yrs
- —
Risk factors via First Street. Map © Google.
Why this score? — see what drove the C- grade
The composite is a weighted blend of 9 inputs, each scored 0–100. Each bar is that input's sub-score; the figure is the points it added to the 100-point composite (weight × sub-score).
- Cash flow +15.0/30.0
- ARV discount +7.5/15.0
- Appreciation +6.9/10.0
- 1% rule +5.0/10.0
- DSCR +5.0/10.0
- Schools +3.7/10.0
- Livability +3.0/5.0
- Rent growth +2.5/5.0
- Condition / age +2.5/5.0
$1
🖨 Deal sheet (PDF) 📄 Offer letter ✓ Due diligence
Listing remarks
Charming Country Farmhouse on 8.45 Acres – Just Outside Frohna Escape to the peaceful countryside with this charming 2-story farmhouse nestled on 8.45 picturesque acres just outside of Frohna. This inviting home blends timeless character with rural tranquility, offering the perfect setting for a hobby farm, weekend retreat, or full-time country living. Step inside to discover original hardwood floors that add warmth and historic charm throughout the home. The spacious layout provides plenty of room to make it your own while preserving the farmhouse’s classic appeal. Outside, the property truly shines. The acreage offers open space for livestock, gardening, or simply enjoying the
Key facts
- 8.45 acres
- Versatile acreage
- Public water access
Tags
Property features AI
Finance
- Other: Lot size approximately 8.45 acres
- Financial info: No investor or income/expense information provided
- HOA & community: No HOA information provided
Exterior
- Parking: No parking details provided
- Security: No security details provided
- Utilities: Public water; Septic tank sewer; Single-phase electric; Water connected
- Home design: Single-family residence; Two levels; Residential property
- Construction: Vinyl siding; Year built not specified
- Exterior features: Back yard; Front yard; Some trees and scattered woods; Gentle sloping terrain; Farm setting
Interior
- Kitchen: No kitchen appliance details provided
- Bedrooms: Four bedrooms total; Two bedrooms on the main level; Two bedrooms on the upper level
- Flooring: No flooring details provided
- Bathrooms: One full bathroom
- Heating & cooling: Baseboard heating; Window/wall air conditioning units
- Interior features: Unfinished basement; Five total rooms
- Laundry & utility: No laundry appliance details provided
Neighborhood map
What this means for you Summary
Snapshot
- This is a 4-bed/1.0-bath other listed at $1.
Deal economics
- At list price, monthly cash flow is $984 ($12k/yr) — positive.
- The deal already cash-flows at list — no discount required.
- Meets the 1% rule at list price ($1k rent vs $1).
Location & tenants
- Location reads 59/100 on livability (#548 in MO) — a working-class tenant base; expect higher turnover. Strengths: cost of living A+, housing A+; Watch: employment D+, crime D-, amenities F.
- Altenburg 48 (rural): math 40% / reading 40% proficiency, ranked #274 of 535 in MO (top 51%) — families likely to look elsewhere, expect single-tenant / working-renter base with shorter leases.
- Zoned schools: Altenburg Elem. (math 52% / reading 67%, grade B-, #124 of 1,115 statewide, top 13%, 110 students, 28% FRL) — zoned schools at 28% FRL track the district average.
- Zoned-school proficiency averages 60% at this address vs 40% district-wide (+20 pts) — the actual schools serving this property are materially stronger than the Altenburg 48 average implies; a family-tenant draw the district grade alone would hide.
- Market conditions: 2 active listings in the ZIP; 36 units permitted in Perry County in 2024 (0 in 5+ unit buildings).
Forward outlook
- At projected returns (3.8% appreciation + 3.0% rent growth), your $0 cash investment doubles in ~1 year — after that, you're playing with house money.
Negotiation context
- It's been on market 28 days — a 2% lower offer ($0) is reasonable based on typical stale-listing flexibility.
Risks & watch-outs
- Watch-outs: built in 1920 — expect roof / HVAC / electrical / plumbing capex.
Questions for the listing agent
- Built in 1920 — when were the roof, HVAC, electrical panel, plumbing, and water heater last replaced?
- Is there a deadline driving the sale (1031 exchange, divorce, estate, relocation)? That informs how much negotiation room exists.
- Schools are F-rated, which usually means shorter tenancies and higher turnover. Who's the typical renter profile here, and what's been the actual vacancy rate?
- Crime grade is D in this area — have there been break-ins, vandalism, or insurance claims at this property in the last 3 years? What carrier currently insures it and at what premium?
- What's the average days-on-market for RENTAL listings here right now (not sales)? A rising rental-DOM trend means longer vacancies and softer asking-rent achievability than the comps imply.
- What's the recent tenant-quality profile in this submarket — average credit score on applications, eviction rate, late-payment / NSF rate, and stable-employment percentage? A property-management company in the area should have these aggregated.
- How much new for-sale + rental construction is in the pipeline within 1–3 miles? Heavy new supply typically softens prices + rents 12–24 months out; constrained supply supports both.
Investment metrics
- 1% rule
- 124556.00% ✓
- Cap rate
- 1180788.88%
- Cash-on-cash
- 4217080.67%
- DSCR
- 187637.36
- GRM
- 0.0
CMA / ARV
No comps found within radius.
Projected returns pro-forma
3.76% appreciation · 3.0% rent growth · sell at horizon
- IRR
- —
- Equity multiple
- 223892.12×
- Total profit
- $62,690
- Equity at exit
- $0
- IRR
- —
- Equity multiple
- 483443.92×
- Total profit
- $135,364
- Equity at exit
- $1
Cash invested: $0 (down + closing). Projections, not guarantees.
Landlord ↔ Tenant lean methodology
- Overall (STATE)
- 81 Strongly Landlord-Friendly
- State Missouri
- 81 Strongly Landlord-Friendly · R+10
- County
- — inherits STATE
- City
- — inherits STATE
ZIP-level market 63748
- Home prices YoY
- 1.6%
- Active inventory
- 2
Monthly cashflow live
- Estimated rent
- $1,246 medium interval (Pro) →
- Mortgage (P&I)
- −$0
- Tax est. 1.5%
- −$0 /mo · $0/yr
- Insurance
- −$0
- HOA
- −$0
- Lot rent
- −$0
- Vacancy / Maint / Mgmt
- −$262
- Net cashflow
- $984
Break-even live
Sensitivity live
| Price | -10% $984 | -5% $984 | +0% $984 | +5% $984 | +10% $984 |
|---|---|---|---|---|---|
| Rent | -10% $886 | -5% $935 | +0% $984 | +5% $1,033 | +10% $1,082 |
| Rate | -1.0pp $984 | -0.5pp $984 | base $984 | +0.5pp $984 | +1.0pp $984 |
UW: 25.0% down · 7.5% · 30yr · 1.5% tax · 5.0% vac · 8.0% maint · 8.0% mgmt
Financing live
Cash to close
- Down payment
- $0
- Closing costs
- $0
- Reserves months
- —
- Total cash needed
- —
Loan-product check · same deal, 3 products live
Conventional
25% down · 7.5% · 30yr
- Down + closing
- —
- Monthly P&I
- —
- Monthly cashflow
- —
- DSCR
- —
- Eligible?
- —
Personal DTI + credit; lowest rate.
DSCR
20% down · 8.5% · 30yr
- Down + closing
- —
- Monthly P&I
- —
- Monthly cashflow
- —
- DSCR
- —
- Eligible?
- —
No personal income docs; deal must DSCR.
Hard money
10% down · 12.0% · 12mo
- Down + closing
- —
- Monthly P&I
- —
- Monthly cashflow
- —
- DSCR
- —
- Eligible?
- —
Short-term bridge; refi at stabilization.
Listing history 3 events
-
2026-05-07status Pending
-
2026-04-09$1 Active
-
2011-10-28soldstatus
ⓘ Source: listings_history table (triggers on properties + properties_extension) + one-shot
backfill from property_details.listing_events for pre-trigger history.
Nearby sold comps map
Loading sold comps map…
Walkable amenities ~0.75 mi
Loading nearby amenities…
Taxation est. · year 1
- Rental income
- $14,947
- − Mortgage interest
- −$0
- − Property taxes
- −$0
- − Insurance
- −$0
- − Repairs & maintenance
- −$1,196
- − Management
- −$1,196
- − Depreciation
- −$0
- Taxable income
- $12,555
- Est. tax owed @ 24.0%
- −$3,013
- After-tax cash flow
- $8,795/yr
For passive investors: Depreciation is non-cash, so a rental often shows a tax loss while cash-flowing — sheltering income. Rental losses are passive: they offset passive income freely, and up to $25,000/yr can offset ordinary (W-2) income if you actively participate and your MAGI is under $100k (phasing out to $0 by $150k); unused losses carry forward. On sale, claimed depreciation is recaptured at up to 25%, and gains may owe capital-gains tax (a 1031 exchange can defer both). Figures are a year-1 estimate at your 24.0% rate — not tax advice; consult a CPA.
Schools (NCES district)
- District
- Altenburg 48
- NCES district ID
- 2903040
- Math proficiency
- 40% ▬ 0.00%
- Reading proficiency
- 40% ▼ -10.00%
- Median HH income
- $54,941
- Composite
- 37.39/100
- National rank
- #8921
- State rank
- #274 of 535 in MO
Livability — Frohna
- Score
- 59/100
- State rank
- #548
- US rank
- #20186
Category grades
Schools grade is shown separately in the Schools card above.
Census & demographics
- Population (ZIP)
- 1,296
Population outlook (Perry County) Hauer SSP2
- Today (2025)
- 19,583 people
- By 2030
- 19,714 · +0.7%
- By 2040
- 19,695 · +0.6%
- By 2050
- 19,172 · -2.1%
- By 2075
- 17,199 · -12.2%
- By 2100
- 13,661 · -30.2%
Race, ethnicity, and origin ACS 2023
- Neighborhood character
- Predominantly White (96%)
- Race & ethnicity
- White 96% Two or more races 4%
- Common ancestry
- Serbian 2% Lithuanian 1% Romanian 1%
- Languages at home
- 92% English-only · German/W. Germanic 8%
Political lean MEDSL · Perry
- 2024 margin
- Solid R (+63.4) · D 17.9% · R 81.3%
- 2008→2024 swing
- -34.2pp toward R · 2008: -29.2pp · 2024: -63.4pp
- All cycles
- 2024: R+63.4 2020: R+63.4 2016: R+61.7 2012: R+43.6 2008: R+29.2
Not yet ingested
- Civics
- —
Market trends
- HPI YoY
- ▲ 3.76%
- Current HPI
- 245.5138
- Rent YoY
- —
- Metro
- —
- State GDP YoY
- ▲ 1.84%
- F500 in state
- 20
Industry mix (Fortune 500 HQ in MO)
| Industry | F500 HQs | Revenue |
|---|---|---|
| Healthcare | 1 | $163B |
|
||
| Insurance | 1 | $21B |
|
||
| Industrial Technology | 1 | $17B |
|
||
| Retail | 1 | $16B |
|
||
| Industrial Distribution | 1 | $10B |
|
||
| Utilities | 1 | $9B |
|
||
Property tax history
+1.8%/yrLatest (2025): $872 · +3.9% YoY. Source: county tax records.
Cash-flow waterfall
monthlySold comps — $/sqft
last 12 mo · ≤1 miLoading sold comps…