 🏗️ New Construction
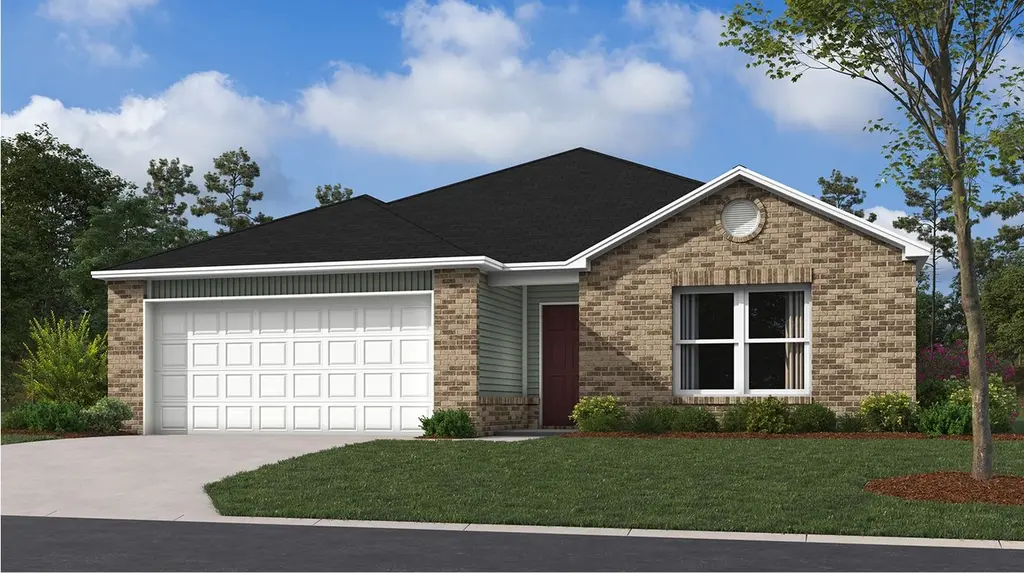
Foster II Plan · Huntsville, AL
Flood risk 1/10 · Minimal
- FEMA flood zone
- X (unshaded)
- Chance of flooding over 30 yrs
- 0.0%
- Est. flood insurance / yr
- $507 – $1,088
Fire risk 1/10 · Minimal
- Est. fire insurance / yr
- $916 – $1,700
Heat risk 5/10 · Moderate
- Hot days now (above 105°F)
- 7 days/yr
- Hot days in 30 yrs
- 18 days/yr
Wind risk 4/10 · Minor
- Chance of severe wind over 30 yrs
- 14.0%
Air-quality risk 2/10 · Minimal
- Unhealthy air days now
- 1 days/yr
- Unhealthy air days in 30 yrs
- 2 days/yr
Risk factors via First Street. Map © Google.
Why this score? — see what drove the F grade
The composite is a weighted blend of 9 inputs, each scored 0–100. Each bar is that input's sub-score; the figure is the points it added to the 100-point composite (weight × sub-score).
- ARV discount +7.5/15.0
- Cash flow +5.7/30.0
- Rent growth +4.2/5.0
- Livability +4.1/5.0
- Schools +3.7/10.0
- Condition / age +2.5/5.0
- Appreciation +1.4/10.0
- 1% rule +1.1/10.0
- DSCR +0.1/10.0
$252,890
🖨 Deal sheet (PDF) 📄 Offer letter ✓ Due diligence
Listing remarks
This new single-story home blends style with functionality. Two secondary bedrooms share a bathroom in the hall at the front of the home, while the owner's suite is tucked into the back corner with a private bathroom. Down the hall is the free-flowing main living area, which includes a kitchen with a center island, a welcoming family room and a dining room with a covered rear patio. A convenient two-car garage completes the home.
Key facts
- Covered rear patio
- Private bathroom
- Single-story home
Tags
Property features AI
Finance
- Other: Status: Active; Last modified: 2026-06-04
- Financial info: List price $252,890; Inventory type: Plan
Exterior
- Parking: 2 total parking spaces; 2-car garage
- Home design: Single-family plan (Foster II); Address: Huntsville, AL 35811
- Exterior features: Living area approx. 1,355
Interior
- Bedrooms: 3 bedrooms
- Bathrooms: 2 full bathrooms
- Interior features: Plan home (Foster II)
Neighborhood map
What this means for you Summary
Snapshot
- This is a 3-bed/2.0-bath single-family listed at $253k.
Deal economics
- At list price, monthly cash flow is $-625 ($-7k/yr) — negative.
- To cash-flow at today's rent, offer at most $212k (16.1% below list).
- To meet the 1% rule (rent ≥ 1% of price), the offer needs to be $186k (26.6% below list).
- Recommended offer: $186k (26.6% below list) — sets the bar for 1% rule.
Location & tenants
- Location reads 82/100 on livability (#3 in AL, #1,082 nationally) — a professional / high-income tenant draw. Strengths: commute A+, cost of living A+, housing A+; Watch: crime F.
- Madison County (rural): math 27% / reading 56% proficiency, ranked #19 of 129 in AL (top 15%) — families likely to look elsewhere, expect single-tenant / working-renter base with shorter leases.
- Zoned schools: Mt Carmel Elementary School (math 37% / reading 72%, grade C, #87 of 627 statewide, top 15%, 646 students, 34% FRL); Buckhorn Middle School (math 19% / reading 59%, grade F, #64 of 257 statewide, top 25%, 688 students, 38% FRL); Buckhorn High School (math 31% / reading 33%, grade F, #59 of 305 statewide, top 21%, 1,287 students, 34% FRL).
- Market conditions: Rents rising fast (+6.8%/yr); 570 active listings in the ZIP; 10 comparable units currently listed for rent nearby; rentals at typical pace (median 25d on market — plan ~3-4 weeks tenant-placement turnaround); 40% of comp listings sitting > 30 days — soft ceiling on asking rent; solid renter incomes; 4,709 units permitted in Madison County in 2024 (1,186 in 5+ unit buildings).
Forward outlook
- Local home prices are declining (-3.0%/yr); year-one equity from $2k of loan paydown is wiped out by about $9k of value loss. Plan a longer hold.
- Madison County population projected at +18% by 2050 — long-run rental-demand tailwind backs the buy-and-hold thesis.
Negotiation context
- It's been on market 17 days — a 2% lower offer ($249k) is reasonable based on typical stale-listing flexibility.
Risks & watch-outs
- Climate carrying-cost: extreme-heat days projected 7→18/yr by 2055 (HVAC capex compounding) — expect insurance premiums to compound above CPI over the hold.
Questions for the listing agent
- What do current leases actually rent for vs. the listed asking? Can we see a recent rent roll and the last 12 months of T-12 income?
- Is there a deadline driving the sale (1031 exchange, divorce, estate, relocation)? That informs how much negotiation room exists.
- Crime grade is F in this area — have there been break-ins, vandalism, or insurance claims at this property in the last 3 years? What carrier currently insures it and at what premium?
- The area grade is low — what's the realistic commute time and amenity access for the typical tenant pool here? Any planned neighborhood developments (good or bad) we should know about?
- What's the average days-on-market for RENTAL listings here right now (not sales)? A rising rental-DOM trend means longer vacancies and softer asking-rent achievability than the comps imply.
- What's the recent tenant-quality profile in this submarket — average credit score on applications, eviction rate, late-payment / NSF rate, and stable-employment percentage? A property-management company in the area should have these aggregated.
- How much new for-sale + rental construction is in the pipeline within 1–3 miles? Heavy new supply typically softens prices + rents 12–24 months out; constrained supply supports both.
Investment metrics
- 1% rule
- 0.61% ✗
- Cap rate
- 3.82%
- Cash-on-cash
- -8.84%
- DSCR
- 0.61
- GRM
- 13.6
CMA / ARV
- ARV (median comp)
- $302,653
- List price
- $252,890
- Delta
- -16.44%
- Verdict
- UNDERPRICED
- Comps
- 20 within 1.0 mi
Show comp detail 7 sales within ~0.75 mi
| Address | Dist | Beds/Ba | Sqft | Sold | Price | $/sf | Match |
|---|---|---|---|---|---|---|---|
| 114 Starling Mill Trl | 0.23mi | 3/2.0 | 1,355 (0%) | 1mo | $245,390 | $181 | 89 |
| 249 Catalyst St | 0.17mi | 3/2.0 | 1,556 (+15%) | 1mo | $286,500 | $184 | 67 |
| 6023 Edwin Jones Dr | 0.39mi | 3/2.0 | 1,475 (+9%) | 19mo | $230,000 | $156 | 51 |
| 417 Tracer St | 0.28mi | 3/2.0 | 1,556 (+15%) | 19mo | $265,000 | $170 | 46 |
| 377 Robinson Rd | 0.68mi | 3/2.0 | 1,525 (+12%) | 10mo | $266,000 | $174 | 39 |
| 135 Oakcrest Rd | 0.74mi | 3/2.0 | 1,551 (+14%) | 4mo | $167,000 | $108 | 38 |
| 3102 Ray Blair Pl | 0.70mi | 3/2.0 | 1,520 (+12%) | 12mo | $286,000 | $188 | 37 |
Match score weights: distance 35% · size 25% · config 20% · recency 20%. Top-matched comps best support the ARV.
Projected returns pro-forma
-3.0% appreciation · 6.81% rent growth · sell at horizon
- IRR
- -27.9%
- Equity multiple
- 0.04×
- Total profit
- $-81,404
- Equity at exit
- $45,127
- IRR
- -16.3%
- Equity multiple
- -0.05×
- Total profit
- $-89,187
- Equity at exit
- $26,168
Cash invested: $84,743 (down + closing). Projections, not guarantees.
Landlord ↔ Tenant lean methodology
- Overall (STATE)
- 90 Strongly Landlord-Friendly
- State Alabama
- 90 Strongly Landlord-Friendly · R+15
- County
- — inherits STATE
- City
- — inherits STATE
ZIP-level market 35811
- Home prices YoY
- -2.1%
- Rents YoY
- 6.8%
- Active inventory
- 570
- Price-to-rent
- 11.3×
Monthly cashflow live
- Estimated rent
- $1,857 high interval (Pro) →
- Mortgage (P&I)
- −$1,587
- Tax est. 1.5%
- −$378 /mo · $4,540/yr
- Insurance
- −$126
- HOA
- −$0
- Vacancy / Maint / Mgmt
- −$390
- Net cashflow
- $-625
Break-even live
Sensitivity live
| Price | -10% $-415 | -5% $-520 | +0% $-625 | +5% $-729 | +10% $-834 |
|---|---|---|---|---|---|
| Rent | -10% $-771 | -5% $-698 | +0% $-625 | +5% $-551 | +10% $-478 |
| Rate | -1.0pp $-472 | -0.5pp $-548 | base $-625 | +0.5pp $-703 | +1.0pp $-783 |
UW: 25.0% down · 7.5% · 30yr · 1.5% tax · 5.0% vac · 8.0% maint · 8.0% mgmt
Financing live
Cash to close
- Down payment
- $75,663
- Closing costs
- $9,080
- Reserves months
- —
- Total cash needed
- —
Loan-product check · same deal, 3 products live
Conventional
25% down · 7.5% · 30yr
- Down + closing
- —
- Monthly P&I
- —
- Monthly cashflow
- —
- DSCR
- —
- Eligible?
- —
Personal DTI + credit; lowest rate.
DSCR
20% down · 8.5% · 30yr
- Down + closing
- —
- Monthly P&I
- —
- Monthly cashflow
- —
- DSCR
- —
- Eligible?
- —
No personal income docs; deal must DSCR.
Hard money
10% down · 12.0% · 12mo
- Down + closing
- —
- Monthly P&I
- —
- Monthly cashflow
- —
- DSCR
- —
- Eligible?
- —
Short-term bridge; refi at stabilization.
Rent comps 10 comps
| Address | Beds | Baths | Sqft | Rent | $/sqft | DOM | Units | Dist |
|---|---|---|---|---|---|---|---|---|
| 100 Marcus Byers Dr NE Huntsville, AL | 1.0–2.0 | 1.0–2.0 | 970 | $1,405 | $1.45 | 15d | 48 | 0.84mi |
| 149 Wolfe Ln Huntsville, AL | 3.0 | 3.0 | 1442 | $2,000 | $1.39 | 15d | 1 | 1.05mi |
| 147 Wolfe Ln Huntsville, AL | 3.0 | 3.0 | 1442 | $2,100 | $1.46 | 15d | 1 | 1.05mi |
| 128 Somerset Park Dr Huntsville, AL | 3.0 | 2.0 | 1570 | $1,750 | $1.11 | 25d | 1 | 1.12mi |
| 229 Paca Ln Huntsville, AL | 3.0 | 2.0 | 1850 | $1,950 | $1.05 | 45d | 1 | 1.14mi |
| 119 Wind Rush Rd Huntsville, AL | 3.0 | 2.0 | 1690 | $1,875 | $1.11 | 45d | 1 | 1.15mi |
| 150 LILLIAN FARMS Blvd Huntsville, AL | 3.0 | 2.0 | 1703 | $1,900 | $1.12 | 25d | 1 | 1.16mi |
| 153 LILLIAN FARMS Blvd Huntsville, AL | 3.0 | 2.0 | 1703 | $1,900 | $1.12 | 25d | 1 | 1.16mi |
| 6111 Homestead Rd Huntsville, AL | 4.0 | 2.0 | 1640 | $2,500 | $1.52 | 45d | 1 | 1.42mi |
| 123 Ann Bradley Dr Huntsville, AL | 3.0 | 2.0 | 1165 | $1,500 | $1.29 | 45d | 1 | 1.50mi |
Listing history 14 events
-
2026-06-22days on market $252,890 Active 17 DOM
-
2026-06-18days on market $252,890 Active 14 DOM
-
2026-06-17days on market $252,890 Active 13 DOM
-
2026-06-16days on market $252,890 Active 12 DOM
-
2026-06-15days on market $252,890 Active 11 DOM
-
2026-06-14days on market $252,890 Active 9 DOM
-
2026-06-10days on market $252,890 Active 6 DOM
-
2026-06-09days on market $252,890 Active 5 DOM
-
2026-06-08days on market $252,890 Active 4 DOM
-
2026-06-07days on market $252,890 Active 3 DOM
-
2026-05-02price $250,640 433-char remark
-
2026-04-23price $245,640 433-char remark
-
2026-03-22price $244,640 433-char remark
-
2026-02-16$244,390 Active 433-char remark
ⓘ Source: listings_history table (triggers on properties + properties_extension) + one-shot
backfill from property_details.listing_events for pre-trigger history.
Climate risk First Street
- Flood 1/10 Low FEMA zone X (unshaded) · 0% chance over 30 yrs
- Wildfire 1/10 Low
- Heat 5/10 Major 7 d/yr ≥105°F today · 18 d/yr by 30 yrs out
- Wind 4/10 Moderate 14% chance of damaging wind over 30 yrs
- Air quality 2/10 Low 1 unhealthy d/yr today · 2 by 30 yrs out
Nearby sold comps map
Loading sold comps map…
Walkable amenities ~0.75 mi
Loading nearby amenities…
Taxation est. · year 1
- Rental income
- $22,283
- − Mortgage interest
- −$16,953
- − Property taxes
- −$4,540
- − Insurance
- −$1,513
- − Repairs & maintenance
- −$1,783
- − Management
- −$1,783
- − Depreciation
- −$8,804
- Taxable loss
- −$13,093
- Est. tax savings @ 24.0%
- +$3,142
- After-tax cash flow
- $-4,353/yr
For passive investors: Depreciation is non-cash, so a rental often shows a tax loss while cash-flowing — sheltering income. Rental losses are passive: they offset passive income freely, and up to $25,000/yr can offset ordinary (W-2) income if you actively participate and your MAGI is under $100k (phasing out to $0 by $150k); unused losses carry forward. On sale, claimed depreciation is recaptured at up to 25%, and gains may owe capital-gains tax (a 1031 exchange can defer both). Figures are a year-1 estimate at your 24.0% rate — not tax advice; consult a CPA.
Schools (NCES district)
- District
- Madison County
- NCES district ID
- 0102220
- Math proficiency
- 27% ▼ -32.00%
- Reading proficiency
- 56% ▼ -1.00%
- Median HH income
- $66,058
- Composite
- 37.15/100
- National rank
- #4483
- State rank
- #19 of 129 in AL
Livability — Huntsville
- Score
- 82/100
- State rank
- #3
- US rank
- #1082
Category grades
Schools grade is shown separately in the Schools card above.
Census & demographics
- County
- Madison County · 380,832 people
- City population
- 220,435
- Metro
- Huntsville, AL
- Population (ZIP)
- 31,008
- Household income
- $90,812
- Rent vs Own
- Severe rent burden
- 517.0
Population outlook (Madison County) Hauer SSP2
- Today (2025)
- 392,086 people
- By 2030
- 409,788 · +4.5%
- By 2040
- 440,557 · +12.4%
- By 2050
- 460,990 · +17.6%
- By 2075
- 502,872 · +28.3%
- By 2100
- 513,623 · +31.0%
Race, ethnicity, and origin ACS 2023
- Neighborhood character
- Majority White (64%)
- Race & ethnicity
- White 64% Black 27% Two or more races 5% Hispanic / Latino 3% Asian 2%
- Common ancestry
- Slovak 2% Italian 2% Serbian 2%
- Foreign-born
- 4% · Canada, Vietnam, China
- Languages at home
- 95% English-only · Spanish 3% Vietnamese 1%
Political lean MEDSL · Madison
- 2024 margin
- Lean R (+9.0) · D 44.7% · R 53.7% · Other 1.6%
- 2008→2024 swing
- +6.0pp toward D · 2008: -14.9pp · 2024: -9.0pp
- All cycles
- 2024: R+9.0 2020: R+8.0 2016: R+16.8 2012: R+18.7 2008: R+14.9
Not yet ingested
- Civics
- —
Market trends
- HPI YoY
- ▼ -7.13%
- Current HPI
- 332.9423
- Rent YoY
- ▲ 6.81%
- Metro
- Huntsville, AL
- State GDP YoY
- ▲ 2.94%
- F500 in state
- 4
Industry mix (Fortune 500 HQ in AL)
| Industry | F500 HQs | Revenue |
|---|---|---|
| Financial Services | 1 | $8B |
|
||
| Healthcare | 1 | $5B |
|
||
Cash-flow waterfall
monthlySold comps — $/sqft
last 12 mo · ≤1 miLoading sold comps…