 🏗️ New Construction
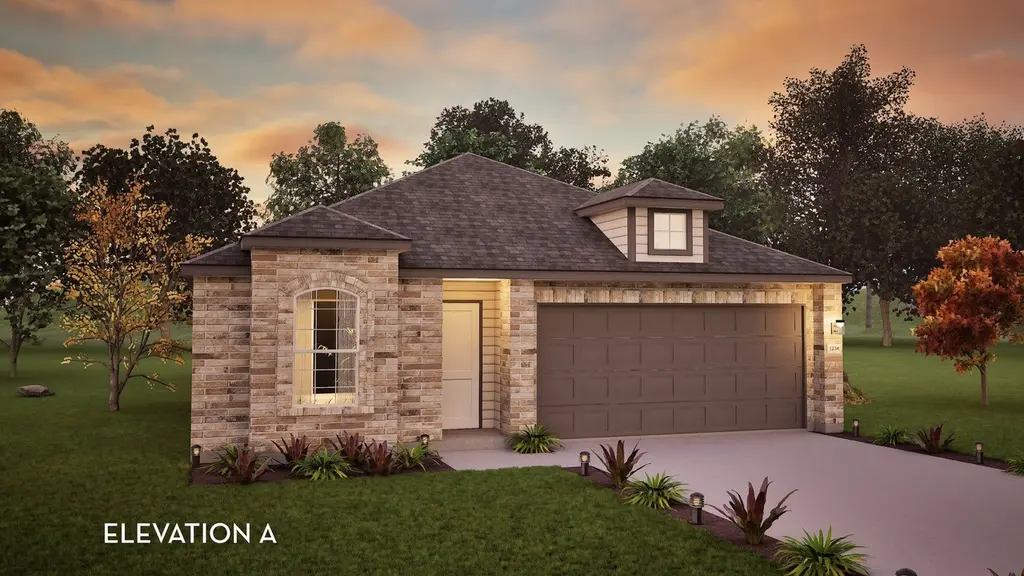
Aquila Plan · Todd Mission, TX
Flood risk 1/10 · Minimal
- FEMA flood zone
- X (unshaded)
- Chance of flooding over 30 yrs
- 0.0%
- Est. flood insurance / yr
- $507 – $1,088
Fire risk 4/10 · Minor
- Est. fire insurance / yr
- $1,222 – $2,270
Heat risk 8/10 · Major
- Hot days now (above 111°F)
- 7 days/yr
- Hot days in 30 yrs
- 22 days/yr
Wind risk 8/10 · Major
- Chance of severe wind over 30 yrs
- 98.0%
Air-quality risk 2/10 · Minimal
- Unhealthy air days now
- 1 days/yr
- Unhealthy air days in 30 yrs
- 1 days/yr
Risk factors via First Street. Map © Google.
Why this score? — see what drove the D- grade
The composite is a weighted blend of 9 inputs, each scored 0–100. Each bar is that input's sub-score; the figure is the points it added to the 100-point composite (weight × sub-score).
- Cash flow +8.3/30.0
- ARV discount +7.5/15.0
- Condition / age +4.8/5.0
- Schools +3.9/10.0
- Livability +3.4/5.0
- 1% rule +2.6/10.0
- Rent growth +2.6/5.0
- DSCR +2.2/10.0
- Appreciation +0.0/10.0
$242,990
🖨 Deal sheet 📄 Offer letter ✓ Due diligence
Listing remarks MLS
With convenience at the forefront, our Aquila floor plan will meet the lifestyle needs of most any family. Boasting 3 bedrooms and two full bathrooms, this single-story home is the perfect size for growing families or empty-nesters alike. As soon as you open the door, you are greeted by an elegant entryway that leads to the secondary and third bedrooms with the secondary bathroom in between. Down the hall, you'll pass the two-car garage. If you find yourself needing more storage space in the garage, opt for the larger garage and turn it into a 2.5-car or 3-car garage! Across from the other bedrooms resides the remote Master Bedroom. The attached Master Bathroom consists of a large vanity with cultured marble countertops and a huge walk-in closet. Looking to add an extra spark to the master bathroom? Choose to revamp your bathroom with a master luxury bath with a bathtub and separate shower, or a master super shower instead of a bathtub! The opportunities are endless. Tying the space together is the large family room with nine-foot ceilings, and the welcoming dining area the kitchen. The gorgeous kitchen includes sleek granite countertops, flat-panel countertops, and a wide kitchen island that is perfect for added counter space. You'll love entertaining your guests with the open-concept feel of the kitchen, dining room, and family room! Also, the sizable walk-in pantry will help store all of your essentials and more. Off the dining room, you will find the optional covered. ..
Key facts
- Huge walk-in closet
- Large family room
- Elegant entryway
Tags
Neighborhood map
What this means for you Summary
Snapshot
- This is a 3-bed/2.0-bath single-family listed at $243k. Condition is rated excellent.
Deal economics
- At list price, monthly cash flow is $-243 ($-3k/yr) — negative.
- To cash-flow at today's rent, offer at most $229k (5.6% below list).
- To meet the 1% rule (rent ≥ 1% of price), the offer needs to be $201k (17.4% below list).
- Recommended offer: $201k (17.4% below list) — sets the bar for 1% rule.
- Cap rate 5.2% vs local median 2.9% in Todd Mission — top-decile yield for the area; either an underpriced asset or a hidden risk that comps aren't pricing in. Stress-test before assuming the spread holds.
Location & tenants
- Location reads 67/100 on livability (#549 in TX) — a middle-class / working-renter tenant base. Strengths: employment A+, cost of living A+, housing A+; Watch: schools F, amenities F, commute F.
- Magnolia ISD (rural): math 42% / reading 45% proficiency, ranked #247 of 826 in TX (top 30%) — families likely to look elsewhere, expect single-tenant / working-renter base with shorter leases.
- Market conditions: Rents flat; 2283 active listings in the ZIP; 1 comparable units currently listed for rent nearby; high-income renter base; 13,259 units permitted in Montgomery County in 2024 (1,402 in 5+ unit buildings).
Forward outlook
- Local home prices are declining (-3.0%/yr); year-one equity from $2k of loan paydown is wiped out by about $8k of value loss. Plan a longer hold.
- Montgomery County population projected at +65% by 2050 — long-run rental-demand tailwind backs the buy-and-hold thesis.
Negotiation context
- It's been on market 443 days — a 12% lower offer ($214k) is reasonable based on typical stale-listing flexibility.
Risks & watch-outs
- Climate carrying-cost: severe wind risk, 98% chance of damaging wind over 30y; extreme-heat days projected 7→22/yr by 2055 (HVAC capex compounding) — expect insurance premiums to compound above CPI over the hold.
Questions for the listing agent
- What do current leases actually rent for vs. the listed asking? Can we see a recent rent roll and the last 12 months of T-12 income?
- It's been on market 443 days. Have you received any prior offers? Is the seller open to a 17% concession, seller financing, or rate buy-down credit?
- Why hasn't it sold? Are there any deal-killer items the seller is aware of (foundation, flood, title, zoning, code violations)?
- Is there a deadline driving the sale (1031 exchange, divorce, estate, relocation)? That informs how much negotiation room exists.
- Schools are F-rated, which usually means shorter tenancies and higher turnover. Who's the typical renter profile here, and what's been the actual vacancy rate?
- The area grade is low — what's the realistic commute time and amenity access for the typical tenant pool here? Any planned neighborhood developments (good or bad) we should know about?
- What's the average days-on-market for RENTAL listings here right now (not sales)? A rising rental-DOM trend means longer vacancies and softer asking-rent achievability than the comps imply.
- What's the recent tenant-quality profile in this submarket — average credit score on applications, eviction rate, late-payment / NSF rate, and stable-employment percentage? A property-management company in the area should have these aggregated.
- How much new for-sale + rental construction is in the pipeline within 1–3 miles? Heavy new supply typically softens prices + rents 12–24 months out; constrained supply supports both.
Investment metrics
- 1% rule
- 0.76% ✗
- Cap rate
- 5.19%
- Cash-on-cash
- -3.93%
- DSCR
- 0.82
- GRM
- 11.0
CMA / ARV
- ARV (median comp)
- $264,497
- List price
- $242,990
- Delta
- -8.13%
- Verdict
- FAIR
- Comps
- 20 within 1.0 mi
Show comp detail 12 sales within ~0.75 mi
| Address | Dist | Beds/Ba | Sqft | Sold | Price | $/sf | Match |
|---|---|---|---|---|---|---|---|
| 5822 Agave Ln | 0.10mi | 3/2.0 | 1,772 (0%) | 2mo | $269,873 | $152 | 94 |
| 25440 Blossom Ct | 0.10mi | 3/2.0 | 1,869 (+6%) | 3mo | $254,900 | $136 | 84 |
| 25427 Blossom Ct | 0.12mi | 3/2.0 | 1,675 (-6%) | 3mo | $239,900 | $143 | 83 |
| 25494 Blossom Ct | 0.21mi | 3/2.5 | 1,880 (+6%) | 0mo | $276,403 | $147 | 78 |
| 25456 Blossom Ct | 0.12mi | 4/2.0 (+1) | 1,932 (+9%) | 0mo | $264,900 | $137 | 74 |
| 25605 Microstar Way | 0.45mi | 3/2.0 | 1,694 (-4%) | 1mo | $239,000 | $141 | 71 |
| 25280 Leather Leaf Ct | 0.32mi | 4/2.5 (+1) | 1,881 (+6%) | 2mo | $261,990 | $139 | 66 |
| 25564 Blossom Ct | 0.35mi | 4/2.5 (+1) | 1,881 (+6%) | 1mo | $263,990 | $140 | 66 |
| 25272 Leather Leaf Ct | 0.31mi | 4/2.0 (+1) | 1,607 (-9%) | 1mo | $254,990 | $159 | 64 |
| 25561 Blossom Ct | 0.35mi | 4/2.0 (+1) | 1,607 (-9%) | 1mo | $254,990 | $159 | 63 |
| 25295 Leather Leaf Ct | 0.37mi | 4/2.0 (+1) | 1,607 (-9%) | 3mo | $254,990 | $159 | 60 |
| 25446 Carnation Ct | 0.36mi | 4/2.5 (+1) | 1,979 (+12%) | 1mo | $270,990 | $137 | 56 |
Match score weights: distance 35% · size 25% · config 20% · recency 20%. Top-matched comps best support the ARV.
Projected returns pro-forma
-3.0% appreciation · 0.4% rent growth · sell at horizon
- IRR
- -25.8%
- Equity multiple
- 0.14×
- Total profit
- $-63,407
- Equity at exit
- $39,437
- IRR
- -33.6%
- Equity multiple
- -0.28×
- Total profit
- $-94,929
- Equity at exit
- $22,869
Cash invested: $74,059 (down + closing). Projections, not guarantees.
Landlord ↔ Tenant lean methodology
- Overall (STATE)
- 87 Strongly Landlord-Friendly
- State Texas
- 87 Strongly Landlord-Friendly · R+5
- County
- — inherits STATE
- City
- — inherits STATE
ZIP-level market 77316
- Home prices YoY
- -10.7%
- Rents YoY
- 0.4%
- Active inventory
- 2283
- Price-to-rent
- 10.1×
Monthly cashflow live
- Estimated rent
- $2,006 medium interval (Pro) →
- Mortgage (P&I)
- −$1,387
- Tax est. 1.5%
- −$331 /mo · $3,967/yr
- Insurance
- −$110
- HOA
- −$0
- Vacancy / Maint / Mgmt
- −$421
- Net cashflow
- $-243
Break-even live
UW: 25.0% down · 7.5% · 30yr · 1.5% tax · 5.0% vac · 8.0% maint · 8.0% mgmt
Financing live
Cash to close
- Down payment
- $66,124
- Closing costs
- $7,935
- Reserves months
- —
- Total cash needed
- —
Loan-product check · same deal, 3 products live
Conventional
25% down · 7.5% · 30yr
- Down + closing
- —
- Monthly P&I
- —
- Monthly cashflow
- —
- DSCR
- —
- Eligible?
- —
Personal DTI + credit; lowest rate.
DSCR
20% down · 8.5% · 30yr
- Down + closing
- —
- Monthly P&I
- —
- Monthly cashflow
- —
- DSCR
- —
- Eligible?
- —
No personal income docs; deal must DSCR.
Hard money
10% down · 12.0% · 12mo
- Down + closing
- —
- Monthly P&I
- —
- Monthly cashflow
- —
- DSCR
- —
- Eligible?
- —
Short-term bridge; refi at stabilization.
Rent comps 1 comps
| Address | Beds | Baths | Sqft | Rent | $/sqft | DOM | Units | Dist |
|---|---|---|---|---|---|---|---|---|
| 25553 Blossom Ct Montgomery, TX | 3.0 | 2.0 | 1249 | $1,690 | $1.35 | 2d | 1 | 0.35mi |
Listing history 14 events
-
2026-06-18days on market $242,990 Active 443 DOM
-
2026-06-17days on market $242,990 Active 442 DOM
-
2026-06-16days on market $242,990 Active 441 DOM
-
2026-06-15days on market $242,990 Active 440 DOM
-
2026-06-13days on market $242,990 Active 438 DOM
-
2026-06-09days on market $242,990 Active 434 DOM
-
2026-06-08days on market $242,990 Active 433 DOM
-
2026-06-07days on market $242,990 Active 432 DOM
-
2026-06-04days on market $242,990 Active 429 DOM
-
2026-06-03days on market $242,990 Active 428 DOM
-
2026-06-02days on market $242,990 Active 427 DOM
-
2026-06-01days on market $242,990 Active 426 DOM
-
2026-05-31days on market $242,990 Active 425 DOM
-
2025-04-01$242,990 Active 1499-char remark
Show marketing remark (1499 chars)
With convenience at the forefront, our Aquila floor plan will meet the lifestyle needs of most any family. Boasting 3 bedrooms and two full bathrooms, this single-story home is the perfect size for growing families or empty-nesters alike. As soon as you open the door, you are greeted by an elegant entryway that leads to the secondary and third bedrooms with the secondary bathroom in between. Down the hall, you'll pass the two-car garage. If you find yourself needing more storage space in the garage, opt for the larger garage and turn it into a 2.5-car or 3-car garage! Across from the other bedrooms resides the remote Master Bedroom. The attached Master Bathroom consists of a large vanity with cultured marble countertops and a huge walk-in closet. Looking to add an extra spark to the master bathroom? Choose to revamp your bathroom with a master luxury bath with a bathtub and separate shower, or a master super shower instead of a bathtub! The opportunities are endless. Tying the space together is the large family room with nine-foot ceilings, and the welcoming dining area the kitchen. The gorgeous kitchen includes sleek granite countertops, flat-panel countertops, and a wide kitchen island that is perfect for added counter space. You'll love entertaining your guests with the open-concept feel of the kitchen, dining room, and family room! Also, the sizable walk-in pantry will help store all of your essentials and more. Off the dining room, you will find the optional covered. ..
ⓘ Source: listings_history table (triggers on properties + properties_extension) + one-shot
backfill from property_details.listing_events for pre-trigger history.
Climate risk First Street
- Flood 1/10 Low FEMA zone X (unshaded) · 0% chance over 30 yrs
- Wildfire 4/10 Moderate
- Heat 8/10 Severe 7 d/yr ≥111°F today · 22 d/yr by 30 yrs out
- Wind 8/10 Severe 98% chance of damaging wind over 30 yrs
- Air quality 2/10 Low 1 unhealthy d/yr today · 1 by 30 yrs out
Nearby sold comps map
Loading sold comps map…
Walkable amenities ~0.75 mi
Loading nearby amenities…
Taxation est. · year 1
- Rental income
- $24,078
- − Mortgage interest
- −$14,816
- − Property taxes
- −$3,967
- − Insurance
- −$1,322
- − Repairs & maintenance
- −$1,926
- − Management
- −$1,926
- − Depreciation
- −$7,694
- Taxable loss
- −$7,575
- Est. tax savings @ 24.0%
- +$1,818
- After-tax cash flow
- $-1,095/yr
For passive investors: Depreciation is non-cash, so a rental often shows a tax loss while cash-flowing — sheltering income. Rental losses are passive: they offset passive income freely, and up to $25,000/yr can offset ordinary (W-2) income if you actively participate and your MAGI is under $100k (phasing out to $0 by $150k); unused losses carry forward. On sale, claimed depreciation is recaptured at up to 25%, and gains may owe capital-gains tax (a 1031 exchange can defer both). Figures are a year-1 estimate at your 24.0% rate — not tax advice; consult a CPA.
Condition & rehab AI · 12 photos
This Aquila floor plan is in excellent condition with no visible repairs needed. It offers a good balance of modern amenities and curb appeal, making it an attractive option for both resale and rental markets.
Value-add opportunities
- Both Painting the exterior and interior walls — Fresh paint enhances curb appeal and interior aesthetics.
- Both Landscaping improvements — Enhanced landscaping can increase both resale and rental value.
- Both Adding a smart home system — Modern technology can increase both resale and rental appeal.
- Both Upgrading the kitchen appliances — Modern appliances can increase both resale and rental value.
- Both Upgrading the bathroom fixtures — Modern fixtures can increase both resale and rental value.
Renovation cost estimate screening
Value-add ROI direction
- Both Painting the exterior and interior walls — Fresh paint enhances curb appeal and interior aesthetics. ↑
- Both Landscaping improvements — Enhanced landscaping can increase both resale and rental value. ↑
- Both Adding a smart home system — Modern technology can increase both resale and rental appeal. ↑
- Both Upgrading the kitchen appliances — Modern appliances can increase both resale and rental value. ↑
- Both Upgrading the bathroom fixtures — Modern fixtures can increase both resale and rental value. ↑
ⓘ Cost ranges are severity-bucket heuristics (US national rule-of-thumb). Get contractor quotes + a written scope before underwriting a rehab budget.
Schools (NCES district)
- District
- Magnolia ISD
- NCES district ID
- 4828740
- Math proficiency
- 42% ▼ -7.00%
- Reading proficiency
- 45% ▼ -4.00%
- Median HH income
- $71,692
- Composite
- 39.46/100
- National rank
- #3958
- State rank
- #247 of 826 in TX
Livability — Todd Mission
- Score
- 67/100
- State rank
- #549
- US rank
- #10627
Category grades
Schools grade is shown separately in the Schools card above.
Census & demographics
- County
- Montgomery County · 663,713 people
- Metro
- Houston-The Woodlands-Sugar Land, TX
- Population (ZIP)
- 34,694
- Household income
- $124,055
- Rent vs Own
- Severe rent burden
- 273.0
Population outlook (Montgomery County) Hauer SSP2
- Today (2025)
- 713,896 people
- By 2030
- 805,263 · +12.8%
- By 2040
- 992,708 · +39.1%
- By 2050
- 1,179,590 · +65.2%
- By 2075
- 1,628,084 · +128.1%
- By 2100
- 1,937,880 · +171.5%
Race, ethnicity, and origin ACS 2023
- Neighborhood character
- Predominantly White (80%)
- Race & ethnicity
- White 80% Hispanic / Latino 14% Two or more races 11% Black 1% Asian 1%
- Hispanic origin (detail)
- Mexican 9%
- Common ancestry
- Lithuanian 6% Slovak 3% Romanian 3%
- Foreign-born
- 6% · Canada
- Languages at home
- 90% English-only · Spanish 8%
Political lean MEDSL · Montgomery
- 2024 margin
- Solid R (+45.5) · D 26.8% · R 72.3%
- 2008→2024 swing
- +7.2pp toward D · 2008: -52.7pp · 2024: -45.5pp
- All cycles
- 2024: R+45.5 2020: R+43.8 2016: R+51.4 2012: R+60.7 2008: R+52.7
Not yet ingested
- Civics
- —
Market trends
- HPI YoY
- ▼ -31.44%
- Current HPI
- 262.6973
- Rent YoY
- ▲ 0.40%
- Metro
- Houston-The Woodlands-Sugar Land, TX
- State GDP YoY
- ▲ 3.95%
- F500 in state
- 110
Industry mix (Fortune 500 HQ in TX)
| Industry | F500 HQs | Revenue |
|---|---|---|
| Energy | 16 | $1,198B |
|
||
| Technology | 5 | $198B |
|
||
| Engineering / Construction | 4 | $72B |
|
||
| Energy Services | 3 | $60B |
|
||
| Utilities | 3 | $41B |
|
||
| Healthcare | 2 | $330B |
|
||
Price history
1 event — show timeline
- 2025-04-01 Listed $242,990 Zillow
Cash-flow waterfall
monthlySold comps — $/sqft
last 12 mo · ≤1 miLoading sold comps…