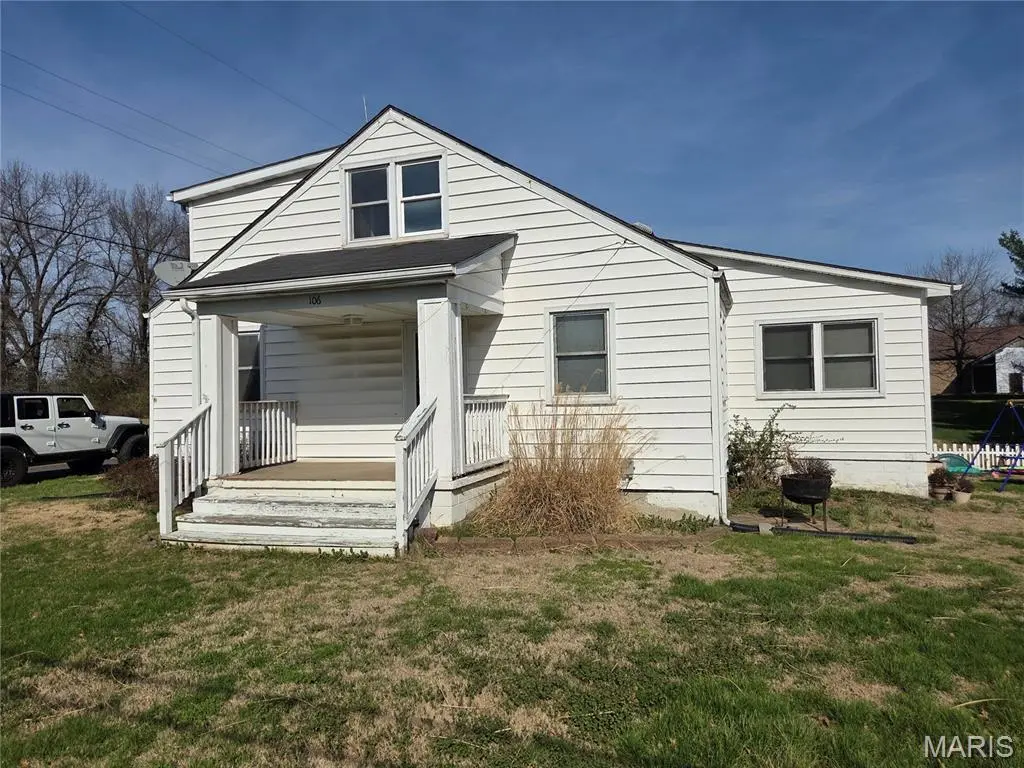
106 Guinzy Hl · Collinsville, IL
Flood risk 1/10 · Minimal
- FEMA flood zone
- X
- Chance of flooding over 30 yrs
- 0.0%
- Est. flood insurance / yr
- $507 – $1,088
Fire risk 1/10 · Minimal
- Est. fire insurance / yr
- $804 – $1,492
Heat risk 5/10 · Moderate
- Hot days now (above 106°F)
- 7 days/yr
- Hot days in 30 yrs
- 21 days/yr
Wind risk 2/10 · Minimal
- Chance of severe wind over 30 yrs
- 1.0%
Air-quality risk 3/10 · Minor
- Unhealthy air days now
- 3 days/yr
- Unhealthy air days in 30 yrs
- 4 days/yr
Risk factors via First Street. Map © Google.
Why this score? — see what drove the B- grade
The composite is a weighted blend of 9 inputs, each scored 0–100. Each bar is that input's sub-score; the figure is the points it added to the 100-point composite (weight × sub-score).
- Cash flow +30.0/30.0
- 1% rule +10.0/10.0
- DSCR +10.0/10.0
- ARV discount +7.5/15.0
- Livability +3.4/5.0
- Rent growth +3.3/5.0
- Condition / age +2.5/5.0
- Schools +1.6/10.0
- Appreciation +0.0/10.0
$50,000
🖨 Deal sheet 📄 Offer letter ✓ Due diligence
Listing remarks
Attention Investors!! Two-bedroom, one-bath home presents an excellent opportunity for the right buyer. This house will need a new septic system installed. Situated on a corner lot. Buyer to verify all Listing data including but not limited to sq. ft. , measurements, features, lot size, taxes/exemptions, schools and etc.
Key facts
- 9,583 sq ft lot
- 2 garage spots
- Built 1940
Property features AI
Exterior
- Parking: 2-car garage
- Utilities: Public water; Septic needed; Electric service by Ameren; Electricity connected; Sewer connected
- Home design: Single-family residential home; Two levels
- Construction: Vinyl siding
- Exterior features: Interior lot
Interior
- Bedrooms: 2 bedrooms total (1 on the main level, 1 on the upper level)
- Bathrooms: 1 full bathroom
- Heating & cooling: Oil heating; Central air conditioning
- Interior features: Unfinished basement
Neighborhood map
What this means for you Summary
Snapshot
- This is a 2-bed/1.0-bath single-family listed at $50k.
Deal economics
- At list price, monthly cash flow is $532 ($6k/yr) — positive.
- The deal already cash-flows at list — no discount required.
- Meets the 1% rule at list price ($1k rent vs $50k).
- Recommended offer: $49k (1.5% below list) — sets the bar for market timing.
- Cap rate 19.1% vs local median 4.0% in Collinsville — top-decile yield for the area; either an underpriced asset or a hidden risk that comps aren't pricing in. Stress-test before assuming the spread holds.
Location & tenants
- Location reads 67/100 on livability (#491 in IL) — a middle-class / working-renter tenant base. Strengths: cost of living A+, housing A+, crime B; Watch: amenities F, commute F, health & safety F.
- Collinsville CUSD 10 (suburban): math 14% / reading 20% proficiency, ranked #465 of 620 in IL (top 75%) — low school quality limits family demand, transient renter base, plan for 1-2y turnover.
- Zoned schools: Collinsville High School (math 16% / reading 21%, grade F, #427 of 693 statewide, top 62%, 1,978 students, 0% FRL) — zoned schools average 0% FRL vs 52% district-wide (52 pts lower); this property's tenant base skews higher-income than the district average.
- Market conditions: Rents rising (+3.1%/yr); 83 active listings in the ZIP; 21 comparable units currently listed for rent nearby; rentals leasing fast (median 8d on market — plan ~1-2 weeks tenant-placement turnaround); 336 units permitted in Madison County in 2024 (0 in 5+ unit buildings).
Forward outlook
- Local home prices are declining (-3.0%/yr); year-one equity from $346 of loan paydown is wiped out by about $2k of value loss. Plan a longer hold.
- Madison County population projected at -18% by 2050 — secular population decline; favor cash flow + early exit over multi-decade hold.
- At projected returns (-3.0% appreciation + 3.1% rent growth), your $14k cash investment doubles in ~3 years — after that, you're playing with house money.
Negotiation context
- It's been on market 20 days — a 2% lower offer ($49k) is reasonable based on typical stale-listing flexibility.
- 2 sale attempts; this cycle's ask has dropped $45k (47%) from the opening price — seller is motivated, your offer sets the floor, not the list.
Risks & watch-outs
- Watch-outs: property tax is 3.7% of price; built in 1940 — expect roof / HVAC / electrical / plumbing capex.
- Climate carrying-cost: extreme-heat days projected 7→21/yr by 2055 (HVAC capex compounding) — expect insurance premiums to compound above CPI over the hold.
Questions for the listing agent
- Built in 1940 — when were the roof, HVAC, electrical panel, plumbing, and water heater last replaced?
- Property tax is high relative to price — has the assessment been appealed recently, and will the sale trigger a re-assessment?
- Is there a deadline driving the sale (1031 exchange, divorce, estate, relocation)? That informs how much negotiation room exists.
- Schools are D-rated, which usually means shorter tenancies and higher turnover. Who's the typical renter profile here, and what's been the actual vacancy rate?
- What's the average days-on-market for RENTAL listings here right now (not sales)? A rising rental-DOM trend means longer vacancies and softer asking-rent achievability than the comps imply.
- What's the recent tenant-quality profile in this submarket — average credit score on applications, eviction rate, late-payment / NSF rate, and stable-employment percentage? A property-management company in the area should have these aggregated.
- How much new for-sale + rental construction is in the pipeline within 1–3 miles? Heavy new supply typically softens prices + rents 12–24 months out; constrained supply supports both.
Investment metrics
- 1% rule
- 2.45% ✓
- Cap rate
- 19.05%
- Cash-on-cash
- 45.58%
- DSCR
- 3.03
- GRM
- 3.4
CMA / ARV
- ARV (on-the-fly)
- $132,080
- Comps found
- 12
Show comp detail 12 sales within ~0.75 mi
| Address | Dist | Beds/Ba | Sqft | Sold | Price | $/sf | Match |
|---|---|---|---|---|---|---|---|
| 106 Guinzy Hl | 0.00mi | 2/1.0 | 1,016 (0%) | 1mo | $50,000 | $49 | 99 |
| 315 Meister St | 0.41mi | 2/1.0 | 975 (-4%) | 7mo | $139,000 | $143 | 68 |
| 216 S Chestnut St | 0.54mi | 3/1.0 (+1) | 996 (-2%) | 6mo | $110,000 | $110 | 61 |
| 1025 Vine St | 0.43mi | 3/1.0 (+1) | 1,095 (+8%) | 1mo | $174,000 | $159 | 61 |
| 219 Mill St | 0.40mi | 2/1.0 | 933 (-8%) | 10mo | $162,000 | $174 | 59 |
| 308 Leila St | 0.30mi | 3/1.0 (+1) | 1,092 (+8%) | 15mo | $142,500 | $130 | 56 |
| 109 Village Dr | 0.69mi | 3/1.0 (+1) | 960 (-6%) | 2mo | $150,000 | $156 | 52 |
| 329 N Aurora St | 0.67mi | 2/1.0 | 1,086 (+7%) | 10mo | $144,900 | $133 | 49 |
| 508 S Morrison Ave | 0.65mi | 2/1.0 | 974 (-4%) | 17mo | $89,900 | $92 | 49 |
| 504 S South Morrison Ave. Ave | 0.64mi | 3/2.0 (+1) | 1,100 (+8%) | 5mo | $100,000 | $91 | 43 |
| 672 Burroughs Ave | 0.58mi | 1/1.0 (-1) | 1,109 (+9%) | 15mo | $140,000 | $126 | 40 |
| 122 N Orient St | 0.51mi | 1/1.0 (-1) | 888 (-13%) | 17mo | $85,000 | $96 | 36 |
Match score weights: distance 35% · size 25% · config 20% · recency 20%. Top-matched comps best support the ARV.
Projected returns pro-forma
-3.0% appreciation · 3.1% rent growth · sell at horizon
- IRR
- 42.9%
- Equity multiple
- 2.85×
- Total profit
- $25,961
- Equity at exit
- $7,455
- IRR
- 49.1%
- Equity multiple
- 5.79×
- Total profit
- $67,021
- Equity at exit
- $4,323
Cash invested: $14,000 (down + closing). Projections, not guarantees.
Landlord ↔ Tenant lean methodology
- Overall (STATE)
- 43 Moderately Tenant-Leaning
- State Illinois
- 43 Moderately Tenant-Leaning · D+7
- County
- — inherits STATE
- City
- — inherits STATE
ZIP-level market 62234
- Home prices YoY
- -17.1%
- Rents YoY
- 3.1%
- Active inventory
- 83
- Price-to-rent
- 3.4×
Monthly cashflow live
- Estimated rent
- $1,224 high interval (Pro) →
- Mortgage (P&I)
- −$262
- Tax from tax record
- −$152 /mo · $1,828/yr
- Insurance
- −$21
- HOA
- −$0
- Vacancy / Maint / Mgmt
- −$257
- Net cashflow
- $532
Break-even live
UW: 25.0% down · 7.5% · 30yr · 1.5% tax · 5.0% vac · 8.0% maint · 8.0% mgmt
Financing live
Cash to close
- Down payment
- $12,500
- Closing costs
- $1,500
- Reserves months
- —
- Total cash needed
- —
Loan-product check · same deal, 3 products live
Conventional
25% down · 7.5% · 30yr
- Down + closing
- —
- Monthly P&I
- —
- Monthly cashflow
- —
- DSCR
- —
- Eligible?
- —
Personal DTI + credit; lowest rate.
DSCR
20% down · 8.5% · 30yr
- Down + closing
- —
- Monthly P&I
- —
- Monthly cashflow
- —
- DSCR
- —
- Eligible?
- —
No personal income docs; deal must DSCR.
Hard money
10% down · 12.0% · 12mo
- Down + closing
- —
- Monthly P&I
- —
- Monthly cashflow
- —
- DSCR
- —
- Eligible?
- —
Short-term bridge; refi at stabilization.
Rent comps 21 comps
| Address | Beds | Baths | Sqft | Rent | $/sqft | DOM | Units | Dist |
|---|---|---|---|---|---|---|---|---|
| 88 Bethel Rd Collinsville, IL | 2.0 | 1.5 | 1000 | $1,300 | $1.30 | 43d | 1 | 0.28mi |
| 921 Vine St Collinsville, IL | 3.0 | 2.0 | 1274 | $1,875 | $1.47 | 1d | 1 | 0.41mi |
| 212 S Chestnut St Unit 2 Collinsville, IL | 1.0 | 1.0 | 720 | $1,100 | $1.53 | 10d | 1 | 0.52mi |
| 212 S Chestnut St Unit 4 Collinsville, IL | 1.0 | 1.0 | 760 | $1,100 | $1.45 | 43d | 1 | 0.52mi |
| 300 Bethel Rd Collinsville, IL | 3.0 | 1.0 | 1250 | $1,350 | $1.08 | 43d | 1 | 0.55mi |
| 108 S Clinton St Unit 5 Collinsville, IL | 1.0 | 1.0 | 700 | $700 | $1.00 | 12d | 1 | 0.76mi |
| 102 W Madison Ave Collinsville, IL | 3.0 | 1.0 | 1100 | $1,650 | $1.50 | 14d | 1 | 0.85mi |
| 307 N Clinton St Collinsville, IL | 3.0 | 2.0 | 1395 | $1,700 | $1.22 | 1d | 1 | 0.88mi |
| 1003 S Morrison Ave Unit 37 Collinsville, IL | 2.0 | 1.0 | 800 | $1,100 | $1.38 | 43d | 1 | 1.04mi |
| 1003 S Morrison Ave Unit IB-37 Collinsville, IL | 1.0 | 1.0 | 700 | $1,000 | $1.43 | 2d | 1 | 1.04mi |
| 1003 S Morrison Ave Unit IB-23 Collinsville, IL | 1.0 | 1.0 | 700 | $1,000 | $1.43 | 10d | 1 | 1.04mi |
| 1003 S Morrison Ave Unit IB-169 Collinsville, IL | 2.0 | 1.0 | 900 | $1,100 | $1.22 | 2d | 1 | 1.04mi |
| 108 S Hesperia St Collinsville, IL | 2.0 | 2.0 | 1450 | $1,300 | $0.90 | 7d | 1 | 1.05mi |
| 319 N Hesperia St Collinsville, IL | 2.0 | 1.0 | 1000 | $1,200 | $1.20 | 1d | 1 | 1.12mi |
| 1106 Arrowhead Dr Unit A Collinsville, IL | 2.0 | 1.5 | 950 | $975 | $1.03 | 3d | 1 | 1.15mi |
| 1104 Arrowhead Dr Collinsville, IL | 2.0 | 1.0 | 900 | $975 | $1.08 | 7d | 1 | 1.15mi |
| 1104 Arrowhead Dr Collinsville, IL | 2.0 | 1.0 | 900 | $975 | $1.08 | 1d | 1 | 1.15mi |
| 914 California Ave Collinsville, IL | 3.0 | 1.0 | 1200 | $1,300 | $1.08 | 16d | 1 | 1.18mi |
| 1108 Apache Dr Unit C Collinsville, IL | 2.0 | 1.0 | 800 | $800 | $1.00 | 1d | 1 | 1.21mi |
| 1002 Apache Dr Collinsville, IL | 2.0 | 1.0 | 864 | $875 | $1.01 | 1d | 1 | 1.22mi |
| 114 Greenfield Dr Collinsville, IL | 2.0 | 1.0 | 900 | $1,250 | $1.39 | 43d | 1 | 1.35mi |
Listing history 5 events
-
2026-04-25status Pending
-
2026-04-16price $50,000
-
2026-04-10status Active
-
2026-03-26status Pending
-
2026-03-21$95,000 Active
ⓘ Source: listings_history table (triggers on properties + properties_extension) + one-shot
backfill from property_details.listing_events for pre-trigger history.
Tax reassessment forecast IL · Partial reset (capped growth)
- Current annual tax
- $1,828 · $152/mo
- Projected year-2 tax
- $1,828 · $152/mo
- Expected delta
- $0/yr ($0/mo · 0.0%)
ⓘ Screening estimate from a state-policy table — verify with the county assessor before closing.
Climate risk First Street
- Flood 1/10 Low FEMA zone X · 0% chance over 30 yrs
- Wildfire 1/10 Low
- Heat 5/10 Major 7 d/yr ≥106°F today · 21 d/yr by 30 yrs out
- Wind 2/10 Low 100% chance of damaging wind over 30 yrs
- Air quality 3/10 Moderate 3 unhealthy d/yr today · 4 by 30 yrs out
Nearby sold comps map
Loading sold comps map…
Walkable amenities ~0.75 mi
Loading nearby amenities…
Taxation est. · year 1
- Rental income
- $14,691
- − Mortgage interest
- −$2,801
- − Property taxes
- −$1,828
- − Insurance
- −$250
- − Repairs & maintenance
- −$1,175
- − Management
- −$1,175
- − Depreciation
- −$1,455
- Taxable income
- $6,006
- Est. tax owed @ 24.0%
- −$1,442
- After-tax cash flow
- $4,939/yr
For passive investors: Depreciation is non-cash, so a rental often shows a tax loss while cash-flowing — sheltering income. Rental losses are passive: they offset passive income freely, and up to $25,000/yr can offset ordinary (W-2) income if you actively participate and your MAGI is under $100k (phasing out to $0 by $150k); unused losses carry forward. On sale, claimed depreciation is recaptured at up to 25%, and gains may owe capital-gains tax (a 1031 exchange can defer both). Figures are a year-1 estimate at your 24.0% rate — not tax advice; consult a CPA.
Schools (NCES district)
- District
- Collinsville CUSD 10
- NCES district ID
- 1710650
- Math proficiency
- 14% ▼ -9.00%
- Reading proficiency
- 20% ▼ -7.00%
- Median HH income
- $52,504
- Composite
- 15.65/100
- National rank
- #9288
- State rank
- #465 of 620 in IL
Livability — Collinsville
- Score
- 67/100
- State rank
- #491
- US rank
- #10221
Category grades
Schools grade is shown separately in the Schools card above.
Census & demographics
- Census place
- Collinsville, IL
- County
- Madison County · 189,064 people
- City population
- 31,648
- Metro
- St. Louis, MO-IL
- Population (ZIP)
- 31,648
- Household income
- $69,607
- Rent vs Own
- Severe rent burden
- 801.0
Population outlook (Madison County) Hauer SSP2
- Today (2025)
- 258,371 people
- By 2030
- 251,523 · -2.7%
- By 2040
- 233,640 · -9.6%
- By 2050
- 213,042 · -17.5%
- By 2075
- 165,255 · -36.0%
- By 2100
- 123,953 · -52.0%
Race, ethnicity, and origin ACS 2023
- Neighborhood character
- Predominantly White (73%)
- Race & ethnicity
- White 73% Black 13% Hispanic / Latino 10% Two or more races 8%
- Hispanic origin (detail)
- Mexican 7%
- Common ancestry
- Romanian 3% Lithuanian 3% Slovak 1%
- Foreign-born
- 4% · Canada
- Languages at home
- 92% English-only · Spanish 6%
Political lean MEDSL · Madison
- 2024 margin
- R (+13.3) · D 42.5% · R 55.8% · Other 1.8%
- 2008→2024 swing
- -22.5pp toward R · 2008: 9.2pp · 2024: -13.3pp
- All cycles
- 2024: R+13.3 2020: R+13.2 2016: R+15.6 2012: R+1.4 2008: D+9.2
Not yet ingested
- Civics
- —
Market trends
- HPI YoY
- ▼ -46.21%
- Current HPI
- 223.6438
- Rent YoY
- ▲ 3.10%
- Metro
- St. Louis, MO-IL
- State GDP YoY
- ▲ 1.59%
- F500 in state
- 60
Industry mix (Fortune 500 HQ in IL)
| Industry | F500 HQs | Revenue |
|---|---|---|
| Insurance | 4 | $201B |
|
||
| Consumer Goods | 4 | $87B |
|
||
| Industrial Machinery | 3 | $64B |
|
||
| Healthcare | 2 | $55B |
|
||
| Retail / Pharmacy | 1 | $148B |
|
||
| Agriculture / Food | 1 | $86B |
|
||
Price history
-47.4% since first listed5 events — show timeline
- 2026-04-25 Pending — MARIS as Distributed by MLS Grid
- 2026-04-16 Price Changed $50,000 MARIS as Distributed by MLS Grid
- 2026-04-10 Relisted — MARIS as Distributed by MLS Grid
- 2026-03-26 Pending — MARIS as Distributed by MLS Grid
- 2026-03-21 Listed $95,000 MARIS as Distributed by MLS Grid
Property tax history
+3.5%/yrLatest (2024): $1,828 · +5.0% YoY. Source: county tax records.
Cash-flow waterfall
monthlySold comps — $/sqft
last 12 mo · ≤1 miLoading sold comps…