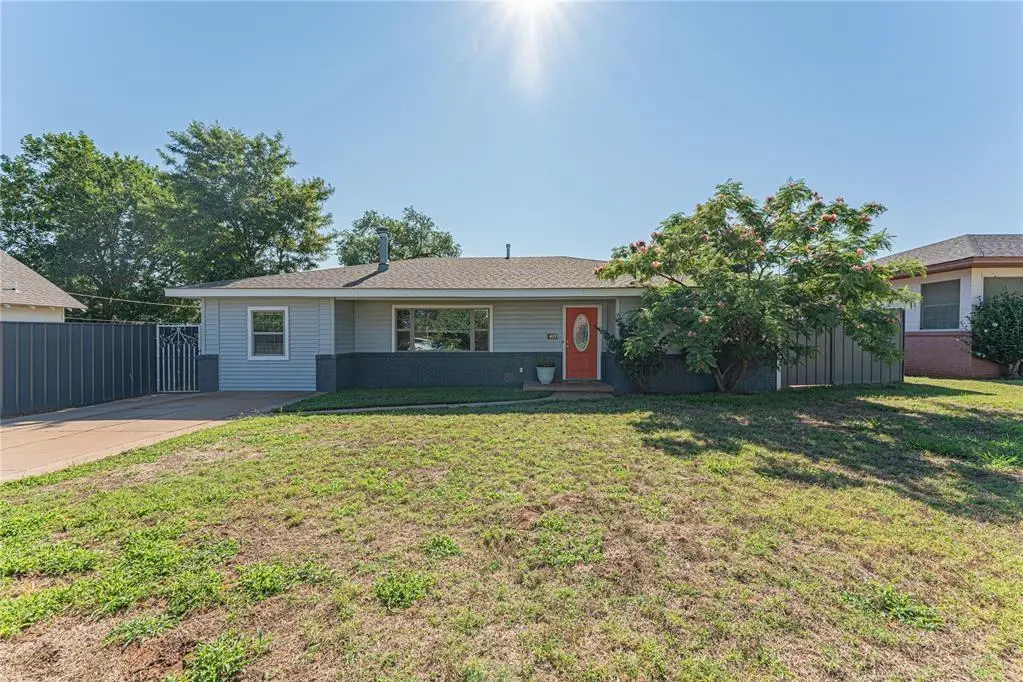
409 S 15th St · Clinton, OK
Flood risk 1/10 · Minimal
- FEMA flood zone
- X (unshaded)
- Chance of flooding over 30 yrs
- 0.0%
- Est. flood insurance / yr
- $507 – $1,088
Fire risk 6/10 · Moderate
- Est. fire insurance / yr
- $2,463 – $4,575
Heat risk 6/10 · Moderate
- Hot days now (above 107°F)
- 7 days/yr
- Hot days in 30 yrs
- 20 days/yr
Wind risk 2/10 · Minimal
- Chance of severe wind over 30 yrs
- 2.0%
Air-quality risk 1/10 · Minimal
- Unhealthy air days now
- 0 days/yr
- Unhealthy air days in 30 yrs
- 0 days/yr
Risk factors via First Street. Map © Google.
Why this score? — see what drove the F grade
The composite is a weighted blend of 9 inputs, each scored 0–100. Each bar is that input's sub-score; the figure is the points it added to the 100-point composite (weight × sub-score).
- Cash flow +10.6/30.0
- Appreciation +3.8/10.0
- Livability +3.2/5.0
- DSCR +3.1/10.0
- 1% rule +2.6/10.0
- Rent growth +2.5/5.0
- Condition / age +2.5/5.0
- Schools +1.9/10.0
- ARV discount +0.0/15.0
$139,900
🖨 Deal sheet (PDF) 📄 Offer letter ✓ Due diligence
Listing remarks
Darling three bedroom, two bathroom home in the heart of Clinton! This bright and airy home boasts fresh paint, updated appliances, granite countertops, updated wood-like flooring, large rooms with plenty of storage, a private master bath, and has been kept meticulously clean and well-maintained by the owners! The backyard boasts a back patio with a covered pergola that is perfect for entertaining, along with a metal privacy fence and a large, two car detached garage that doubles as a shop for additional workspace or hobbies. The shop is even accessible through a double swinging gate from the street behind the home! This beautiful home is centrally located near the Route 66 museum, schools,
Key facts
- Updated appliances
- Fresh paint
- Private master bath
Tags
Property features AI
Finance
- Other: Occupied; Listed as active; Living area reported as 1,314 (assessor)
- Financial info: Not assumable; Buyer may qualify for a loan
- HOA & community: No mandatory association dues
Exterior
- Parking: Concrete parking; 2-car garage
- Utilities: Homestead exemption applied
- Home design: Single family residence; One story; Faces west; Residential property
- Construction: Frame and brick veneer construction; Composition roof; Built and existing
- Exterior features: Covered patio; Outbuildings; Workshop; Metal fencing; Interior lot
Interior
- Kitchen: Built-in gas range; Built-in gas oven
- Bedrooms: 3 bedrooms
- Bathrooms: 2 full bathrooms
- Interior features: One living area; One dining area; No fireplace; Existing property (not new construction)
- Laundry & utility: Conventional foundation
Neighborhood map
What this means for you Summary
Snapshot
- This is a 2-bed/1.0-bath single-family listed at $140k.
Deal economics
- At list price, monthly cash flow is $-69 ($-822/yr) — negative.
- To cash-flow at today's rent, offer at most $128k (8.7% below list).
- To meet the 1% rule (rent ≥ 1% of price), the offer needs to be $106k (24.0% below list).
- Recommended offer: $106k (24.0% below list) — sets the bar for 1% rule.
Location & tenants
- Location reads 63/100 on livability (#196 in OK) — a middle-class / working-renter tenant base. Strengths: cost of living A+, housing A-; Watch: crime D+, amenities F, commute F.
- Clinton (town): math 21% / reading 23% proficiency, ranked #149 of 270 in OK (top 55%) — low school quality limits family demand, transient renter base, plan for 1-2y turnover; 67% free/reduced lunch — lower-income household profile, screen leases tightly.
- Zoned schools: Nance Es (430 students, 0% FRL); Clinton Ms (math 32% / reading 28%, grade F, #49 of 345 statewide, top 15%, 282 students, 0% FRL); Clinton Hs (math 8% / reading 22%, grade F, #332 of 447 statewide, top 78%, 629 students, 0% FRL) — zoned schools average 0% FRL vs 67% district-wide (67 pts lower); this property's tenant base skews higher-income than the district average.
- Market conditions: 79 active listings in the ZIP; 28 units permitted in Custer County in 2024 (5 in 5+ unit buildings).
Forward outlook
- Local home prices are declining (-2.4%/yr); year-one equity from $967 of loan paydown is wiped out by about $3k of value loss. Plan a longer hold.
- Custer County population projected at +47% by 2050 — long-run rental-demand tailwind backs the buy-and-hold thesis.
Negotiation context
- It's been on market 55 days — a 3% lower offer ($136k) is reasonable based on typical stale-listing flexibility.
- 8 sale attempts since 11y ago with the ask held roughly flat each time — persistent listings suggest the price (not the market) is what's stuck; bring a comps-based counter.
- Current owner paid $120k; 17% above their basis — modest negotiation headroom, anchor on the comps not their cost.
Risks & watch-outs
- Watch-outs: built in 1950 — expect roof / HVAC / electrical / plumbing capex.
- Climate carrying-cost: major wildfire risk; extreme-heat days projected 7→20/yr by 2055 (HVAC capex compounding) — expect insurance premiums to compound above CPI over the hold.
Questions for the listing agent
- What do current leases actually rent for vs. the listed asking? Can we see a recent rent roll and the last 12 months of T-12 income?
- It's been on market 55 days. Have you received any prior offers? Is the seller open to a 24% concession, seller financing, or rate buy-down credit?
- Built in 1950 — when were the roof, HVAC, electrical panel, plumbing, and water heater last replaced?
- Is there a deadline driving the sale (1031 exchange, divorce, estate, relocation)? That informs how much negotiation room exists.
- Schools are F-rated, which usually means shorter tenancies and higher turnover. Who's the typical renter profile here, and what's been the actual vacancy rate?
- Crime grade is D in this area — have there been break-ins, vandalism, or insurance claims at this property in the last 3 years? What carrier currently insures it and at what premium?
- The area grade is low — what's the realistic commute time and amenity access for the typical tenant pool here? Any planned neighborhood developments (good or bad) we should know about?
- What's the average days-on-market for RENTAL listings here right now (not sales)? A rising rental-DOM trend means longer vacancies and softer asking-rent achievability than the comps imply.
- What's the recent tenant-quality profile in this submarket — average credit score on applications, eviction rate, late-payment / NSF rate, and stable-employment percentage? A property-management company in the area should have these aggregated.
- How much new for-sale + rental construction is in the pipeline within 1–3 miles? Heavy new supply typically softens prices + rents 12–24 months out; constrained supply supports both.
Investment metrics
- 1% rule
- 0.76% ✗
- Cap rate
- 5.71%
- Cash-on-cash
- -2.10%
- DSCR
- 0.91
- GRM
- 11.0
CMA / ARV
- ARV (on-the-fly)
- $103,806
- Comps found
- 12
Show comp detail 12 sales within ~0.75 mi
| Address | Dist | Beds/Ba | Sqft | Sold | Price | $/sf | Match |
|---|---|---|---|---|---|---|---|
| 313 S 15th St | 0.12mi | 3/2.0 (+1) | 1,261 (-4%) | 12mo | $142,000 | $113 | 69 |
| 1105 S 13th St | 0.51mi | 3/2.0 (+1) | 1,272 (-3%) | 1mo | $100,000 | $79 | 61 |
| 1025 Court | 0.31mi | 2/1.0 | 1,128 (-14%) | 11mo | $55,500 | $49 | 53 |
| 323 N 8th St | 0.71mi | 2/2.0 | 1,246 (-5%) | 2mo | $89,000 | $71 | 53 |
| 517 S 12th St | 0.23mi | 3/1.5 (+1) | 1,472 (+12%) | 12mo | $107,000 | $73 | 53 |
| 501 S 11th St | 0.29mi | 3/2.0 (+1) | 1,433 (+9%) | 12mo | $112,000 | $78 | 52 |
| 421 S 19th St | 0.28mi | 3/1.0 (+1) | 1,119 (-15%) | 10mo | $124,900 | $112 | 49 |
| 430 S 9th St | 0.40mi | 2/2.0 | 1,164 (-11%) | 15mo | $132,000 | $113 | 46 |
| 1509 Concord Ave | 0.66mi | 3/2.0 (+1) | 1,408 (+7%) | 4mo | $168,000 | $119 | 45 |
| 717 S 7th St | 0.60mi | 3/2.0 (+1) | 1,206 (-8%) | 17mo | $79,900 | $66 | 35 |
| 231 Shale Crst | 0.73mi | 3/2.0 (+1) | 1,462 (+11%) | 12mo | $150,000 | $103 | 28 |
| 322 S 5th St | 0.68mi | 2/2.0 | 1,498 (+14%) | 20mo | $110,000 | $73 | 25 |
Match score weights: distance 35% · size 25% · config 20% · recency 20%. Top-matched comps best support the ARV.
Projected returns pro-forma
-2.36% appreciation · 3.0% rent growth · sell at horizon
- IRR
- -15.7%
- Equity multiple
- 0.41×
- Total profit
- $-23,280
- Equity at exit
- $24,875
- IRR
- -8.2%
- Equity multiple
- 0.42×
- Total profit
- $-22,669
- Equity at exit
- $19,107
Cash invested: $39,172 (down + closing). Projections, not guarantees.
Landlord ↔ Tenant lean methodology
- Overall (STATE)
- 83 Strongly Landlord-Friendly
- State Oklahoma
- 83 Strongly Landlord-Friendly · R+20
- County
- — inherits STATE
- City
- — inherits STATE
ZIP-level market 73601
- Home prices YoY
- -1.0%
- Active inventory
- 79
- Price-to-rent
- 11.0×
Monthly cashflow live
- Estimated rent
- $1,063 medium interval (Pro) →
- Mortgage (P&I)
- −$734
- Tax from tax record
- −$116 /mo · $1,396/yr
- Insurance
- −$58
- HOA
- −$0
- Vacancy / Maint / Mgmt
- −$223
- Net cashflow
- $-69
Break-even live
Sensitivity live
| Price | -10% $11 | -5% $-29 | +0% $-69 | +5% $-108 | +10% $-148 |
|---|---|---|---|---|---|
| Rent | -10% $-153 | -5% $-111 | +0% $-69 | +5% $-27 | +10% $15 |
| Rate | -1.0pp $2 | -0.5pp $-33 | base $-69 | +0.5pp $-105 | +1.0pp $-142 |
UW: 25.0% down · 7.5% · 30yr · 1.5% tax · 5.0% vac · 8.0% maint · 8.0% mgmt
Financing live
Cash to close
- Down payment
- $34,975
- Closing costs
- $4,197
- Reserves months
- —
- Total cash needed
- —
Loan-product check · same deal, 3 products live
Conventional
25% down · 7.5% · 30yr
- Down + closing
- —
- Monthly P&I
- —
- Monthly cashflow
- —
- DSCR
- —
- Eligible?
- —
Personal DTI + credit; lowest rate.
DSCR
20% down · 8.5% · 30yr
- Down + closing
- —
- Monthly P&I
- —
- Monthly cashflow
- —
- DSCR
- —
- Eligible?
- —
No personal income docs; deal must DSCR.
Hard money
10% down · 12.0% · 12mo
- Down + closing
- —
- Monthly P&I
- —
- Monthly cashflow
- —
- DSCR
- —
- Eligible?
- —
Short-term bridge; refi at stabilization.
Listing history 20 events
-
2026-05-11status Pending
-
2026-03-17status Active
-
2026-03-17$139,900 Active
-
2026-03-17historical
-
2026-01-29status Pending
-
2026-01-09$139,900 Active
-
2026-01-09historical
-
2025-11-05$144,900 Active
-
2024-12-03historical
-
2024-07-25price $144,900
-
2024-07-10$149,900 Active
-
2021-08-30soldstatus $119,500
-
2021-08-27soldstatus $119,498 Sold
-
2021-07-21status Pending
-
2021-07-12$119,500 Active
-
2017-08-14soldstatus $103,000
-
2017-04-25$103,000
-
2015-06-22soldstatus $40,001
-
2015-03-23$49,900
-
2000-01-13soldstatus $33,000
ⓘ Source: listings_history table (triggers on properties + properties_extension) + one-shot
backfill from property_details.listing_events for pre-trigger history.
Tax reassessment forecast OK · Resets to sale price
- Current annual tax
- $1,396 · $116/mo
- Projected year-2 tax
- $1,396 · $116/mo
- Expected delta
- $0/yr ($0/mo · 0.0%)
ⓘ Screening estimate from a state-policy table — verify with the county assessor before closing.
Climate risk First Street
- Flood 1/10 Low FEMA zone X (unshaded) · 0% chance over 30 yrs
- Wildfire 6/10 Major
- Heat 6/10 Major 7 d/yr ≥107°F today · 20 d/yr by 30 yrs out
- Wind 2/10 Low 2% chance of damaging wind over 30 yrs
- Air quality 1/10 Low 0 unhealthy d/yr today · 0 by 30 yrs out
Nearby sold comps map
Loading sold comps map…
Walkable amenities ~0.75 mi
Loading nearby amenities…
Taxation est. · year 1
- Rental income
- $12,756
- − Mortgage interest
- −$7,837
- − Property taxes
- −$1,396
- − Insurance
- −$700
- − Repairs & maintenance
- −$1,020
- − Management
- −$1,020
- − Depreciation
- −$4,070
- Taxable loss
- −$3,287
- Est. tax savings @ 24.0%
- +$789
- After-tax cash flow
- $-33/yr
For passive investors: Depreciation is non-cash, so a rental often shows a tax loss while cash-flowing — sheltering income. Rental losses are passive: they offset passive income freely, and up to $25,000/yr can offset ordinary (W-2) income if you actively participate and your MAGI is under $100k (phasing out to $0 by $150k); unused losses carry forward. On sale, claimed depreciation is recaptured at up to 25%, and gains may owe capital-gains tax (a 1031 exchange can defer both). Figures are a year-1 estimate at your 24.0% rate — not tax advice; consult a CPA.
Schools (NCES district)
- District
- Clinton
- NCES district ID
- 4008070
- Math proficiency
- 21% ▼ -7.00%
- Reading proficiency
- 23% ▼ -7.00%
- Median HH income
- $43,693
- Composite
- 18.97/100
- National rank
- #8853
- State rank
- #149 of 270 in OK
Livability — Clinton
- Score
- 63/100
- State rank
- #196
- US rank
- #14999
Category grades
Schools grade is shown separately in the Schools card above.
Census & demographics
- Census place
- Clinton, OK
- Population (ZIP)
- 9,489
Population outlook (Custer County) Hauer SSP2
- Today (2025)
- 34,356 people
- By 2030
- 37,162 · +8.2%
- By 2040
- 43,354 · +26.2%
- By 2050
- 50,458 · +46.9%
- By 2075
- 71,075 · +106.9%
- By 2100
- 91,129 · +165.2%
Race, ethnicity, and origin ACS 2023
- Neighborhood character
- Diverse neighborhood (Simpson 0.61)
- Race & ethnicity
- White 52% Hispanic / Latino 34% Two or more races 17% Native American 5% Black 5%
- Hispanic origin (detail)
- Mexican 32%
- Common ancestry
- Slovak 1% Lithuanian 1% Scottish 1%
- Foreign-born
- 9% · Canada
- Languages at home
- 76% English-only · Spanish 23% Chinese 1%
Political lean MEDSL · Custer
- 2024 margin
- Solid R (+53.2) · D 22.4% · R 75.7% · Other 1.9%
- 2008→2024 swing
- -3.9pp toward R · 2008: -49.3pp · 2024: -53.2pp
- All cycles
- 2024: R+53.2 2020: R+53.2 2016: R+54.3 2012: R+51.9 2008: R+49.3
Not yet ingested
- Civics
- —
Market trends
- HPI YoY
- ▼ -2.36%
- Current HPI
- 244.5526
- Rent YoY
- —
- Metro
- —
- State GDP YoY
- ▲ 1.55%
- F500 in state
- 6
Industry mix (Fortune 500 HQ in OK)
| Industry | F500 HQs | Revenue |
|---|---|---|
| Energy | 3 | $48B |
|
||
Price history
+323.9% since first listed20 events — show timeline
- 2026-05-11 Pending — MLSOK
- 2026-03-17 Relisted — MLSOK
- 2026-03-17 Listing Removed — MLSOK
- 2026-03-17 Listed $139,900 MLSOK
- 2026-01-29 Pending — MLSOK
- 2026-01-09 Listing Removed — MLSOK
- 2026-01-09 Listed $139,900 MLSOK
- 2025-11-05 Listed $144,900 MLSOK
- 2024-12-03 Listing Removed — MLSOK
- 2024-07-25 Price Changed $144,900 MLSOK
- 2024-07-10 Listed $149,900 MLSOK
- 2021-08-30 Sold (Public Records) $119,500 Public Records
- 2021-08-27 Sold (MLS) $119,498 MLSOK
- 2021-07-21 Pending — MLSOK
- 2021-07-12 Listed $119,500 MLSOK
- 2017-08-14 Sold (MLS) $103,000 MLSOK
- 2017-04-25 Listed $103,000 MLSOK
- 2015-06-22 Sold (MLS) $40,001 MLSOK
- 2015-03-23 Listed $49,900 MLSOK
- 2000-01-13 Sold (Public Records) $33,000 Public Records
Property tax history
+13.4%/yrLatest (2023): $1,396 · +10.6% YoY. Source: county tax records.
Cash-flow waterfall
monthlySold comps — $/sqft
last 12 mo · ≤1 miLoading sold comps…