 Duplex
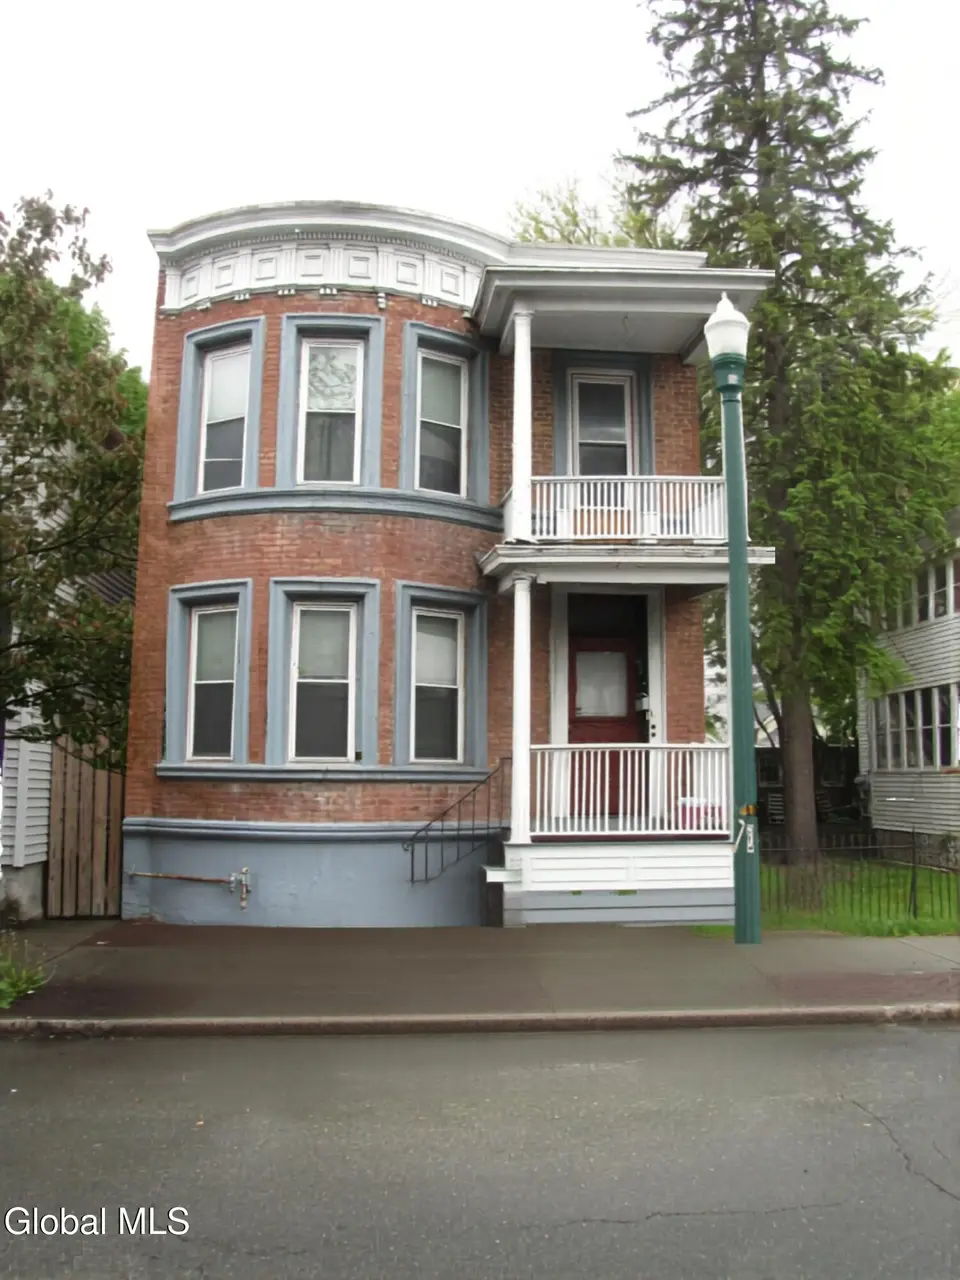
413 5th Ave · Troy, NY
Flood risk 8/10 · Major
- FEMA flood zone
- X (shaded)
- Chance of flooding over 30 yrs
- 0.96%
- Est. flood insurance / yr
- $473 – $860
Fire risk 4/10 · Minor
- Est. fire insurance / yr
- $691 – $1,283
Heat risk 4/10 · Minor
- Hot days now (above 95°F)
- 7 days/yr
- Hot days in 30 yrs
- 17 days/yr
Wind risk 3/10 · Minor
- Chance of severe wind over 30 yrs
- 6.0%
Air-quality risk 2/10 · Minimal
- Unhealthy air days now
- 0 days/yr
- Unhealthy air days in 30 yrs
- 1 days/yr
Risk factors via First Street. Map © Google.
Why this score? — see what drove the B- grade
The composite is a weighted blend of 9 inputs, each scored 0–100. Each bar is that input's sub-score; the figure is the points it added to the 100-point composite (weight × sub-score).
- Cash flow +30.0/30.0
- DSCR +10.0/10.0
- 1% rule +8.8/10.0
- ARV discount +5.8/15.0
- Livability +4.0/5.0
- Schools +2.8/10.0
- Rent growth +2.5/5.0
- Condition / age +2.5/5.0
- Appreciation +0.0/10.0
$235,500
🖨 Deal sheet 📄 Offer letter ✓ Due diligence
Multi-family units
County records classify this as Multi-Family (2-4 Unit). Listing-text estimate: 2 units. confirmed
Listing remarks MLS
Incredibly maintained Brick 2 family in North Troy. Gas hot air in both flats, all separate utilities including water, roof 10 years young, newer windows & off street parking. Long time tenant downstairs and leased up, (rents could both be higher) All mechanicals are either newer or well maintained. 3 BR up, 2 BR down, LR, DR, eat in kitchens & fenced in backyard. Property right one bus line and close to everything. Great to owner occupy or investment w/ no work to be done! Taxes do not reflect star. Very Good Condition
Key facts
- Separate utilities
- Mechanicals updated
- Off street parking
Tags
Property features AI
Exterior
- Parking: Off-street parking for 2 vehicles
- Utilities: Public water; Public sewer
- Home design: Duplex; Living area approximately 2,292
- Construction: Brick construction
- Exterior features: Rubber roof; Other exterior features
Interior
- Bedrooms: Unit 1: 2 bedrooms; Unit 2: 3 bedrooms
- Bathrooms: 2 full bathrooms (one on 1st level, one on 2nd level); Unit 1: 1 full bathroom; Unit 2: 1 full bathroom
- Heating & cooling: Forced air heating; Natural gas heating
- Interior features: Unfinished walk-out basement; Laundry closet
- Laundry & utility: Laundry closet
Neighborhood map
What this means for you Summary
Snapshot
- This is a 2 × 2-bed/1.0-bath units multifamily listed at $236k.
Deal economics
- At list price, monthly cash flow is $826 ($10k/yr) — positive. Per door: $413/mo.
- The deal already cash-flows at list — no discount required.
- Meets the 1% rule at list price ($3k rent vs $236k).
- Recommended offer: $232k (1.5% below list) — sets the bar for market timing.
- Cap rate 10.8% vs local median 5.3% in Troy — top-decile yield for the area; either an underpriced asset or a hidden risk that comps aren't pricing in. Stress-test before assuming the spread holds.
Location & tenants
- Location reads 81/100 on livability (#88 in NY, #1,350 nationally) — a professional / high-income tenant draw. Strengths: amenities A+, commute A+, housing A+; Watch: schools C-, employment C-, crime F.
- Lansingburgh Central School District (urban): math 31% / reading 35% proficiency, ranked #566 of 590 in NY (top 96%) — families likely to look elsewhere, expect single-tenant / working-renter base with shorter leases.
- Market conditions: 75 active listings in the ZIP; 405 units permitted in Rensselaer County in 2024 (224 in 5+ unit buildings).
Forward outlook
- Local home prices are declining (-3.0%/yr); year-one equity from $2k of loan paydown is wiped out by about $7k of value loss. Plan a longer hold.
- Rensselaer County population projected to shrink 6% by 2050 — rents likely to lag national; underwrite the cash flow, not the appreciation.
- At projected returns (-3.0% appreciation + 3.0% rent growth), your $66k cash investment doubles in ~8 years — after that, you're playing with house money.
Negotiation context
- It's been on market 28 days — a 2% lower offer ($232k) is reasonable based on typical stale-listing flexibility.
- 2 sale attempts since 8y ago with the ask held roughly flat each time — persistent listings suggest the price (not the market) is what's stuck; bring a comps-based counter.
- Current owner paid $149k; list at $236k implies a 58% gain — meaningful room to come down on a strong offer.
Risks & watch-outs
- Watch-outs: flood insurance adds $56/mo; built in 1940 — expect roof / HVAC / electrical / plumbing capex.
- Climate carrying-cost: severe flood risk — expect insurance premiums to compound above CPI over the hold.
Questions for the listing agent
- Can we see the unit-by-unit rent roll, current vacancy, and any below-market leases? What's the average tenancy length?
- What capital expenditures (roof, boiler, parking lot, exteriors) have been made in the last 5 years, and what's planned in the next 2?
- Built in 1940 — when were the roof, HVAC, electrical panel, plumbing, and water heater last replaced?
- What's the actual annual flood-insurance premium (NFIP or private), and is the property in a SFHA with mandatory coverage?
- Is there a deadline driving the sale (1031 exchange, divorce, estate, relocation)? That informs how much negotiation room exists.
- Crime grade is F in this area — have there been break-ins, vandalism, or insurance claims at this property in the last 3 years? What carrier currently insures it and at what premium?
- What's the average days-on-market for RENTAL listings here right now (not sales)? A rising rental-DOM trend means longer vacancies and softer asking-rent achievability than the comps imply.
- What's the recent tenant-quality profile in this submarket — average credit score on applications, eviction rate, late-payment / NSF rate, and stable-employment percentage? A property-management company in the area should have these aggregated.
- How much new apartment / multifamily construction is in the pipeline within 1–3 miles? Heavy new supply (>2% of stock underway) typically softens rents 12–24 months out; light construction supports rent growth.
Investment metrics
- 1% rule
- 1.38% ✓
- Cap rate
- 10.78%
- Cash-on-cash
- 16.03%
- DSCR
- 1.71
- GRM
- 6.0
CMA / ARV
- ARV (on-the-fly)
- $226,908
- Comps found
- 12
Show comp detail 12 sales within ~0.75 mi
| Address | Dist | Beds/Ba | Sqft | Sold | Price | $/sf | Match |
|---|---|---|---|---|---|---|---|
| 416 7th Ave | 0.15mi | 6/2.0 (+1) | 2,112 (-8%) | 2mo | $205,000 | $97 | 73 |
| 33 110th St | 0.03mi | 4/2.0 (-1) | 2,026 (-12%) | 5mo | $205,000 | $101 | 70 |
| 288 5th Ave | 0.36mi | 6/2.0 (+1) | 2,216 (-3%) | 4mo | $140,000 | $63 | 69 |
| 418 7th Ave | 0.15mi | 5/2.0 | 2,025 (-12%) | 6mo | $227,000 | $112 | 68 |
| 106 Continental Ave | 0.56mi | 6/2.0 (+1) | 2,388 (+4%) | 1mo | $250,000 | $105 | 61 |
| 69 Heartt Ave | 0.66mi | 4/2.0 (-1) | 2,300 (+0%) | 3mo | $278,000 | $121 | 61 |
| 43 Continental Ave | 0.63mi | 6/2.0 (+1) | 2,332 (+2%) | 7mo | $230,000 | $99 | 57 |
| 172 6th Ave | 0.67mi | 6/2.0 (+1) | 2,454 (+7%) | 1mo | $220,000 | $90 | 51 |
| 145 6th Ave | 0.74mi | 6/2.0 (+1) | 2,154 (-6%) | 2mo | $210,000 | $97 | 48 |
| 670 5th Ave | 0.71mi | 5/3.0 | 2,440 (+6%) | 5mo | $231,500 | $95 | 48 |
| 66 Park Ave | 0.72mi | 6/2.0 (+1) | 2,464 (+8%) | 3mo | $220,000 | $89 | 47 |
| 662 5th Ave | 0.68mi | 6/2.0 (+1) | 2,475 (+8%) | 6mo | $244,215 | $99 | 45 |
Match score weights: distance 35% · size 25% · config 20% · recency 20%. Top-matched comps best support the ARV.
Projected returns pro-forma
-3.0% appreciation · 3.0% rent growth · sell at horizon
- IRR
- 5.7%
- Equity multiple
- 1.22×
- Total profit
- $14,533
- Equity at exit
- $35,114
- IRR
- 15.1%
- Equity multiple
- 2.23×
- Total profit
- $80,832
- Equity at exit
- $20,362
Cash invested: $65,940 (down + closing). Projections, not guarantees.
Landlord ↔ Tenant lean methodology
- Overall (STATE)
- 15 Strongly Tenant-Friendly
- State New York
- 15 Strongly Tenant-Friendly · D+10
- County
- — inherits STATE
- City
- — inherits STATE
ZIP-level market 12182
- Home prices YoY
- -15.6%
- Active inventory
- 75
- Price-to-rent
- 12.1×
Monthly cashflow live
- Estimated rent
- $3,245 high interval (Pro) →
- Mortgage (P&I)
- −$1,235
- Tax from tax record
- −$349 /mo · $4,193/yr
- Insurance
- −$98
- Flood insurance flood zone
- −$56 /mo · $666/yr
- HOA
- −$0
- Vacancy / Maint / Mgmt
- −$681
- Net cashflow
- $826
Break-even live
2-unit breakdown (identical units grouped — click to expand)
| Units | Beds | Baths | Est. rent |
|---|---|---|---|
| 2× units | 2 | 1 | $3,246 |
| #1 | 2 | 1 | $1,623 |
| #2 | 2 | 1 | $1,623 |
| Total (2 units) | $3,245 | ||
UW: 25.0% down · 7.5% · 30yr · 1.5% tax · 5.0% vac · 8.0% maint · 8.0% mgmt
Financing live
Cash to close
- Down payment
- $58,875
- Closing costs
- $7,065
- Reserves months
- —
- Total cash needed
- —
Loan-product check · same deal, 3 products live
Conventional
25% down · 7.5% · 30yr
- Down + closing
- —
- Monthly P&I
- —
- Monthly cashflow
- —
- DSCR
- —
- Eligible?
- —
Personal DTI + credit; lowest rate.
DSCR
20% down · 8.5% · 30yr
- Down + closing
- —
- Monthly P&I
- —
- Monthly cashflow
- —
- DSCR
- —
- Eligible?
- —
No personal income docs; deal must DSCR.
Hard money
10% down · 12.0% · 12mo
- Down + closing
- —
- Monthly P&I
- —
- Monthly cashflow
- —
- DSCR
- —
- Eligible?
- —
Short-term bridge; refi at stabilization.
Listing history 22 events
-
2026-06-18days on market $235,500 Active 28 DOM
-
2026-06-17days on market $235,500 Active 27 DOM
-
2026-06-16days on market $235,500 Active 26 DOM
-
2026-06-15days on market $235,500 Active 25 DOM
-
2026-06-14days on market $235,500 Active 23 DOM
-
2026-06-10days on market $235,500 Active 20 DOM
-
2026-06-09days on market $235,500 Active 19 DOM
-
2026-06-09price $235,500 Active 18 DOM
-
2026-06-08days on market $245,500 Active 18 DOM
-
2026-06-07days on market $245,500 Active 17 DOM
-
2026-06-05days on market $245,500 Active 14 DOM
-
2026-06-03days on market $245,500 Active 13 DOM
-
2026-06-02days on market $245,500 Active 12 DOM
-
2026-06-01days on market $245,500 Active 11 DOM
-
2026-05-31days on market $245,500 Active 10 DOM
-
2026-05-31days on market $245,500 Active 9 DOM
-
2026-05-21$245,500 Active
-
2019-04-29soldstatus $148,950 Closed (Final Sale) 533-char remark
Show marketing remark (533 chars)
Incredibly maintained Brick 2 family in North Troy. Gas hot air in both flats, all separate utilities including water, roof 10 years young, newer windows & off street parking. Long time tenant downstairs and leased up, (rents could both be higher) All mechanicals are either newer or well maintained. 3 BR up, 2 BR down, LR, DR, eat in kitchens & fenced in backyard. Property right one bus line and close to everything. Great to owner occupy or investment w/ no work to be done! Taxes do not reflect star. Very Good Condition
-
2019-04-29soldstatus $145,758
Show marketing remark (533 chars)
Incredibly maintained Brick 2 family in North Troy. Gas hot air in both flats, all separate utilities including water, roof 10 years young, newer windows & off street parking. Long time tenant downstairs and leased up, (rents could both be higher) All mechanicals are either newer or well maintained. 3 BR up, 2 BR down, LR, DR, eat in kitchens & fenced in backyard. Property right one bus line and close to everything. Great to owner occupy or investment w/ no work to be done! Taxes do not reflect star. Very Good Condition
-
2019-01-24status Pend (Under Cntr) 533-char remark
Show marketing remark (533 chars)
Incredibly maintained Brick 2 family in North Troy. Gas hot air in both flats, all separate utilities including water, roof 10 years young, newer windows & off street parking. Long time tenant downstairs and leased up, (rents could both be higher) All mechanicals are either newer or well maintained. 3 BR up, 2 BR down, LR, DR, eat in kitchens & fenced in backyard. Property right one bus line and close to everything. Great to owner occupy or investment w/ no work to be done! Taxes do not reflect star. Very Good Condition
-
2018-10-09$149,900 New 533-char remark
Show marketing remark (533 chars)
Incredibly maintained Brick 2 family in North Troy. Gas hot air in both flats, all separate utilities including water, roof 10 years young, newer windows & off street parking. Long time tenant downstairs and leased up, (rents could both be higher) All mechanicals are either newer or well maintained. 3 BR up, 2 BR down, LR, DR, eat in kitchens & fenced in backyard. Property right one bus line and close to everything. Great to owner occupy or investment w/ no work to be done! Taxes do not reflect star. Very Good Condition
-
1993-02-23soldstatus $75,000
ⓘ Source: listings_history table (triggers on properties + properties_extension) + one-shot
backfill from property_details.listing_events for pre-trigger history.
Tax reassessment forecast NY · Partial reset (capped growth)
- Current annual tax
- $4,193 · $349/mo
- Projected year-2 tax
- $4,193 · $349/mo
- Expected delta
- $0/yr ($0/mo · 0.0%)
ⓘ Screening estimate from a state-policy table — verify with the county assessor before closing.
Climate risk First Street
- Flood 8/10 Severe FEMA zone X (shaded) · 96% chance over 30 yrs
- Wildfire 4/10 Moderate
- Heat 4/10 Moderate 7 d/yr ≥95°F today · 17 d/yr by 30 yrs out
- Wind 3/10 Moderate 6% chance of damaging wind over 30 yrs
- Air quality 2/10 Low 0 unhealthy d/yr today · 1 by 30 yrs out
Nearby sold comps map
Loading sold comps map…
Walkable amenities ~0.75 mi
Loading nearby amenities…
Taxation est. · year 1
- Rental income
- $38,940
- − Mortgage interest
- −$13,192
- − Property taxes
- −$4,193
- − Insurance
- −$1,844
- − Repairs & maintenance
- −$3,115
- − Management
- −$3,115
- − Depreciation
- −$6,851
- Taxable income
- $6,630
- Est. tax owed @ 24.0%
- −$1,591
- After-tax cash flow
- $8,315/yr
For passive investors: Depreciation is non-cash, so a rental often shows a tax loss while cash-flowing — sheltering income. Rental losses are passive: they offset passive income freely, and up to $25,000/yr can offset ordinary (W-2) income if you actively participate and your MAGI is under $100k (phasing out to $0 by $150k); unused losses carry forward. On sale, claimed depreciation is recaptured at up to 25%, and gains may owe capital-gains tax (a 1031 exchange can defer both). Figures are a year-1 estimate at your 24.0% rate — not tax advice; consult a CPA.
Schools (NCES district)
- District
- Lansingburgh Central School District
- NCES district ID
- 3616740
- Math proficiency
- 31% ▼ -7.00%
- Reading proficiency
- 35% ▼ -6.00%
- Median HH income
- $44,807
- Composite
- 28.19/100
- National rank
- #6810
- State rank
- #566 of 590 in NY
Livability — Troy
- Score
- 81/100
- State rank
- #88
- US rank
- #1350
Category grades
Schools grade is shown separately in the Schools card above.
Census & demographics
- Census place
- Troy, NY
- City population
- 53,479
- Population (ZIP)
- 14,273
Population outlook (Rensselaer County) Hauer SSP2
- Today (2025)
- 162,400 people
- By 2030
- 161,746 · -0.4%
- By 2040
- 158,095 · -2.7%
- By 2050
- 152,966 · -5.8%
- By 2075
- 140,767 · -13.3%
- By 2100
- 124,727 · -23.2%
Race, ethnicity, and origin ACS 2023
- Neighborhood character
- Predominantly White (70%)
- Race & ethnicity
- White 70% Black 14% Two or more races 12% Hispanic / Latino 7%
- Hispanic origin (detail)
- Puerto Rican 6%
- Common ancestry
- Lithuanian 7% Romanian 3% Iranian 1%
- Foreign-born
- 3% · Canada, Jamaica
- Languages at home
- 94% English-only · Spanish 4% Other Indo-European 1%
Political lean MEDSL · Rensselaer
- 2024 margin
- Toss-up / Even · D 50.7% · R 49.3%
- 2008→2024 swing
- -8.0pp toward R · 2008: 9.3pp · 2024: 1.4pp
- All cycles
- 2024: D+1.4 2020: D+5.6 2016: R+2.9 2012: D+11.8 2008: D+9.3
Not yet ingested
- Civics
- —
Market trends
- HPI YoY
- ▼ -50.58%
- Current HPI
- 273.5758
- Rent YoY
- —
- Metro
- —
- State GDP YoY
- ▲ 2.60%
- F500 in state
- 92
Industry mix (Fortune 500 HQ in NY)
| Industry | F500 HQs | Revenue |
|---|---|---|
| Financial Services | 10 | $950B |
|
||
| Consumer Goods | 9 | $162B |
|
||
| Insurance | 4 | $225B |
|
||
| Telecommunications | 2 | $144B |
|
||
| Pharmaceuticals | 2 | $112B |
|
||
| Media / Entertainment | 2 | $69B |
|
||
Price history
+227.3% since first listed6 events — show timeline
- 2026-05-21 Listed $245,500 Global MLS
- 2019-04-29 Sold (Public Records) $145,758 Public Records
- 2019-04-29 Sold (MLS) $148,950 Global MLS
- 2019-01-24 Pending — Global MLS
- 2018-10-09 Listed $149,900 Global MLS
- 1993-02-23 Sold (Public Records) $75,000 Public Records
Property tax history
+17.3%/yrLatest (2025): $4,193 · +20.7% YoY. Source: county tax records.
Cash-flow waterfall
monthlySold comps — $/sqft
last 12 mo · ≤1 miLoading sold comps…