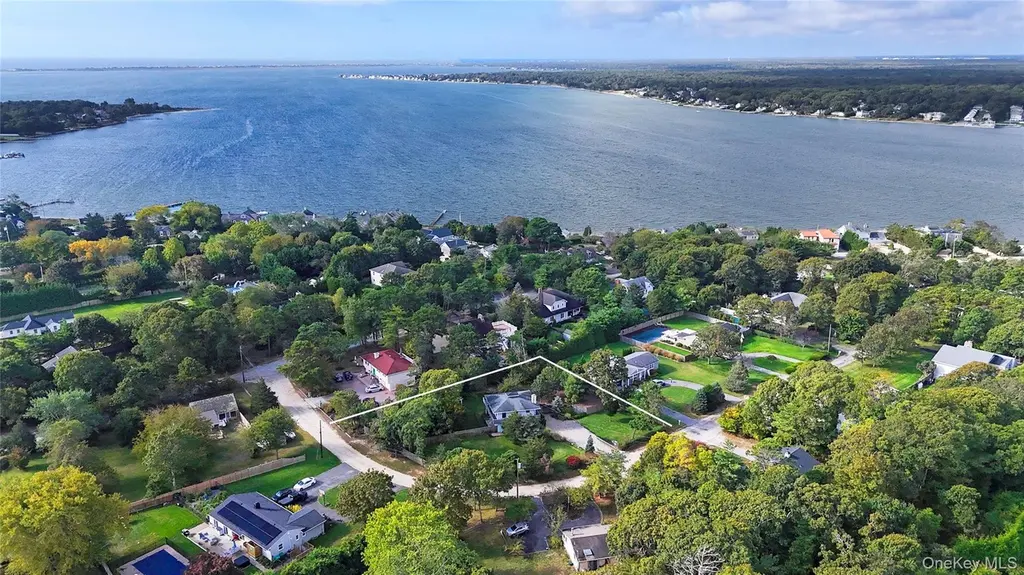
3 Jefferson Ave · Hampton Bays, NY
Flood risk 1/10 · Minimal
- FEMA flood zone
- X (unshaded)
- Chance of flooding over 30 yrs
- 0.0%
- Est. flood insurance / yr
- $473 – $860
Fire risk 1/10 · Minimal
- Est. fire insurance / yr
- $691 – $1,283
Heat risk 4/10 · Minor
- Hot days now (above 90°F)
- 7 days/yr
- Hot days in 30 yrs
- 20 days/yr
Wind risk 8/10 · Major
- Chance of severe wind over 30 yrs
- 80.0%
Air-quality risk 3/10 · Minor
- Unhealthy air days now
- 2 days/yr
- Unhealthy air days in 30 yrs
- 3 days/yr
Risk factors via First Street. Map © Google.
Why this score? — see what drove the C grade
The composite is a weighted blend of 9 inputs, each scored 0–100. Each bar is that input's sub-score; the figure is the points it added to the 100-point composite (weight × sub-score).
- Cash flow +23.1/30.0
- ARV discount +7.6/15.0
- DSCR +7.4/10.0
- 1% rule +5.2/10.0
- Rent growth +5.0/5.0
- Schools +4.0/10.0
- Livability +3.4/5.0
- Condition / age +2.5/5.0
- Appreciation +0.0/10.0
$925,000
🖨 Deal sheet 📄 Offer letter ✓ Due diligence
Listing remarks MLS
Discover the charm of this unique upside-down beach home nestled in the desirable Rampasture area. Set on a generous .45-acre lot, with room for a pool, this residence offers a perfect blend of light-filled interiors and inviting outdoor spaces. The second floor serves as the heart of the home, boasting an open-concept living area bathed in natural light, complete with a wrap-around deck that invites you to enjoy the serene surroundings. The modern kitchen features an island that seamlessly connects to the living and dining room, where a cozy fireplace adds warmth and ambiance. A full bathroom on this level provides convenience and functionality. On the first floor, you'll find two comfortable bedrooms, an additional full bathroom, and a versatile living room/den area. The enchanting four-season sunroom offers a tranquil space to relax year-round. Step outside to a spacious backyard, perfect for entertaining or simply soaking in the natural beauty. An outdoor shower adds a touch of beachside convenience. This home is ideally located within walking distance to a private deeded bay beach, offering endless opportunities for scenic walks and water activities. Plus, you're just 10 minutes from the renowned Dune Road and the Town of Southampton ocean beaches, making every day feel like a vacation.
Key facts
- Generous lot
- Spacious backyard
- Wrap-around deck
Tags
Neighborhood map
What this means for you Summary
Snapshot
- This is a 3-bed/2.0-bath single-family listed at $925k.
Deal economics
- At list price, monthly cash flow is $2k ($20k/yr) — positive.
- The deal already cash-flows at list — no discount required.
- Meets the 1% rule at list price ($9k rent vs $925k).
- Recommended offer: $870k (6.0% below list) — sets the bar for market timing.
- Cap rate 8.5% vs local median 6.4% in Hampton Bays — top-decile yield for the area; either an underpriced asset or a hidden risk that comps aren't pricing in. Stress-test before assuming the spread holds.
Location & tenants
- Location reads 68/100 on livability (#551 in NY) — a middle-class / working-renter tenant base. Strengths: crime A+, employment A+, health & safety B+; Watch: amenities F, commute F, cost of living F.
- Hampton Bays Union Free School District (suburban): math 45% / reading 44% proficiency, ranked #434 of 590 in NY (top 74%) — families likely to look elsewhere, expect single-tenant / working-renter base with shorter leases.
- Market conditions: Rents rising fast (+16.1%/yr); 172 active listings in the ZIP; 29 comparable units currently listed for rent nearby; rentals lingering (median 44d on market — plan ~5-8 weeks vacancy on turnover, expect pricing pressure); 52% of comp listings sitting > 30 days — soft ceiling on asking rent; high-income renter base; 1,366 units permitted in Suffolk County in 2024 (216 in 5+ unit buildings).
- At $9,399/mo this rent would consume 84% of the median local household income ($134k/yr) (locally 199% of renters already pay >50% of income on rent) — very limited rent-growth headroom before tenants either downsize or default.
Forward outlook
- Local home prices are declining (-3.0%/yr); year-one equity from $6k of loan paydown is wiped out by about $28k of value loss. Plan a longer hold.
- Suffolk County population projected to shrink 5% by 2050 — rents likely to lag national; underwrite the cash flow, not the appreciation.
- At projected returns (-3.0% appreciation + 8.0% rent growth), your $259k cash investment doubles in ~9 years — after that, you're playing with house money.
Negotiation context
- It's been on market 82 days — a 6% lower offer ($870k) is reasonable based on typical stale-listing flexibility.
- 4 sale attempts since 13y ago; this cycle's ask has dropped $74k (7%) from the opening price — seller is motivated, your offer sets the floor, not the list.
- Current owner paid $120k; list at $925k implies a 671% gain — meaningful room to come down on a strong offer.
Risks & watch-outs
- Climate carrying-cost: severe wind risk, 80% chance of damaging wind over 30y — expect insurance premiums to compound above CPI over the hold.
Questions for the listing agent
- It's been on market 82 days. Have you received any prior offers? Is the seller open to a 6% concession, seller financing, or rate buy-down credit?
- Built in 1973 — when were the roof, HVAC, electrical panel, plumbing, and water heater last replaced?
- Why hasn't it sold? Are there any deal-killer items the seller is aware of (foundation, flood, title, zoning, code violations)?
- Is there a deadline driving the sale (1031 exchange, divorce, estate, relocation)? That informs how much negotiation room exists.
- Schools are B-rated — typically a magnet for longer-tenancy family renters. What's the average tenant stay here, and is there a school-zone premium baked into asking?
- What's the average days-on-market for RENTAL listings here right now (not sales)? A rising rental-DOM trend means longer vacancies and softer asking-rent achievability than the comps imply.
- What's the recent tenant-quality profile in this submarket — average credit score on applications, eviction rate, late-payment / NSF rate, and stable-employment percentage? A property-management company in the area should have these aggregated.
- How much new for-sale + rental construction is in the pipeline within 1–3 miles? Heavy new supply typically softens prices + rents 12–24 months out; constrained supply supports both.
Investment metrics
- 1% rule
- 1.02% ✓
- Cap rate
- 8.45%
- Cash-on-cash
- 7.72%
- DSCR
- 1.34
- GRM
- 8.2
CMA / ARV
- ARV (median comp)
- $926,396
- List price
- $925,000
- Delta
- -0.15%
- Verdict
- FAIR
- Comps
- 20 within 1.0 mi
Show comp detail 12 sales within ~0.75 mi
| Address | Dist | Beds/Ba | Sqft | Sold | Price | $/sf | Match |
|---|---|---|---|---|---|---|---|
| 5 Coolidge Rd | 0.31mi | 3/2.0 | 1,400 (+4%) | 8mo | $699,000 | $499 | 72 |
| 2 Marinea Pl | 0.14mi | 3/2.0 | 1,260 (-6%) | 14mo | $1,090,000 | $865 | 72 |
| 12 Hampton Bays Dr | 0.53mi | 3/2.0 | 1,320 (-2%) | 2mo | $967,500 | $733 | 70 |
| 17 Washington Dr | 0.27mi | 3/2.0 | 1,500 (+12%) | 14mo | $1,800,000 | $1,200 | 56 |
| 10 Harbor Rd | 0.48mi | 4/2.5 (+1) | 1,458 (+8%) | 0mo | $1,120,000 | $768 | 56 |
| 4 Wells Ln | 0.71mi | 2/1.5 (-1) | 1,378 (+2%) | 0mo | $1,115,000 | $809 | 55 |
| 1 Springville Cir | 0.37mi | 3/3.0 | 1,500 (+12%) | 8mo | $1,350,000 | $900 | 53 |
| 129 Springville Rd | 0.30mi | 3/2.0 | 1,520 (+13%) | 15mo | $780,000 | $513 | 52 |
| 53 Shore Rd | 0.72mi | 3/2.5 | 1,390 (+3%) | 10mo | $774,000 | $557 | 50 |
| 35A Neptune Ave | 0.55mi | 4/1.0 (+1) | 1,388 (+3%) | 12mo | $935,000 | $674 | 50 |
| 54 Ocean Ave | 0.64mi | 3/2.0 | 1,200 (-11%) | 11mo | $705,000 | $588 | 43 |
| 6 Nassau Rd | 0.72mi | 3/2.0 | 1,526 (+14%) | 14mo | $790,000 | $518 | 32 |
Match score weights: distance 35% · size 25% · config 20% · recency 20%. Top-matched comps best support the ARV.
Projected returns pro-forma
-3.0% appreciation · 8.0% rent growth · sell at horizon
- IRR
- 0.5%
- Equity multiple
- 1.02×
- Total profit
- $5,614
- Equity at exit
- $137,921
- IRR
- 14.4%
- Equity multiple
- 2.42×
- Total profit
- $366,546
- Equity at exit
- $79,977
Cash invested: $259,000 (down + closing). Projections, not guarantees.
Landlord ↔ Tenant lean methodology
- Overall (STATE)
- 15 Strongly Tenant-Friendly
- State New York
- 15 Strongly Tenant-Friendly · D+10
- County
- — inherits STATE
- City
- — inherits STATE
ZIP-level market 11946
- Home prices YoY
- -20.3%
- Rents YoY
- 16.1%
- Active inventory
- 172
- Price-to-rent
- 8.2×
Monthly cashflow live
- Estimated rent
- $9,399 medium interval (Pro) →
- Mortgage (P&I)
- −$4,851
- Tax from tax record
- −$523 /mo · $6,277/yr
- Insurance
- −$385
- HOA
- −$0
- Vacancy / Maint / Mgmt
- −$1,974
- Net cashflow
- $1,666
Break-even live
UW: 25.0% down · 7.5% · 30yr · 1.5% tax · 5.0% vac · 8.0% maint · 8.0% mgmt
Financing live
Cash to close
- Down payment
- $231,250
- Closing costs
- $27,750
- Reserves months
- —
- Total cash needed
- —
Loan-product check · same deal, 3 products live
Conventional
25% down · 7.5% · 30yr
- Down + closing
- —
- Monthly P&I
- —
- Monthly cashflow
- —
- DSCR
- —
- Eligible?
- —
Personal DTI + credit; lowest rate.
DSCR
20% down · 8.5% · 30yr
- Down + closing
- —
- Monthly P&I
- —
- Monthly cashflow
- —
- DSCR
- —
- Eligible?
- —
No personal income docs; deal must DSCR.
Hard money
10% down · 12.0% · 12mo
- Down + closing
- —
- Monthly P&I
- —
- Monthly cashflow
- —
- DSCR
- —
- Eligible?
- —
Short-term bridge; refi at stabilization.
Rent comps 29 comps
| Address | Beds | Baths | Sqft | Rent | $/sqft | DOM | Units | Dist |
|---|---|---|---|---|---|---|---|---|
| 35 Grant Blvd Hampton Bays, NY | 4.0 | 3.0 | 1484 | $35,000 | $23.58 | 24d | 1 | 0.14mi |
| 28 Bay Ave W Hampton Bays, NY | 3.0 | 2.5 | 945 | $66,000 | $69.84 | 43d | 1 | 0.30mi |
| 71 Hampton Rd Hampton Bays, NY | 3.0 | 2.5 | 1500 | $18,000 | $12.00 | 24d | 1 | 0.49mi |
| 51 Ocean Ave Hampton Bays, NY | 3.0 | 2.0 | 1200 | $5,000 | $4.17 | 43d | 1 | 0.60mi |
| 229 Springville Rd Hampton Bays, NY | 2.0 | 2.0 | 1200 | $6,000 | $5.00 | 19d | 1 | 0.62mi |
| 58 Ocean Ave Hampton Bays, NY | 3.0 | 2.0 | 1600 | $10,000 | $6.25 | 43d | 1 | 0.66mi |
| 73 W Tiana Rd Unit 11 Hampton Bays, NY | 2.0 | 1.0 | 1000 | $11,000 | $11.00 | 43d | 1 | 0.75mi |
| 121 Ponquogue Ave Hampton Bays, NY | 3.0 | 3.0 | 1316 | $27,000 | $20.52 | 24d | 1 | 0.78mi |
| 36 Nautilus Dr Hampton Bays, NY | 3.0 | 1.5 | 1726 | $36,000 | $20.86 | 43d | 1 | 0.81mi |
| 6 Rolling Hill Rd Hampton Bays, NY | 3.0 | 3.0 | 1697 | $18,000 | $10.61 | 1d | 1 | 0.84mi |
| 94 Bay Ave E Hampton Bays, NY | 2.0 | 2.0 | 1000 | $20,000 | $20.00 | 15d | 1 | 0.89mi |
| 18 Maryland Blvd Unit 1429741P Hampton Bays, NY | 3.0 | 3.0 | 1732 | $7,445 | $4.30 | 2d | 1 | 0.93mi |
| 104 W Tiana Rd Hampton Bays, NY | 3.0 | 1.5 | 900 | $15,000 | $16.67 | 43d | 1 | 0.94mi |
| 15 Gardners Ln Hampton Bays, NY | 3.0 | 2.0 | 1665 | $30,000 | $18.02 | 19d | 1 | 1.04mi |
| 25 Gardners Ln Unit A Hampton Bays, NY | 2.0 | 1.5 | 1000 | $3,750 | $3.75 | 24d | 1 | 1.05mi |
| 40 Kyle Rd Hampton Bays, NY | 3.0 | 2.0 | 1320 | $5,000 | $3.79 | 43d | 1 | 1.06mi |
| 47 School St Hampton Bays, NY | 4.0 | 3.0 | 1700 | $25,000 | $14.71 | 43d | 1 | 1.08mi |
| 6 Long Ln Hampton Bays, NY | 2.0 | 2.0 | 1163 | $40,000 | $34.39 | 24d | 1 | 1.09mi |
| 45 Bellows Ter Unit B Hampton Bays, NY | 4.0 | 2.0 | 1722 | $7,000 | $4.07 | 43d | 1 | 1.12mi |
| 2 Fairview Rd Hampton Bays, NY | 2.0 | 1.0 | 1440 | $17,500 | $12.15 | 17d | 1 | 1.13mi |
| 37 Maryland Blvd Hampton Bays, NY | 2.0 | 2.0 | 1640 | $20,000 | $12.20 | 43d | 1 | 1.20mi |
| 7 Huckleberry Ln Hampton Bays, NY | 4.0 | 2.5 | 1608 | $5,600 | $3.48 | 19d | 1 | 1.21mi |
| 138 W Tiana Rd Hampton Bays, NY | 3.0 | 1.0 | 1040 | $16,000 | $15.38 | 10d | 1 | 1.26mi |
| 3 Foster Ave Hampton Bays, NY | 2.0 | 2.0 | 1400 | $5,000 | $3.57 | 43d | 1 | 1.28mi |
| 60 Lynncliff Rd Hampton Bays, NY | 3.0 | 2.0 | 1536 | $27,000 | $17.58 | 43d | 1 | 1.29mi |
| 68 Foster Ave #12 Hampton Bays, NY | 2.0 | 1.5 | 1125 | $18,000 | $16.00 | 43d | 1 | 1.35mi |
| 168 W Tiana Rd Hampton Bays, NY | 3.0 | 2.0 | 1004 | $4,000 | $3.98 | 43d | 1 | 1.35mi |
| 81 Foster Ave Hampton Bays, NY | 4.0 | 3.5 | 1664 | $25,000 | $15.02 | 43d | 1 | 1.41mi |
| 5 Ardmore Ct Hampton Bays, NY | 3.0 | 2.0 | 1800 | $28,000 | $15.56 | 19d | 1 | 1.45mi |
Listing history 23 events
-
2026-06-18days on market $925,000 Active 82 DOM
-
2026-06-17days on market $925,000 Active 81 DOM
-
2026-06-16days on market $925,000 Active 80 DOM
-
2026-06-15days on market $925,000 Active 79 DOM
-
2026-06-13days on market $925,000 Active 77 DOM
-
2026-06-13pricedays on market $925,000 Active 76 DOM
-
2026-06-09days on market $960,000 Active 73 DOM
-
2026-06-08days on market $960,000 Active 72 DOM
-
2026-06-07days on market $960,000 Active 71 DOM
-
2026-06-04days on market $960,000 Active 68 DOM
-
2026-06-03days on market $960,000 Active 67 DOM
-
2026-06-02days on market $960,000 Active 66 DOM
-
2026-06-01days on market $960,000 Active 65 DOM
-
2026-05-31days on market $960,000 Active 64 DOM
-
2026-03-28$999,000 Active 1312-char remark
Show marketing remark (1312 chars)
Discover the charm of this unique upside-down beach home nestled in the desirable Rampasture area. Set on a generous .45-acre lot, with room for a pool, this residence offers a perfect blend of light-filled interiors and inviting outdoor spaces. The second floor serves as the heart of the home, boasting an open-concept living area bathed in natural light, complete with a wrap-around deck that invites you to enjoy the serene surroundings. The modern kitchen features an island that seamlessly connects to the living and dining room, where a cozy fireplace adds warmth and ambiance. A full bathroom on this level provides convenience and functionality. On the first floor, you'll find two comfortable bedrooms, an additional full bathroom, and a versatile living room/den area. The enchanting four-season sunroom offers a tranquil space to relax year-round. Step outside to a spacious backyard, perfect for entertaining or simply soaking in the natural beauty. An outdoor shower adds a touch of beachside convenience. This home is ideally located within walking distance to a private deeded bay beach, offering endless opportunities for scenic walks and water activities. Plus, you're just 10 minutes from the renowned Dune Road and the Town of Southampton ocean beaches, making every day feel like a vacation.
-
2026-01-12historical
-
2025-11-20price $999,999
-
2025-11-05$1,090,000 Active
-
2013-08-15historical
-
2013-07-21$449,000
-
2013-03-04historical
-
2013-02-08$349,000
-
1993-06-22soldstatus $120,000
ⓘ Source: listings_history table (triggers on properties + properties_extension) + one-shot
backfill from property_details.listing_events for pre-trigger history.
Tax reassessment forecast NY · Partial reset (capped growth)
- Current annual tax
- $6,277 · $523/mo
- Projected year-2 tax
- $10,955 · $913/mo
- Expected delta
- +$4,678/yr (+$390/mo · 74.5%)
ⓘ Screening estimate from a state-policy table — verify with the county assessor before closing.
Climate risk First Street
- Flood 1/10 Low FEMA zone X (unshaded) · 0% chance over 30 yrs
- Wildfire 1/10 Low
- Heat 4/10 Moderate 7 d/yr ≥90°F today · 20 d/yr by 30 yrs out
- Wind 8/10 Severe 80% chance of damaging wind over 30 yrs
- Air quality 3/10 Moderate 2 unhealthy d/yr today · 3 by 30 yrs out
Nearby sold comps map
Loading sold comps map…
Walkable amenities ~0.75 mi
Loading nearby amenities…
Taxation est. · year 1
- Rental income
- $112,782
- − Mortgage interest
- −$51,814
- − Property taxes
- −$6,277
- − Insurance
- −$4,625
- − Repairs & maintenance
- −$9,023
- − Management
- −$9,023
- − Depreciation
- −$26,909
- Taxable income
- $5,112
- Est. tax owed @ 24.0%
- −$1,227
- After-tax cash flow
- $18,760/yr
For passive investors: Depreciation is non-cash, so a rental often shows a tax loss while cash-flowing — sheltering income. Rental losses are passive: they offset passive income freely, and up to $25,000/yr can offset ordinary (W-2) income if you actively participate and your MAGI is under $100k (phasing out to $0 by $150k); unused losses carry forward. On sale, claimed depreciation is recaptured at up to 25%, and gains may owe capital-gains tax (a 1031 exchange can defer both). Figures are a year-1 estimate at your 24.0% rate — not tax advice; consult a CPA.
Schools (NCES district)
- District
- Hampton Bays Union Free School District
- NCES district ID
- 3613530
- Math proficiency
- 45% ▼ -8.00%
- Reading proficiency
- 44% ▼ -1.00%
- Median HH income
- $70,274
- Composite
- 40.18/100
- National rank
- #3788
- State rank
- #434 of 590 in NY
Livability — Hampton Bays
- Score
- 68/100
- State rank
- #551
- US rank
- #9894
Category grades
Schools grade is shown separately in the Schools card above.
Census & demographics
- Census place
- Hampton Bays, NY
- County
- Suffolk County · 679,920 people
- City population
- 15,819
- Metro
- New York-Newark-Jersey City, NY-NJ-PA
- Population (ZIP)
- 15,819
- Household income
- $133,918
- Rent vs Own
- Severe rent burden
- 199.0
Population outlook (Suffolk County) Hauer SSP2
- Today (2025)
- 1,505,262 people
- By 2030
- 1,498,318 · -0.5%
- By 2040
- 1,471,101 · -2.3%
- By 2050
- 1,424,848 · -5.3%
- By 2075
- 1,337,157 · -11.2%
- By 2100
- 1,217,720 · -19.1%
Race, ethnicity, and origin ACS 2023
- Neighborhood character
- Majority White (62%)
- Race & ethnicity
- White 62% Hispanic / Latino 32% Two or more races 13% Asian 3% Black 2%
- Hispanic origin (detail)
- Mexican 6%
- Common ancestry
- Romanian 4% Slovak 2% Portuguese 2%
- Foreign-born
- 26% · Canada, Jamaica, Guatemala
- Languages at home
- 64% English-only · Spanish 29% Other Indo-European 2% French/Haitian/Cajun 2%
Political lean MEDSL · Suffolk
- 2024 margin
- Lean R (+10.0) · D 45.0% · R 55.0%
- 2008→2024 swing
- -16.0pp toward R · 2008: 6.0pp · 2024: -10.0pp
- All cycles
- 2024: R+10.0 2020: R+0.0 2016: R+8.2 2012: D+2.9 2008: D+6.0
Not yet ingested
- Civics
- —
Market trends
- HPI YoY
- ▼ -118.82%
- Current HPI
- 467.2466
- Rent YoY
- ▲ 16.07%
- Metro
- New York-Newark-Jersey City, NY-NJ-PA
- State GDP YoY
- ▲ 2.60%
- F500 in state
- 92
Industry mix (Fortune 500 HQ in NY)
| Industry | F500 HQs | Revenue |
|---|---|---|
| Financial Services | 10 | $950B |
|
||
| Consumer Goods | 9 | $162B |
|
||
| Insurance | 4 | $225B |
|
||
| Telecommunications | 2 | $144B |
|
||
| Pharmaceuticals | 2 | $112B |
|
||
| Media / Entertainment | 2 | $69B |
|
||
Price history
+732.5% since first listed9 events — show timeline
- 2026-03-28 Listed $999,000 OneKey® MLS as Distributed by MLS Grid
- 2026-01-12 Listing Removed — OneKey® MLS as Distributed by MLS Grid
- 2025-11-20 Price Changed $999,999 OneKey® MLS as Distributed by MLS Grid
- 2025-11-05 Listed $1,090,000 OneKey® MLS as Distributed by MLS Grid
- 2013-08-15 Listing Removed — OneKey® MLS as Distributed by MLS Grid
- 2013-07-21 Listed $449,000 OneKey® MLS as Distributed by MLS Grid
- 2013-03-04 Listing Removed — OneKey® MLS as Distributed by MLS Grid
- 2013-02-08 Listed $349,000 OneKey® MLS as Distributed by MLS Grid
- 1993-06-22 Sold (Public Records) $120,000 Public Records
Property tax history
-0.2%/yrLatest (2024): $6,277 · +0.0% YoY. Source: county tax records.
Cash-flow waterfall
monthlySold comps — $/sqft
last 12 mo · ≤1 miLoading sold comps…