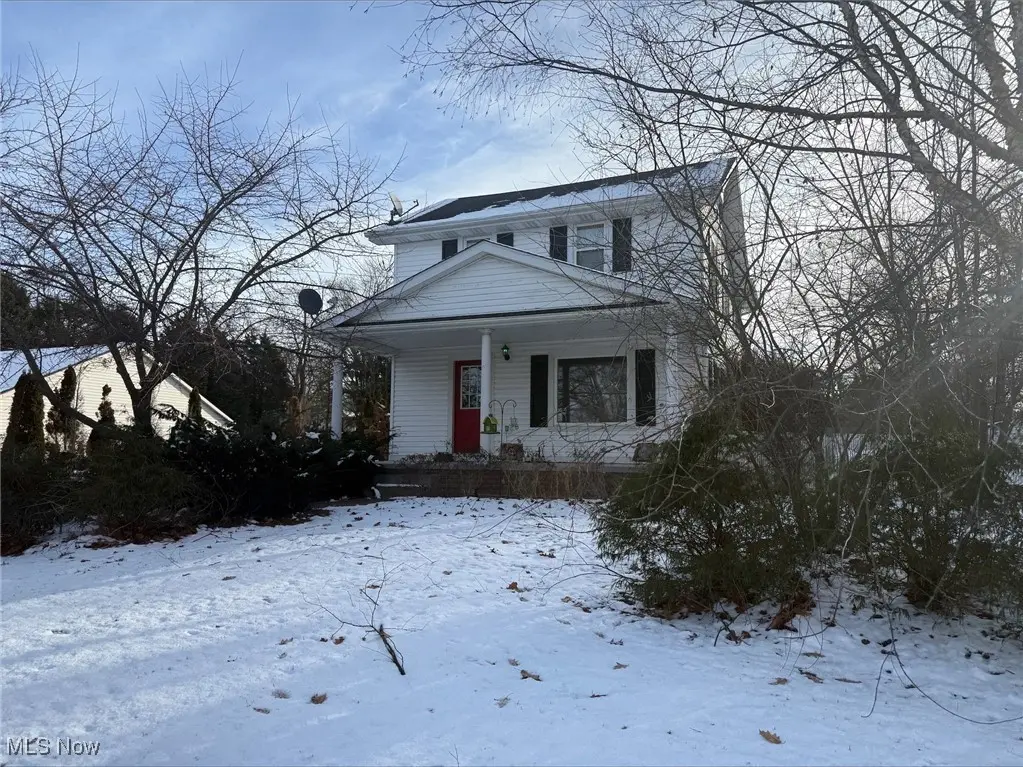
5700 Broadway Ave · Louisville, OH
Flood risk 1/10 · Minimal
- FEMA flood zone
- X (unshaded)
- Chance of flooding over 30 yrs
- 0.0%
- Est. flood insurance / yr
- $473 – $860
Fire risk 1/10 · Minimal
- Est. fire insurance / yr
- $713 – $1,323
Heat risk 3/10 · Minor
- Hot days now (above 96°F)
- 7 days/yr
- Hot days in 30 yrs
- 16 days/yr
Wind risk 1/10 · Minimal
- Chance of severe wind over 30 yrs
- —
Air-quality risk 2/10 · Minimal
- Unhealthy air days now
- 1 days/yr
- Unhealthy air days in 30 yrs
- 2 days/yr
Risk factors via First Street. Map © Google.
Why this score? — see what drove the C grade
The composite is a weighted blend of 9 inputs, each scored 0–100. Each bar is that input's sub-score; the figure is the points it added to the 100-point composite (weight × sub-score).
- Cash flow +15.1/30.0
- ARV discount +15.0/15.0
- Schools +5.9/10.0
- 1% rule +4.9/10.0
- DSCR +4.6/10.0
- Livability +4.0/5.0
- Rent growth +3.9/5.0
- Condition / age +2.5/5.0
- Appreciation +0.0/10.0
$160,000
🖨 Deal sheet 📄 Offer letter ✓ Due diligence
Listing remarks MLS
Welcome to a fantastic opportunity in Louisville, OH! This 3-bedroom, 2-bathroom home sits on a generous . 74-acre lot, offering plenty of room to spread out, enjoy the outdoors, and make the space your own. With a full basement, you’ll have endless possibilities for storage, hobbies, or future expansion. Whether you're looking for a property with potential or a place to bring your vision to life, this home delivers the space, setting, and location to make it happen. Don’t miss your chance to turn this Louisville gem into something truly special! This is an ONLINE ONLY foreclosure sale. There are NO SHOWINGS. Deposit due by wire transfer within 48 upon conclusion. Funding must take place within 30 days of confirmation of sale. 5% Buyer’s Premium shall apply. Subject to postponement and cancellation. Full terms and conditions at online registration.
Key facts
- 0.74 acre lot
- 3 garage spots
- Built 1927
Neighborhood map
What this means for you Summary
Snapshot
- This is a 3-bed/2.0-bath single-family listed at $160k.
Deal economics
- At list price, monthly cash flow is $52 ($626/yr) — positive.
- The deal already cash-flows at list — no discount required.
- To meet the 1% rule (rent ≥ 1% of price), the offer needs to be $158k (1.2% below list).
- Recommended offer: $141k (12.0% below list) — sets the bar for market timing.
- Cap rate 6.7% vs local median 3.4% in Louisville — top-decile yield for the area; either an underpriced asset or a hidden risk that comps aren't pricing in. Stress-test before assuming the spread holds.
Location & tenants
- Location reads 79/100 on livability (#142 in OH, #2,205 nationally) — a middle-class / working-renter tenant base. Strengths: crime A+, cost of living A+, housing A+; Watch: amenities F, commute F.
- Louisville City (suburban): math 67% / reading 70% proficiency, ranked #162 of 656 in OH (top 25%) — acceptable for families but not a draw, mixed tenant base, ~2y average lease.
- Market conditions: Rents rising fast (+5.6%/yr); 88 active listings in the ZIP; 1 comparable units currently listed for rent nearby; solid renter incomes; 528 units permitted in Stark County in 2024 (84 in 5+ unit buildings).
Forward outlook
- Local home prices are declining (-3.0%/yr); year-one equity from $1k of loan paydown is wiped out by about $5k of value loss. Plan a longer hold.
- Stark County population projected to shrink 8% by 2050 — rents likely to lag national; underwrite the cash flow, not the appreciation.
Negotiation context
- It's been on market 183 days — a 12% lower offer ($141k) is reasonable based on typical stale-listing flexibility.
- 9 sale attempts since 25y ago with the ask held roughly flat each time — persistent listings suggest the price (not the market) is what's stuck; bring a comps-based counter.
Risks & watch-outs
- Watch-outs: built in 1927 — expect roof / HVAC / electrical / plumbing capex.
Questions for the listing agent
- It's been on market 183 days. Have you received any prior offers? Is the seller open to a 12% concession, seller financing, or rate buy-down credit?
- Built in 1927 — when were the roof, HVAC, electrical panel, plumbing, and water heater last replaced?
- Why hasn't it sold? Are there any deal-killer items the seller is aware of (foundation, flood, title, zoning, code violations)?
- Is there a deadline driving the sale (1031 exchange, divorce, estate, relocation)? That informs how much negotiation room exists.
- Schools are A-rated — typically a magnet for longer-tenancy family renters. What's the average tenant stay here, and is there a school-zone premium baked into asking?
- What's the average days-on-market for RENTAL listings here right now (not sales)? A rising rental-DOM trend means longer vacancies and softer asking-rent achievability than the comps imply.
- What's the recent tenant-quality profile in this submarket — average credit score on applications, eviction rate, late-payment / NSF rate, and stable-employment percentage? A property-management company in the area should have these aggregated.
- How much new for-sale + rental construction is in the pipeline within 1–3 miles? Heavy new supply typically softens prices + rents 12–24 months out; constrained supply supports both.
Investment metrics
- 1% rule
- 0.99% ✗
- Cap rate
- 6.68%
- Cash-on-cash
- 1.40%
- DSCR
- 1.06
- GRM
- 8.4
CMA / ARV
- ARV (median comp)
- $268,359
- List price
- $160,000
- Delta
- -40.38%
- Verdict
- UNDERPRICED
- Comps
- 20 within 1.0 mi
Show comp detail 12 sales within ~0.75 mi
| Address | Dist | Beds/Ba | Sqft | Sold | Price | $/sf | Match |
|---|---|---|---|---|---|---|---|
| 5681 Rosedale St | 0.17mi | 3/1.5 | 1,584 (-1%) | 9mo | $264,900 | $167 | 80 |
| 5289 Oakridge Dr NE | 0.69mi | 3/2.5 | 1,565 (-3%) | 2mo | $260,000 | $166 | 60 |
| 5109 Columbus Rd NE | 0.62mi | 3/2.0 | 1,665 (+4%) | 7mo | $279,900 | $168 | 59 |
| 5125 Glenoak Dr NE | 0.66mi | 3/3.0 | 1,567 (-2%) | 4mo | $295,000 | $188 | 58 |
| 6030 Holderman Ave | 0.45mi | 3/2.0 | 1,810 (+13%) | 7mo | $292,000 | $161 | 52 |
| 2307 Wittenburg St | 0.56mi | 3/2.5 | 1,801 (+12%) | 2mo | $285,900 | $159 | 50 |
| 5470 Alcorn Ave | 0.47mi | 4/3.0 (+1) | 1,783 (+11%) | 5mo | $343,000 | $192 | 46 |
| 6170 Reno Dr | 0.46mi | 3/2.0 | 1,440 (-10%) | 21mo | $251,000 | $174 | 44 |
| 1687 Malone St | 0.74mi | 3/2.0 | 1,752 (+9%) | 11mo | $230,000 | $131 | 41 |
| 2040 Walsh St | 0.69mi | 4/2.0 (+1) | 1,512 (-6%) | 16mo | $239,900 | $159 | 40 |
| 1821 Hiram St | 0.69mi | 4/2.5 (+1) | 1,824 (+14%) | 1mo | $222,500 | $122 | 38 |
| 6259 Columbus Rd NE | 0.72mi | 3/1.5 | 1,394 (-13%) | 19mo | $300,000 | $215 | 27 |
Match score weights: distance 35% · size 25% · config 20% · recency 20%. Top-matched comps best support the ARV.
Projected returns pro-forma
-3.0% appreciation · 5.57% rent growth · sell at horizon
- IRR
- -11.0%
- Equity multiple
- 0.59×
- Total profit
- $-18,330
- Equity at exit
- $23,857
- IRR
- 1.9%
- Equity multiple
- 1.15×
- Total profit
- $6,779
- Equity at exit
- $13,834
Cash invested: $44,800 (down + closing). Projections, not guarantees.
Landlord ↔ Tenant lean methodology
- Overall (STATE)
- 73 Landlord-Friendly
- State Ohio
- 73 Landlord-Friendly · R+6
- County
- — inherits STATE
- City
- — inherits STATE
ZIP-level market 44641
- Rents YoY
- 5.6%
- Active inventory
- 88
- Price-to-rent
- 8.4×
Monthly cashflow live
- Estimated rent
- $1,581 medium interval (Pro) →
- Mortgage (P&I)
- −$839
- Tax from tax record
- −$291 /mo · $3,492/yr
- Insurance
- −$67
- HOA
- −$0
- Vacancy / Maint / Mgmt
- −$332
- Net cashflow
- $52
Break-even live
UW: 25.0% down · 7.5% · 30yr · 1.5% tax · 5.0% vac · 8.0% maint · 8.0% mgmt
Financing live
Cash to close
- Down payment
- $40,000
- Closing costs
- $4,800
- Reserves months
- —
- Total cash needed
- —
Loan-product check · same deal, 3 products live
Conventional
25% down · 7.5% · 30yr
- Down + closing
- —
- Monthly P&I
- —
- Monthly cashflow
- —
- DSCR
- —
- Eligible?
- —
Personal DTI + credit; lowest rate.
DSCR
20% down · 8.5% · 30yr
- Down + closing
- —
- Monthly P&I
- —
- Monthly cashflow
- —
- DSCR
- —
- Eligible?
- —
No personal income docs; deal must DSCR.
Hard money
10% down · 12.0% · 12mo
- Down + closing
- —
- Monthly P&I
- —
- Monthly cashflow
- —
- DSCR
- —
- Eligible?
- —
Short-term bridge; refi at stabilization.
Rent comps 1 comps
| Address | Beds | Baths | Sqft | Rent | $/sqft | DOM | Units | Dist |
|---|---|---|---|---|---|---|---|---|
| 2158 Kenyon St Unit B Louisville, OH | 2.0 | 1.5 | 1400 | $1,495 | $1.07 | 13d | 1 | 0.57mi |
Listing history 42 events
-
2026-06-18days on market $160,000 Active 183 DOM
-
2026-06-17days on market $160,000 Active 182 DOM
-
2026-06-16days on market $160,000 Active 181 DOM
-
2026-06-13days on market $160,000 Active 180 DOM
-
2026-06-10days on market $160,000 Active 178 DOM
-
2026-06-09days on market $160,000 Active 177 DOM
-
2026-06-08days on market $160,000 Active 176 DOM
-
2026-06-07days on market $160,000 Active 175 DOM
-
2026-06-05days on market $160,000 Active 172 DOM
-
2026-06-02days on market $160,000 Active 170 DOM
-
2026-06-01days on market $160,000 Active 169 DOM
-
2026-05-31days on market $160,000 Active 168 DOM
-
2026-05-30days on market $160,000 Active 167 DOM
-
2025-12-12$160,000 Active 881-char remark
Show marketing remark (881 chars)
Welcome to a fantastic opportunity in Louisville, OH! This 3-bedroom, 2-bathroom home sits on a generous . 74-acre lot, offering plenty of room to spread out, enjoy the outdoors, and make the space your own. With a full basement, you’ll have endless possibilities for storage, hobbies, or future expansion. Whether you're looking for a property with potential or a place to bring your vision to life, this home delivers the space, setting, and location to make it happen. Don’t miss your chance to turn this Louisville gem into something truly special! This is an ONLINE ONLY foreclosure sale. There are NO SHOWINGS. Deposit due by wire transfer within 48 upon conclusion. Funding must take place within 30 days of confirmation of sale. 5% Buyer’s Premium shall apply. Subject to postponement and cancellation. Full terms and conditions at online registration.
-
2025-01-27price $129,900
-
2020-11-04price $129,900
-
2020-08-25price $129,900
-
2015-11-06soldstatus $157,000 Sold
-
2015-05-04status Pending
-
2015-03-04$165,700 Active
-
2014-02-12price $129,900
-
2014-02-12price $129,900
-
2012-06-28soldstatus $50,200
-
2012-05-27historical
-
2012-02-27$42,000
-
2010-08-31historical
-
2010-02-01$129,900
-
2005-12-18historical
-
2005-12-18historical
-
2005-05-28historical
-
2005-04-18historical
-
2005-03-20$144,900
-
2005-03-20$34,900
-
2004-10-20$150,000
-
2003-11-28$35,000
-
2001-04-24$136,900
-
1999-02-18price $136,900
-
1999-02-18price $136,900
-
1999-02-18price $136,900
-
1999-02-18price $136,900
-
1999-02-17soldstatus $120,000
-
1992-01-31soldstatus $43,000
ⓘ Source: listings_history table (triggers on properties + properties_extension) + one-shot
backfill from property_details.listing_events for pre-trigger history.
Tax reassessment forecast OH · Partial reset (capped growth)
- Current annual tax
- $3,492 · $291/mo
- Projected year-2 tax
- $3,492 · $291/mo
- Expected delta
- $0/yr ($0/mo · 0.0%)
ⓘ Screening estimate from a state-policy table — verify with the county assessor before closing.
Climate risk First Street
- Flood 1/10 Low FEMA zone X (unshaded) · 0% chance over 30 yrs
- Wildfire 1/10 Low
- Heat 3/10 Moderate 7 d/yr ≥96°F today · 16 d/yr by 30 yrs out
- Wind 1/10 Low
- Air quality 2/10 Low 1 unhealthy d/yr today · 2 by 30 yrs out
Nearby sold comps map
Loading sold comps map…
Walkable amenities ~0.75 mi
Loading nearby amenities…
Taxation est. · year 1
- Rental income
- $18,971
- − Mortgage interest
- −$8,962
- − Property taxes
- −$3,492
- − Insurance
- −$800
- − Repairs & maintenance
- −$1,518
- − Management
- −$1,518
- − Depreciation
- −$4,655
- Taxable loss
- −$1,974
- Est. tax savings @ 24.0%
- +$474
- After-tax cash flow
- $1,100/yr
For passive investors: Depreciation is non-cash, so a rental often shows a tax loss while cash-flowing — sheltering income. Rental losses are passive: they offset passive income freely, and up to $25,000/yr can offset ordinary (W-2) income if you actively participate and your MAGI is under $100k (phasing out to $0 by $150k); unused losses carry forward. On sale, claimed depreciation is recaptured at up to 25%, and gains may owe capital-gains tax (a 1031 exchange can defer both). Figures are a year-1 estimate at your 24.0% rate — not tax advice; consult a CPA.
Schools (NCES district)
- District
- Louisville City
- NCES district ID
- 3904987
- Math proficiency
- 67% ▼ -11.00%
- Reading proficiency
- 70% ▼ -4.00%
- Median HH income
- $54,455
- Composite
- 58.54/100
- National rank
- #992
- State rank
- #162 of 656 in OH
Livability — Louisville
- Score
- 79/100
- State rank
- #142
- US rank
- #2205
Category grades
Schools grade is shown separately in the Schools card above.
Census & demographics
- County
- Stark County · 272,865 people
- City population
- 20,031
- Metro
- Canton-Massillon, OH
- Population (ZIP)
- 20,031
- Household income
- $80,303
- Rent vs Own
- Severe rent burden
- 344.0
Population outlook (Stark County) Hauer SSP2
- Today (2025)
- 373,708 people
- By 2030
- 371,245 · -0.7%
- By 2040
- 361,331 · -3.3%
- By 2050
- 345,290 · -7.6%
- By 2075
- 302,669 · -19.0%
- By 2100
- 238,870 · -36.1%
Race, ethnicity, and origin ACS 2023
- Neighborhood character
- Predominantly White (95%)
- Race & ethnicity
- White 95% Two or more races 2% Hispanic / Latino 1% Black 1%
- Common ancestry
- Italian 6% Lithuanian 5% Romanian 2%
- Foreign-born
- 1% · Canada
- Languages at home
- 98% English-only · German/W. Germanic 1%
Political lean MEDSL · Stark
- 2024 margin
- Strong R (+21.9) · D 38.6% · R 60.5%
- 2008→2024 swing
- -27.4pp toward R · 2008: 5.5pp · 2024: -21.9pp
- All cycles
- 2024: R+21.9 2020: R+18.5 2016: R+17.4 2012: R+0.4 2008: D+5.5
Not yet ingested
- Civics
- —
Market trends
- HPI YoY
- ▼ -203.38%
- Current HPI
- 214.6849
- Rent YoY
- ▲ 5.57%
- Metro
- Canton-Massillon, OH
- State GDP YoY
- ▲ 1.98%
- F500 in state
- 48
Industry mix (Fortune 500 HQ in OH)
| Industry | F500 HQs | Revenue |
|---|---|---|
| Insurance | 3 | $145B |
|
||
| Industrial Machinery | 3 | $49B |
|
||
| Financial Services | 3 | $24B |
|
||
| Consumer Goods | 2 | $93B |
|
||
| Aerospace / Defense | 2 | $47B |
|
||
| Utilities | 2 | $33B |
|
||
Price history
+272.1% since first listed29 events — show timeline
- 2025-12-12 Listed $160,000 MLSNOW
- 2025-01-27 Price Changed $129,900 MLSNOW
- 2020-11-04 Price Changed $129,900 MLSNOW
- 2020-08-25 Price Changed $129,900 MLSNOW
- 2015-11-06 Sold (MLS) $157,000 MLSNOW
- 2015-05-04 Pending — MLSNOW
- 2015-03-04 Listed $165,700 MLSNOW
- 2014-02-12 Price Changed $129,900 MLSNOW
- 2014-02-12 Price Changed $129,900 MLSNOW
- 2012-06-28 Sold (MLS) $50,200 MLSNOW
- 2012-05-27 Listing Removed — MLSNOW
- 2012-02-27 Listed $42,000 MLSNOW
- 2010-08-31 Listing Removed — MLSNOW
- 2010-02-01 Listed $129,900 MLSNOW
- 2005-12-18 Listing Removed — MLSNOW
- 2005-12-18 Listing Removed — MLSNOW
- 2005-05-28 Listing Removed — MLSNOW
- 2005-04-18 Listing Removed — MLSNOW
- 2005-03-20 Listed $34,900 MLSNOW
- 2005-03-20 Listed $144,900 MLSNOW
- 2004-10-20 Listed $150,000 MLSNOW
- 2003-11-28 Listed $35,000 MLSNOW
- 2001-04-24 Listed $136,900 MLSNOW
- 1999-02-18 Price Changed $136,900 MLSNOW
- 1999-02-18 Price Changed $136,900 MLSNOW
- 1999-02-18 Price Changed $136,900 MLSNOW
- 1999-02-18 Price Changed $136,900 MLSNOW
- 1999-02-17 Sold (Public Records) $120,000 Public Records
- 1992-01-31 Sold (Public Records) $43,000 Public Records
Property tax history
+5.4%/yrLatest (2024): $3,492 · +35.1% YoY. Source: county tax records.
Cash-flow waterfall
monthlySold comps — $/sqft
last 12 mo · ≤1 miLoading sold comps…