 🏷️ Likely Rental
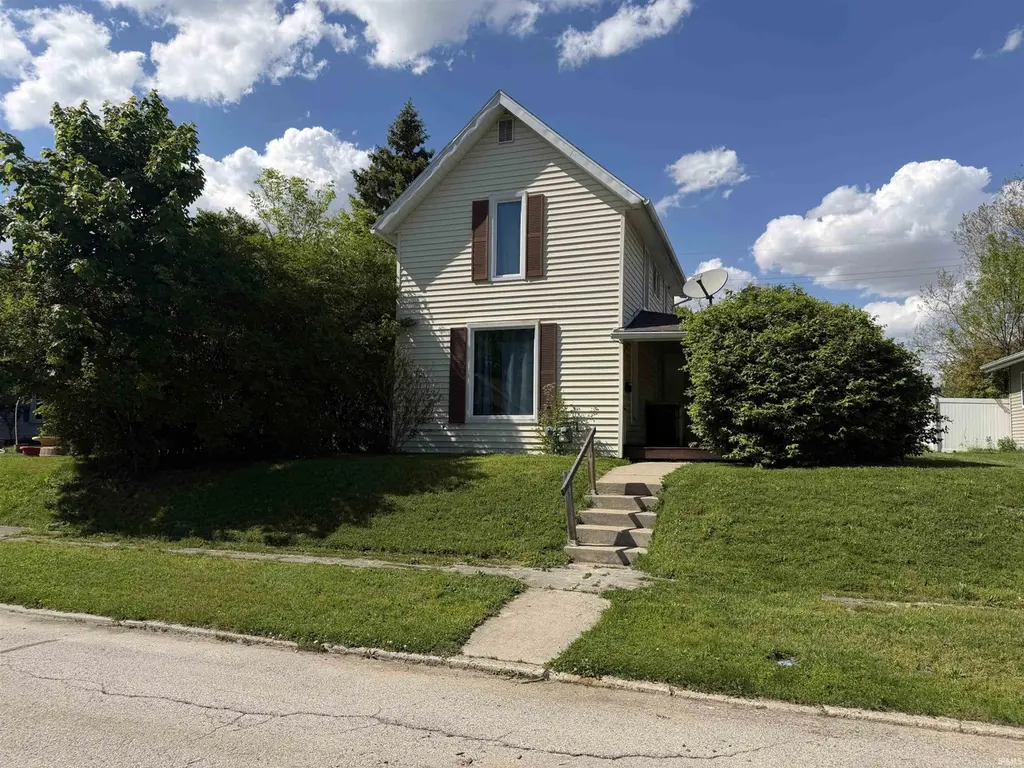
304 Wright St · Huntington, IN
Flood risk 1/10 · Minimal
- FEMA flood zone
- X (unshaded)
- Chance of flooding over 30 yrs
- 0.0%
- Est. flood insurance / yr
- $507 – $1,088
Fire risk 1/10 · Minimal
- Est. fire insurance / yr
- $717 – $1,331
Heat risk 3/10 · Minor
- Hot days now (above 101°F)
- 7 days/yr
- Hot days in 30 yrs
- 18 days/yr
Wind risk 2/10 · Minimal
- Chance of severe wind over 30 yrs
- —
Air-quality risk 3/10 · Minor
- Unhealthy air days now
- 1 days/yr
- Unhealthy air days in 30 yrs
- 3 days/yr
Risk factors via First Street. Map © Google.
Why this score? — see what drove the B grade
The composite is a weighted blend of 9 inputs, each scored 0–100. Each bar is that input's sub-score; the figure is the points it added to the 100-point composite (weight × sub-score).
- Cash flow +30.0/30.0
- ARV discount +15.0/15.0
- DSCR +10.0/10.0
- 1% rule +8.0/10.0
- Livability +3.5/5.0
- Schools +3.1/10.0
- Rent growth +2.5/5.0
- Condition / age +2.5/5.0
- Appreciation +0.0/10.0
$79,900
🖨 Deal sheet (PDF) 📄 Offer letter ✓ Due diligence
Listing remarks MLS
Own your home or be your own boss! This 2 bedroom, 1 bathroom home contains 1,080sqft and rents for $554.50/mo. plus utilities. This rental property is available for purchase as an individual unit for $38,500, or part of a 6-property package for $231,000. Additional properties in Huntington include: 1322 Ogan Ave, 538 Byron St, 835 Wilkerson St, 954 Iowa St, & 958 Iowa St. Subject to tenant's rights with 24 hour showing notice required. (This home is not available for land contract. Please do not disturb the tenant. )
Key facts
- Bedroom suite
- Front covered porch
- Large kitchen
Tags
Property features AI
Finance
- Other: Public maintained asphalt road; Lot described as sloped and level, approximately 120 x 50 (0.14 acre)
- Financial info: No investor/multifamily income or expense details provided
- HOA & community: Sidewalks
Exterior
- Parking: Detached garage; One garage space; No additional parking features listed
- Utilities: Public water; Public sewer
- Home design: Single-story single family residence (site-built); R2 zoning; Subdivision: Wright(s)
- Construction: Vinyl siding; Asphalt roof; Built with crawl space foundation
- Exterior features: Covered porch; Porch
Interior
- Kitchen: Electric water heater
- Bedrooms: Master downstairs
- Flooring: Carpet; Vinyl
- Bathrooms: Two full bathrooms; One main-level bathroom
- Heating & cooling: Electric baseboard heating; No cooling
- Interior features: Entrance foyer; Master bedroom on the main floor; Crawl space basement
- Laundry & utility: Main-level laundry with electric dryer hookup; Water heater
Neighborhood map
What this means for you Summary
Snapshot
- This is a 2-bed/1.0-bath single-family listed at $80k.
Deal economics
- At list price, monthly cash flow is $299 ($4k/yr) — positive.
- The deal already cash-flows at list — no discount required.
- Meets the 1% rule at list price ($1k rent vs $80k).
- Recommended offer: $78k (3.0% below list) — sets the bar for market timing.
- Cap rate 10.8% vs local median 4.3% in Huntington — top-decile yield for the area; either an underpriced asset or a hidden risk that comps aren't pricing in. Stress-test before assuming the spread holds.
Location & tenants
- Location reads 69/100 on livability (#193 in IN) — a middle-class / working-renter tenant base. Strengths: crime A+, cost of living A+, housing A+; Watch: health & safety C-, employment D, amenities F.
- Huntington County Community School Corporation (rural): math 34% / reading 39% proficiency, ranked #176 of 301 in IN (top 58%) — families likely to look elsewhere, expect single-tenant / working-renter base with shorter leases.
- Zoned schools: Horace Mann Elementary (math 38% / reading 29%, grade F, #631 of 994 statewide, top 64%, 458 students, 68% FRL); Riverview School (math 29% / reading 40%, grade F, #167 of 330 statewide, top 52%, 503 students, 54% FRL); Huntington North High School (math 30% / reading 55%, grade F, #195 of 369 statewide, top 53%, 1,424 students, 42% FRL) — zoned schools average 54% FRL vs 37% district-wide (17 pts higher); higher-poverty schools than district average — tighter screening recommended.
- Market conditions: 112 active listings in the ZIP; 79 units permitted in Huntington County in 2024 (0 in 5+ unit buildings).
Forward outlook
- Local home prices are declining (-3.0%/yr); year-one equity from $552 of loan paydown is wiped out by about $2k of value loss. Plan a longer hold.
- Huntington County population projected at -14% by 2050 — secular population decline; favor cash flow + early exit over multi-decade hold.
- At projected returns (-3.0% appreciation + 3.0% rent growth), your $22k cash investment doubles in ~8 years — after that, you're playing with house money.
Negotiation context
- It's been on market 37 days — a 3% lower offer ($78k) is reasonable based on typical stale-listing flexibility.
- 4 sale attempts since 7y ago; this cycle's ask has dropped $10k (11%) from the opening price — seller is motivated, your offer sets the floor, not the list.
- Current owner paid $37k; list at $80k implies a 116% gain — meaningful room to come down on a strong offer.
Risks & watch-outs
- Watch-outs: built in 1900 — expect roof / HVAC / electrical / plumbing capex.
Questions for the listing agent
- It's been on market 37 days. Have you received any prior offers? Is the seller open to a 3% concession, seller financing, or rate buy-down credit?
- Built in 1900 — when were the roof, HVAC, electrical panel, plumbing, and water heater last replaced?
- Is there a deadline driving the sale (1031 exchange, divorce, estate, relocation)? That informs how much negotiation room exists.
- Schools are D-rated, which usually means shorter tenancies and higher turnover. Who's the typical renter profile here, and what's been the actual vacancy rate?
- What's the average days-on-market for RENTAL listings here right now (not sales)? A rising rental-DOM trend means longer vacancies and softer asking-rent achievability than the comps imply.
- What's the recent tenant-quality profile in this submarket — average credit score on applications, eviction rate, late-payment / NSF rate, and stable-employment percentage? A property-management company in the area should have these aggregated.
- How much new for-sale + rental construction is in the pipeline within 1–3 miles? Heavy new supply typically softens prices + rents 12–24 months out; constrained supply supports both.
Investment metrics
- 1% rule
- 1.30% ✓
- Cap rate
- 10.79%
- Cash-on-cash
- 16.05%
- DSCR
- 1.71
- GRM
- 6.4
CMA / ARV
- ARV (on-the-fly)
- $138,240
- Comps found
- 12
Show comp detail 12 sales within ~0.75 mi
| Address | Dist | Beds/Ba | Sqft | Sold | Price | $/sf | Match |
|---|---|---|---|---|---|---|---|
| 1071 Henry St | 0.14mi | 2/1.0 | 1,002 (-7%) | 2mo | $145,000 | $145 | 80 |
| 458 Whitelock St | 0.28mi | 3/1.0 (+1) | 1,128 (+4%) | 1mo | $85,000 | $75 | 74 |
| 637 Mayne St | 0.24mi | 2/1.0 | 1,168 (+8%) | 4mo | $81,000 | $69 | 72 |
| 534 Mayne St | 0.22mi | 3/2.0 (+1) | 1,033 (-4%) | 4mo | $171,000 | $166 | 70 |
| 516 Webster St | 0.59mi | 2/1.0 | 1,180 (+9%) | 1mo | $59,000 | $50 | 56 |
| 29 E Sunnydale Dr | 0.61mi | 3/1.0 (+1) | 1,152 (+7%) | 2mo | $170,000 | $148 | 53 |
| 1333 Gardendale Ave | 0.61mi | 2/1.0 | 936 (-13%) | 2mo | $120,000 | $128 | 48 |
| 1414 Gardendale Ave | 0.63mi | 2/1.0 | 949 (-12%) | 5mo | $50,000 | $53 | 47 |
| 419 2nd St | 0.70mi | 3/1.0 (+1) | 1,166 (+8%) | 3mo | $106,500 | $91 | 47 |
| 18 Shamrock Ct | 0.67mi | 3/1.0 (+1) | 975 (-10%) | 6mo | $169,000 | $173 | 43 |
| 821 Frederick St | 0.75mi | 3/1.0 (+1) | 1,221 (+13%) | 4mo | $130,000 | $106 | 35 |
| 660 Clark St | 0.75mi | 3/1.0 (+1) | 922 (-15%) | 1mo | $164,995 | $179 | 35 |
Match score weights: distance 35% · size 25% · config 20% · recency 20%. Top-matched comps best support the ARV.
Projected returns pro-forma
-3.0% appreciation · 3.0% rent growth · sell at horizon
- IRR
- 7.0%
- Equity multiple
- 1.27×
- Total profit
- $6,100
- Equity at exit
- $11,913
- IRR
- 16.3%
- Equity multiple
- 2.33×
- Total profit
- $29,825
- Equity at exit
- $6,908
Cash invested: $22,372 (down + closing). Projections, not guarantees.
Landlord ↔ Tenant lean methodology
- Overall (STATE)
- 90 Strongly Landlord-Friendly
- State Indiana
- 90 Strongly Landlord-Friendly · R+11
- County
- — inherits STATE
- City
- — inherits STATE
ZIP-level market 46750
- Home prices YoY
- -33.0%
- Active inventory
- 112
- Price-to-rent
- 6.4×
Monthly cashflow live
- Estimated rent
- $1,036 medium interval (Pro) →
- Mortgage (P&I)
- −$419
- Tax from tax record
- −$67 /mo · $803/yr
- Insurance
- −$33
- HOA
- −$0
- Vacancy / Maint / Mgmt
- −$218
- Net cashflow
- $299
Break-even live
Sensitivity live
| Price | -10% $344 | -5% $322 | +0% $299 | +5% $277 | +10% $254 |
|---|---|---|---|---|---|
| Rent | -10% $217 | -5% $258 | +0% $299 | +5% $340 | +10% $381 |
| Rate | -1.0pp $339 | -0.5pp $319 | base $299 | +0.5pp $278 | +1.0pp $257 |
UW: 25.0% down · 7.5% · 30yr · 1.5% tax · 5.0% vac · 8.0% maint · 8.0% mgmt
Financing live
Cash to close
- Down payment
- $19,975
- Closing costs
- $2,397
- Reserves months
- —
- Total cash needed
- —
Loan-product check · same deal, 3 products live
Conventional
25% down · 7.5% · 30yr
- Down + closing
- —
- Monthly P&I
- —
- Monthly cashflow
- —
- DSCR
- —
- Eligible?
- —
Personal DTI + credit; lowest rate.
DSCR
20% down · 8.5% · 30yr
- Down + closing
- —
- Monthly P&I
- —
- Monthly cashflow
- —
- DSCR
- —
- Eligible?
- —
No personal income docs; deal must DSCR.
Hard money
10% down · 12.0% · 12mo
- Down + closing
- —
- Monthly P&I
- —
- Monthly cashflow
- —
- DSCR
- —
- Eligible?
- —
Short-term bridge; refi at stabilization.
Listing history 23 events
-
2026-06-19days on market $79,900 Active 37 DOM
-
2026-06-18days on market $79,900 Active 36 DOM
-
2026-06-17days on market $79,900 Active 35 DOM
-
2026-06-16days on market $79,900 Active 34 DOM
-
2026-06-15days on market $79,900 Active 33 DOM
-
2026-06-14days on market $79,900 Active 31 DOM
-
2026-06-12days on market $79,900 Active 30 DOM
-
2026-06-09days on market $79,900 Active 27 DOM
-
2026-06-08days on market $79,900 Active 26 DOM
-
2026-06-07days on market $79,900 Active 25 DOM
-
2026-06-05days on market $79,900 Active 22 DOM
-
2026-06-03days on market $79,900 Active 21 DOM
-
2026-06-02days on market $79,900 Active 20 DOM
-
2026-06-01pricedays on market $79,900 Active 19 DOM
-
2026-05-31days on market $84,900 Active 18 DOM
-
2026-05-30days on market $84,900 Active 17 DOM
-
2026-05-19price $84,900
-
2026-05-13$89,900 Active
-
2020-10-05soldstatus $37,000 531-char remark
Show marketing remark (531 chars)
Own your home or be your own boss! This 2 bedroom, 1 bathroom home contains 1,080sqft and rents for $554.50/mo. plus utilities. This rental property is available for purchase as an individual unit for $38,500, or part of a 6-property package for $231,000. Additional properties in Huntington include: 1322 Ogan Ave, 538 Byron St, 835 Wilkerson St, 954 Iowa St, & 958 Iowa St. Subject to tenant's rights with 24 hour showing notice required. (This home is not available for land contract. Please do not disturb the tenant. )
-
2020-01-18$37,000 531-char remark
Show marketing remark (531 chars)
Own your home or be your own boss! This 2 bedroom, 1 bathroom home contains 1,080sqft and rents for $554.50/mo. plus utilities. This rental property is available for purchase as an individual unit for $38,500, or part of a 6-property package for $231,000. Additional properties in Huntington include: 1322 Ogan Ave, 538 Byron St, 835 Wilkerson St, 954 Iowa St, & 958 Iowa St. Subject to tenant's rights with 24 hour showing notice required. (This home is not available for land contract. Please do not disturb the tenant. )
-
2019-09-11$41,900
-
2019-05-06$42,000
-
2011-08-17soldstatus $60,688
ⓘ Source: listings_history table (triggers on properties + properties_extension) + one-shot
backfill from property_details.listing_events for pre-trigger history.
Tax reassessment forecast IN · Partial reset (capped growth)
- Current annual tax
- $803 · $67/mo
- Projected year-2 tax
- $803 · $67/mo
- Expected delta
- $0/yr ($0/mo · 0.0%)
ⓘ Screening estimate from a state-policy table — verify with the county assessor before closing.
Climate risk First Street
- Flood 1/10 Low FEMA zone X (unshaded) · 0% chance over 30 yrs
- Wildfire 1/10 Low
- Heat 3/10 Moderate 7 d/yr ≥101°F today · 18 d/yr by 30 yrs out
- Wind 2/10 Low
- Air quality 3/10 Moderate 1 unhealthy d/yr today · 3 by 30 yrs out
Nearby sold comps map
Loading sold comps map…
Walkable amenities ~0.75 mi
Loading nearby amenities…
Taxation est. · year 1
- Rental income
- $12,431
- − Mortgage interest
- −$4,476
- − Property taxes
- −$803
- − Insurance
- −$400
- − Repairs & maintenance
- −$994
- − Management
- −$994
- − Depreciation
- −$2,324
- Taxable income
- $2,439
- Est. tax owed @ 24.0%
- −$585
- After-tax cash flow
- $3,004/yr
For passive investors: Depreciation is non-cash, so a rental often shows a tax loss while cash-flowing — sheltering income. Rental losses are passive: they offset passive income freely, and up to $25,000/yr can offset ordinary (W-2) income if you actively participate and your MAGI is under $100k (phasing out to $0 by $150k); unused losses carry forward. On sale, claimed depreciation is recaptured at up to 25%, and gains may owe capital-gains tax (a 1031 exchange can defer both). Figures are a year-1 estimate at your 24.0% rate — not tax advice; consult a CPA.
Schools (NCES district)
- District
- Huntington County Community School Corporation
- NCES district ID
- 1804710
- Math proficiency
- 34% ▼ -6.00%
- Reading proficiency
- 39% ▼ -10.00%
- Median HH income
- $47,010
- Composite
- 31.29/100
- National rank
- #6013
- State rank
- #176 of 301 in IN
Livability — Huntington
- Score
- 69/100
- State rank
- #193
- US rank
- #8771
Category grades
Schools grade is shown separately in the Schools card above.
Census & demographics
- Census place
- Huntington, IN
- City population
- 27,341
- Population (ZIP)
- 27,341
Population outlook (Huntington County) Hauer SSP2
- Today (2025)
- 35,613 people
- By 2030
- 34,759 · -2.4%
- By 2040
- 32,682 · -8.2%
- By 2050
- 30,495 · -14.4%
- By 2075
- 26,298 · -26.2%
- By 2100
- 22,653 · -36.4%
Race, ethnicity, and origin ACS 2023
- Neighborhood character
- Predominantly White (93%)
- Race & ethnicity
- White 93% Hispanic / Latino 3% Two or more races 2% Black 1%
- Common ancestry
- Italian 2% Slovak 2% Romanian 2%
- Foreign-born
- 2% · China, Canada
- Languages at home
- 96% English-only · Spanish 2% Chinese 1% German/W. Germanic 1%
Political lean MEDSL · Huntington
- 2024 margin
- Solid R (+48.4) · D 24.9% · R 73.3% · Other 1.8%
- 2008→2024 swing
- -21.2pp toward R · 2008: -27.2pp · 2024: -48.4pp
- All cycles
- 2024: R+48.4 2020: R+49.9 2016: R+51.0 2012: R+39.8 2008: R+27.2
Not yet ingested
- Civics
- —
Market trends
- HPI YoY
- ▼ -106.89%
- Current HPI
- 216.5969
- Rent YoY
- —
- Metro
- —
- State GDP YoY
- ▲ 2.90%
- F500 in state
- 18
Industry mix (Fortune 500 HQ in IN)
| Industry | F500 HQs | Revenue |
|---|---|---|
| Industrial Machinery | 2 | $37B |
|
||
| Healthcare | 1 | $177B |
|
||
| Pharmaceuticals | 1 | $45B |
|
||
| Metals / Steel | 1 | $18B |
|
||
| Agriculture | 1 | $17B |
|
||
| Packaging | 1 | $12B |
|
||
Price history
+39.9% since first listed7 events — show timeline
- 2026-05-19 Price Changed $84,900 IRMLS
- 2026-05-13 Listed $89,900 IRMLS
- 2020-10-05 Sold (MLS) $37,000 IRMLS
- 2020-01-18 Listed $37,000 IRMLS
- 2019-09-11 Listed $41,900 IRMLS
- 2019-05-06 Listed $42,000 IRMLS
- 2011-08-17 Sold (Public Records) $60,688 Public Records
Property tax history
-4.4%/yrLatest (2024): $803 · +0.2% YoY. Source: county tax records.
Cash-flow waterfall
monthlySold comps — $/sqft
last 12 mo · ≤1 miLoading sold comps…