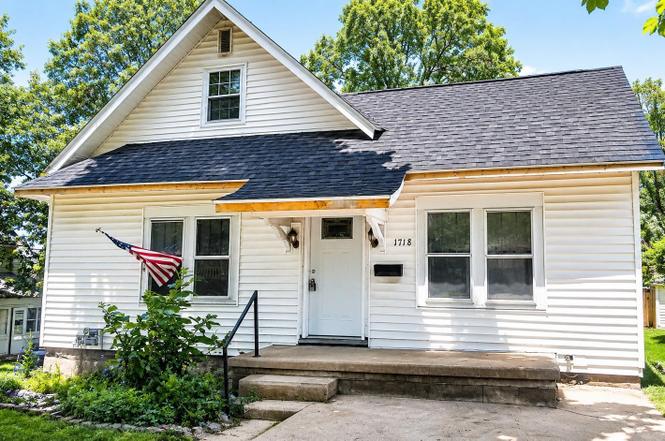
1718 Rainey St · Lafayette, IN
Flood risk 1/10 · Minimal
- FEMA flood zone
- X (unshaded)
- Chance of flooding over 30 yrs
- 0.0%
- Est. flood insurance / yr
- $473 – $860
Fire risk 1/10 · Minimal
- Est. fire insurance / yr
- $717 – $1,331
Heat risk 3/10 · Minor
- Hot days now (above 102°F)
- 7 days/yr
- Hot days in 30 yrs
- 18 days/yr
Wind risk 2/10 · Minimal
- Chance of severe wind over 30 yrs
- —
Air-quality risk 2/10 · Minimal
- Unhealthy air days now
- 1 days/yr
- Unhealthy air days in 30 yrs
- 2 days/yr
Risk factors via First Street. Map © Google.
Why this score? — see what drove the C+ grade
The composite is a weighted blend of 9 inputs, each scored 0–100. Each bar is that input's sub-score; the figure is the points it added to the 100-point composite (weight × sub-score).
- Cash flow +20.3/30.0
- ARV discount +15.0/15.0
- DSCR +6.5/10.0
- 1% rule +5.4/10.0
- Condition / age +4.0/5.0
- Livability +3.7/5.0
- Rent growth +3.2/5.0
- Schools +2.6/10.0
- Appreciation +0.0/10.0
$109,000
🖨 Deal sheet (PDF) 📄 Offer letter ✓ Due diligence
Listing remarks
This charming 3 bedroom, 1 bath home with attached 2 car garage is located just outside downtown Lafayette with convenient access to shopping, restaurants, parks and other various activities. The home was previously used as a rental property and is now looking for a new owner. Whether owner occupied or investor owned this property gives you 716 sq ft of living space to work with. Large, open, living and dining rooms located off first floor bedroom. Stairs take you down to the attached garage and unfinished utility room which could be used for extra storage. Minimal yard space is perfect for someone looking for no yard maintenance while still being able to enjoy outdoor life from the back, o
Key facts
- Open deck
- Attached garage
- 2,004 sq ft lot
Tags
Property features AI
Exterior
- Parking: Attached garage with 1 space; Off-street parking
- Utilities: Public water; Public sewer
- Home design: Single-family site-built home; One story
- Construction: Vinyl siding
- Exterior features: Asphalt shingle roof; Lot approximately 39 x 52 (0.046 acres)
Interior
- Bedrooms: 5 total rooms (bedroom count not specified)
- Flooring: Carpet; Laminate
- Bathrooms: 1 full bathroom (main level)
- Heating & cooling: Forced air heating; No central cooling
- Interior features: Carpet and laminate flooring; Unfinished basement
- Laundry & utility: Laundry located in basement
Neighborhood map
What this means for you Summary
Snapshot
- This is a 3-bed/1.0-bath single-family listed at $109k. Condition is rated good.
Deal economics
- At list price, monthly cash flow is $140 ($2k/yr) — positive.
- The deal already cash-flows at list — no discount required.
- Meets the 1% rule at list price ($1k rent vs $109k).
- Cap rate 7.8% vs local median 4.1% in Lafayette — top-decile yield for the area; either an underpriced asset or a hidden risk that comps aren't pricing in. Stress-test before assuming the spread holds.
Location & tenants
- Location reads 74/100 on livability (#68 in IN, #4,374 nationally) — a middle-class / working-renter tenant base. Strengths: cost of living A+, housing A+, health & safety A+; Watch: amenities D+, employment D+, crime F.
- Lafayette School Corporation (urban): math 29% / reading 34% proficiency, ranked #235 of 301 in IN (top 78%) — families likely to look elsewhere, expect single-tenant / working-renter base with shorter leases; 63% free/reduced lunch — lower-income household profile, screen leases tightly.
- Zoned schools: Murdock Elementary School (math 42% / reading 32%, grade F, #550 of 994 statewide, top 57%, 250 students, 80% FRL); Lafayette Sunnyside Intermediate (math 26% / reading 26%, grade F, #240 of 330 statewide, top 73%, 1,047 students, 77% FRL); Jefferson High School (math 23% / reading 55%, grade F, #235 of 369 statewide, top 65%, 2,118 students, 69% FRL).
- Market conditions: Rents rising (+2.8%/yr); 75 active listings in the ZIP; 15 comparable units currently listed for rent nearby; rentals at typical pace (median 16d on market — plan ~3-4 weeks tenant-placement turnaround); 1,341 units permitted in Tippecanoe County in 2024 (869 in 5+ unit buildings).
Forward outlook
- Local home prices are declining (-3.0%/yr); year-one equity from $754 of loan paydown is wiped out by about $3k of value loss. Plan a longer hold.
- Tippecanoe County population projected at +41% by 2050 — long-run rental-demand tailwind backs the buy-and-hold thesis.
Negotiation context
- Only 2 days on market — expect competitive offers; lowballing is unlikely to land.
Risks & watch-outs
- Watch-outs: built in 1870 — expect roof / HVAC / electrical / plumbing capex.
Questions for the listing agent
- Built in 1870 — when were the roof, HVAC, electrical panel, plumbing, and water heater last replaced?
- Is there a deadline driving the sale (1031 exchange, divorce, estate, relocation)? That informs how much negotiation room exists.
- Schools are D-rated, which usually means shorter tenancies and higher turnover. Who's the typical renter profile here, and what's been the actual vacancy rate?
- Crime grade is F in this area — have there been break-ins, vandalism, or insurance claims at this property in the last 3 years? What carrier currently insures it and at what premium?
- What's the average days-on-market for RENTAL listings here right now (not sales)? A rising rental-DOM trend means longer vacancies and softer asking-rent achievability than the comps imply.
- What's the recent tenant-quality profile in this submarket — average credit score on applications, eviction rate, late-payment / NSF rate, and stable-employment percentage? A property-management company in the area should have these aggregated.
- How much new for-sale + rental construction is in the pipeline within 1–3 miles? Heavy new supply typically softens prices + rents 12–24 months out; constrained supply supports both.
Investment metrics
- 1% rule
- 1.04% ✓
- Cap rate
- 7.84%
- Cash-on-cash
- 5.52%
- DSCR
- 1.25
- GRM
- 8.0
CMA / ARV
- ARV (on-the-fly)
- $138,188
- Comps found
- 5
Show comp detail 5 sales within ~0.75 mi
| Address | Dist | Beds/Ba | Sqft | Sold | Price | $/sf | Match |
|---|---|---|---|---|---|---|---|
| 2216 Roselawn Ave | 0.54mi | 2/1.0 (-1) | 720 (+1%) | 1mo | $135,000 | $188 | 68 |
| 1803 Pierce St | 0.43mi | 2/1.0 (-1) | 672 (-6%) | 2mo | $140,400 | $209 | 63 |
| 607 N 26th St | 0.56mi | 2/1.0 (-1) | 728 (+2%) | 11mo | $161,000 | $221 | 57 |
| 2115 Elmwood Ave | 0.45mi | 2/1.0 (-1) | 672 (-6%) | 23mo | $130,000 | $193 | 44 |
| 2503 Union St | 0.49mi | 2/1.0 (-1) | 820 (+14%) | 20mo | $75,000 | $91 | 32 |
Match score weights: distance 35% · size 25% · config 20% · recency 20%. Top-matched comps best support the ARV.
Projected returns pro-forma
-3.0% appreciation · 2.8% rent growth · sell at horizon
- IRR
- -8.0%
- Equity multiple
- 0.71×
- Total profit
- $-8,934
- Equity at exit
- $16,252
- IRR
- 1.3%
- Equity multiple
- 1.09×
- Total profit
- $2,871
- Equity at exit
- $9,424
Cash invested: $30,520 (down + closing). Projections, not guarantees.
Landlord ↔ Tenant lean methodology
- Overall (STATE)
- 90 Strongly Landlord-Friendly
- State Indiana
- 90 Strongly Landlord-Friendly · R+11
- County
- — inherits STATE
- City
- — inherits STATE
ZIP-level market 47904
- Rents YoY
- 2.8%
- Active inventory
- 75
- Price-to-rent
- 8.0×
Monthly cashflow live
- Estimated rent
- $1,131 high interval (Pro) →
- Mortgage (P&I)
- −$572
- Tax est. 1.5%
- −$136 /mo · $1,635/yr
- Insurance
- −$45
- HOA
- −$0
- Vacancy / Maint / Mgmt
- −$238
- Net cashflow
- $140
Break-even live
Sensitivity live
| Price | -10% $216 | -5% $178 | +0% $140 | +5% $103 | +10% $65 |
|---|---|---|---|---|---|
| Rent | -10% $51 | -5% $96 | +0% $140 | +5% $185 | +10% $230 |
| Rate | -1.0pp $195 | -0.5pp $168 | base $140 | +0.5pp $112 | +1.0pp $83 |
UW: 25.0% down · 7.5% · 30yr · 1.5% tax · 5.0% vac · 8.0% maint · 8.0% mgmt
Financing live
Cash to close
- Down payment
- $27,250
- Closing costs
- $3,270
- Reserves months
- —
- Total cash needed
- —
Loan-product check · same deal, 3 products live
Conventional
25% down · 7.5% · 30yr
- Down + closing
- —
- Monthly P&I
- —
- Monthly cashflow
- —
- DSCR
- —
- Eligible?
- —
Personal DTI + credit; lowest rate.
DSCR
20% down · 8.5% · 30yr
- Down + closing
- —
- Monthly P&I
- —
- Monthly cashflow
- —
- DSCR
- —
- Eligible?
- —
No personal income docs; deal must DSCR.
Hard money
10% down · 12.0% · 12mo
- Down + closing
- —
- Monthly P&I
- —
- Monthly cashflow
- —
- DSCR
- —
- Eligible?
- —
Short-term bridge; refi at stabilization.
Rent comps 15 comps
| Address | Beds | Baths | Sqft | Rent | $/sqft | DOM | Units | Dist |
|---|---|---|---|---|---|---|---|---|
| 802 N 9th St Lafayette, IN | 2.0 | 1.0–2.0 | 902 | $789 | $0.87 | 15d | 1 | 0.50mi |
| 811 Union St Unit 813 Lafayette, IN | 2.0 | 1.0 | 700 | $850 | $1.21 | 23d | 1 | 0.52mi |
| 1739 Main St Unit 7 Lafayette, IN | 3.0 | 1.0 | 750 | $1,300 | $1.73 | 15d | 1 | 0.61mi |
| 1103 N 7th St Unit 4 Lafayette, IN | 2.0 | 1.0 | 750 | $920 | $1.23 | 45d | 1 | 0.65mi |
| 475 South St Lafayette, IN | 1.0–2.0 | 1.0–2.0 | 870 | $2,100 | $2.41 | 15d | 12 | 0.89mi |
| 1714 N 9th St Rd Lafayette, IN | 1.0–3.0 | 1.0–2.0 | 800 | $1,099 | $1.37 | 15d | 1 | 0.92mi |
| 6 S 4th St Lafayette, IN | 1.0–3.0 | 1.0–3.0 | 1102 | $1,649 | $1.50 | 15d | 1 | 0.93mi |
| 216 S 5th St Apt 2 Lafayette, IN | 2.0 | 1.0 | 550 | $829 | $1.51 | 15d | 1 | 0.97mi |
| 2312 1/2 N 19th St Lafayette, IN | 2.0 | 1.0 | 625 | $900 | $1.44 | 23d | 1 | 1.11mi |
| 320 Brown St West Lafayette, IN | 1.0–4.0 | 1.0–2.0 | 835 | $1,399 | $1.68 | 15d | 12 | 1.15mi |
| 400 N River Rd West Lafayette, IN | 3.0 | 1.0–3.0 | 693 | $1,229 | $1.77 | 15d | 42 | 1.21mi |
| 270 Littleton St West Lafayette, IN | 4.0 | 1.0–2.5 | 972 | $1,010 | $1.04 | 23d | 1 | 1.34mi |
| 901 S 4th St Lafayette, IN | 1.0–2.0 | 1.0 | 739 | $1,033 | $1.40 | 15d | 3 | 1.38mi |
| 1200 Happy Hollow Rd West Lafayette, IN | 2.0 | 1.0 | 750 | $834 | $1.11 | 15d | 1 | 1.47mi |
| 1200 Happy Hollow Rd West Lafayette, IN | 2.0 | 1.0 | 750 | $834 | $1.11 | 45d | 1 | 1.47mi |
Listing history 3 events
-
2026-06-22days on market $109,000 Active 2 DOM
-
2026-06-19remarks 699-char remark
-
2026-06-19$109,000 Active 1 DOM
ⓘ Source: listings_history table (triggers on properties + properties_extension) + one-shot
backfill from property_details.listing_events for pre-trigger history.
Climate risk First Street
- Flood 1/10 Low FEMA zone X (unshaded) · 0% chance over 30 yrs
- Wildfire 1/10 Low
- Heat 3/10 Moderate 7 d/yr ≥102°F today · 18 d/yr by 30 yrs out
- Wind 2/10 Low
- Air quality 2/10 Low 1 unhealthy d/yr today · 2 by 30 yrs out
Nearby sold comps map
Loading sold comps map…
Walkable amenities ~0.75 mi
Loading nearby amenities…
Taxation est. · year 1
- Rental income
- $13,574
- − Mortgage interest
- −$6,106
- − Property taxes
- −$1,635
- − Insurance
- −$545
- − Repairs & maintenance
- −$1,086
- − Management
- −$1,086
- − Depreciation
- −$3,171
- Taxable loss
- −$55
- Est. tax savings @ 24.0%
- +$13
- After-tax cash flow
- $1,697/yr
For passive investors: Depreciation is non-cash, so a rental often shows a tax loss while cash-flowing — sheltering income. Rental losses are passive: they offset passive income freely, and up to $25,000/yr can offset ordinary (W-2) income if you actively participate and your MAGI is under $100k (phasing out to $0 by $150k); unused losses carry forward. On sale, claimed depreciation is recaptured at up to 25%, and gains may owe capital-gains tax (a 1031 exchange can defer both). Figures are a year-1 estimate at your 24.0% rate — not tax advice; consult a CPA.
Condition & rehab AI · 14 photos
This charming 3-bedroom, 1-bath home is in good condition with minimal repairs needed. The home is located in a convenient location and has a good curb appeal. The highest-ROI updates would be to paint the exterior siding and replace any damaged windows to increase its resale value.
Value-add opportunities
- Resale Paint the exterior siding — Painting the exterior siding can enhance the curb appeal and increase the home's resale value.
- Resale Replace any damaged windows — Replacing damaged windows can improve the home's energy efficiency and increase its resale value.
Renovation cost estimate screening
Value-add ROI direction
- Resale Paint the exterior siding — Painting the exterior siding can enhance the curb appeal and increase the home's resale value. ↑
- Resale Replace any damaged windows — Replacing damaged windows can improve the home's energy efficiency and increase its resale value. ↑
ⓘ Cost ranges are severity-bucket heuristics (US national rule-of-thumb). Get contractor quotes + a written scope before underwriting a rehab budget.
Schools (NCES district)
- District
- Lafayette School Corporation
- NCES district ID
- 1805400
- Math proficiency
- 29% ▼ -9.00%
- Reading proficiency
- 34% ▼ -7.00%
- Median HH income
- $39,817
- Composite
- 26.46/100
- National rank
- #7217
- State rank
- #235 of 301 in IN
Livability — Lafayette
- Score
- 74/100
- State rank
- #68
- US rank
- #4374
Category grades
Schools grade is shown separately in the Schools card above.
Census & demographics
- Census place
- Lafayette, IN
- County
- Tippecanoe County · 181,820 people
- City population
- 106,622
- Metro
- Lafayette-West Lafayette, IN
- Population (ZIP)
- 16,257
- Household income
- $51,687
- Rent vs Own
- Severe rent burden
- 563.0
Population outlook (Tippecanoe County) Hauer SSP2
- Today (2025)
- 215,327 people
- By 2030
- 232,284 · +7.9%
- By 2040
- 266,517 · +23.8%
- By 2050
- 302,826 · +40.6%
- By 2075
- 394,445 · +83.2%
- By 2100
- 463,500 · +115.3%
Race, ethnicity, and origin ACS 2023
- Neighborhood character
- Predominantly White (73%)
- Race & ethnicity
- White 73% Hispanic / Latino 16% Two or more races 11% Black 5% Asian 1%
- Hispanic origin (detail)
- Mexican 14%
- Common ancestry
- Romanian 3% Lithuanian 1% Iranian 1%
- Foreign-born
- 9% · Canada, China
- Languages at home
- 88% English-only · Spanish 10% Other Asian/Pacific 1%
Political lean MEDSL · Tippecanoe
- 2024 margin
- Toss-up / Even · D 49.0% · R 49.1% · Other 1.9%
- 2008→2024 swing
- -11.8pp toward R · 2008: 11.6pp · 2024: -0.1pp
- All cycles
- 2024: R+0.1 2020: D+0.6 2016: R+5.7 2012: R+3.6 2008: D+11.6
Not yet ingested
- Civics
- —
Market trends
- HPI YoY
- ▼ -147.53%
- Current HPI
- 227.1555
- Rent YoY
- ▲ 2.80%
- Metro
- Lafayette-West Lafayette, IN
- State GDP YoY
- ▲ 2.90%
- F500 in state
- 18
Industry mix (Fortune 500 HQ in IN)
| Industry | F500 HQs | Revenue |
|---|---|---|
| Industrial Machinery | 2 | $37B |
|
||
| Healthcare | 1 | $177B |
|
||
| Pharmaceuticals | 1 | $45B |
|
||
| Metals / Steel | 1 | $18B |
|
||
| Agriculture | 1 | $17B |
|
||
| Packaging | 1 | $12B |
|
||
Price history
1 event — show timeline
- 2026-06-19 Listed $109,000 IRMLS
Cash-flow waterfall
monthlySold comps — $/sqft
last 12 mo · ≤1 miLoading sold comps…