 Multi-family
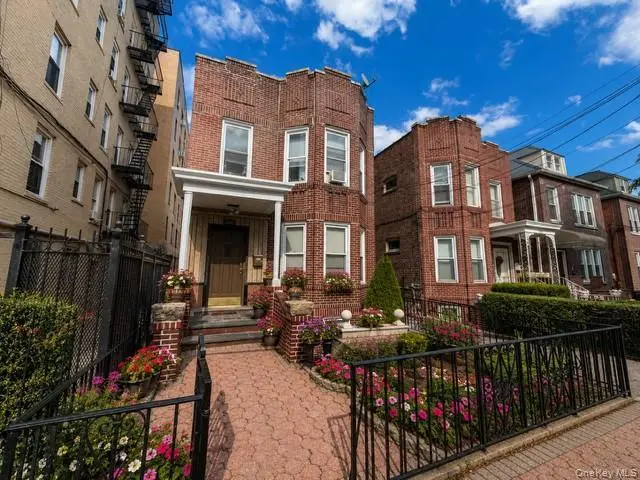
1752 Mahan Ave · New York, NY
Flood risk 1/10 · Minimal
- FEMA flood zone
- X (unshaded)
- Chance of flooding over 30 yrs
- 0.0%
- Est. flood insurance / yr
- $507 – $1,088
Fire risk 1/10 · Minimal
- Est. fire insurance / yr
- $691 – $1,283
Heat risk 6/10 · Moderate
- Hot days now (above 99°F)
- 7 days/yr
- Hot days in 30 yrs
- 15 days/yr
Wind risk 6/10 · Moderate
- Chance of severe wind over 30 yrs
- 27.0%
Air-quality risk 4/10 · Minor
- Unhealthy air days now
- 6 days/yr
- Unhealthy air days in 30 yrs
- 6 days/yr
Risk factors via First Street. Map © Google.
Why this score? — see what drove the C grade
The composite is a weighted blend of 9 inputs, each scored 0–100. Each bar is that input's sub-score; the figure is the points it added to the 100-point composite (weight × sub-score).
- Cash flow +17.9/30.0
- ARV discount +14.7/15.0
- DSCR +5.6/10.0
- Schools +5.0/10.0
- Rent growth +4.5/5.0
- 1% rule +4.1/10.0
- Livability +3.8/5.0
- Condition / age +2.5/5.0
- Appreciation +0.0/10.0
$995,000
🖨 Deal sheet (PDF) 📄 Offer letter ✓ Due diligence
Multi-family units
County records classify this as Multi-Family (2-4 Unit). Listing-text estimate: 1 unit. estimate disagrees with records
Listing remarks
Welcome to 1752 Mahan Ave, a solid all-brick multi-family home located in the heart of the highly desirable Pelham Bay section of the Bronx. This spacious property offers exceptional living space, versatility, and income-producing potential. The top-floor apartment features a large 3-bedroom layout with a formal dining room and an enclosed rear porch perfect for entertaining, relaxing, or additional flex space. The second-floor unit offers 2 spacious bedrooms, a large living room, formal dining area, powder room, updated kitchen, and an enclosed porch ideal for a dressing room or walk-in closet, with direct access to the rear patio and backyard. The lower level includes a finished walk-out
Key facts
- Pelham bay section
- Private backyard
- Enclosed rear porch
Tags
Property features AI
Exterior
- Parking: Parking lot with space for 2 vehicles; One garage space
- Utilities: Electricity connected (Con-Edison); Natural gas connected; Public sewer
- Home design: Townhouse structure; Duplex property subtype; Total building area approximately 3372
- Construction: Brick exterior
- Exterior features: Brick construction; Not waterfront; No additional parcels; Patio
Interior
- Kitchen: No kitchen appliance details provided
- Bedrooms: One 2-bedroom unit; One 3-bedroom unit
- Flooring: Hardwood; Laminate; Linoleum
- Bathrooms: Three full bathrooms
- Heating & cooling: Oil heating; Wall/window air conditioning units
- Interior features: Formal dining area; Storage space; Washer/dryer hookup; Finished walk-out basement; Patio
- Laundry & utility: Washer/dryer hookup
Neighborhood map
What this means for you Summary
Snapshot
- This is a 5-bed/3.0-bath multifamily listed at $995k.
Deal economics
- At list price, monthly cash flow is $840 ($10k/yr) — positive.
- The deal already cash-flows at list — no discount required.
- To meet the 1% rule (rent ≥ 1% of price), the offer needs to be $903k (9.2% below list).
- Recommended offer: $903k (9.2% below list) — sets the bar for 1% rule.
- Cap rate 7.3% vs local median 2.6% in New York — top-decile yield for the area; either an underpriced asset or a hidden risk that comps aren't pricing in. Stress-test before assuming the spread holds.
Location & tenants
- Location reads 75/100 on livability (#268 in NY, #4,188 nationally) — a middle-class / working-renter tenant base. Strengths: amenities A+, commute A+, health & safety A; Watch: crime F, cost of living F.
- Market conditions: Rents rising fast (+8.0%/yr); 147 active listings in the ZIP; 6,929 units permitted in Bronx County in 2024 (6,829 in 5+ unit buildings).
- At $9,034/mo this rent would consume 162% of the median local household income ($67k/yr) (locally 4430% of renters already pay >50% of income on rent) — very limited rent-growth headroom before tenants either downsize or default.
Forward outlook
- Local home prices are declining (-3.0%/yr); year-one equity from $7k of loan paydown is wiped out by about $30k of value loss. Plan a longer hold.
- Bronx County population projected at +21% by 2050 — long-run rental-demand tailwind backs the buy-and-hold thesis.
- At projected returns (-3.0% appreciation + 8.0% rent growth), your $279k cash investment doubles in ~10 years — after that, you're playing with house money.
Negotiation context
- It's been on market 37 days — a 3% lower offer ($965k) is reasonable based on typical stale-listing flexibility.
- Current owner paid $128k; list at $995k implies a 677% gain — meaningful room to come down on a strong offer.
Risks & watch-outs
- Watch-outs: built in 1930 — expect roof / HVAC / electrical / plumbing capex.
- Climate carrying-cost: major wind risk, 27% chance of damaging wind over 30y; extreme-heat days projected 7→15/yr by 2055 (HVAC capex compounding) — expect insurance premiums to compound above CPI over the hold.
Questions for the listing agent
- It's been on market 37 days. Have you received any prior offers? Is the seller open to a 9% concession, seller financing, or rate buy-down credit?
- Built in 1930 — when were the roof, HVAC, electrical panel, plumbing, and water heater last replaced?
- Is there a deadline driving the sale (1031 exchange, divorce, estate, relocation)? That informs how much negotiation room exists.
- Schools are B-rated — typically a magnet for longer-tenancy family renters. What's the average tenant stay here, and is there a school-zone premium baked into asking?
- Crime grade is F in this area — have there been break-ins, vandalism, or insurance claims at this property in the last 3 years? What carrier currently insures it and at what premium?
- What's the average days-on-market for RENTAL listings here right now (not sales)? A rising rental-DOM trend means longer vacancies and softer asking-rent achievability than the comps imply.
- What's the recent tenant-quality profile in this submarket — average credit score on applications, eviction rate, late-payment / NSF rate, and stable-employment percentage? A property-management company in the area should have these aggregated.
- How much new apartment / multifamily construction is in the pipeline within 1–3 miles? Heavy new supply (>2% of stock underway) typically softens rents 12–24 months out; light construction supports rent growth.
Investment metrics
- 1% rule
- 0.91% ✗
- Cap rate
- 7.31%
- Cash-on-cash
- 3.62%
- DSCR
- 1.16
- GRM
- 9.2
CMA / ARV
- ARV (on-the-fly)
- $1,183,572
- Comps found
- 9
Show comp detail 9 sales within ~0.75 mi
| Address | Dist | Beds/Ba | Sqft | Sold | Price | $/sf | Match |
|---|---|---|---|---|---|---|---|
| 3125 Spencer Dr | 0.38mi | 5/3.0 | 3,435 (+2%) | 8mo | $1,500,000 | $437 | 72 |
| 1711 Mahan Ave | 0.08mi | 6/3.0 (+1) | 2,912 (-14%) | 2mo | $1,350,000 | $464 | 67 |
| 2910 Zulette Ave | 0.43mi | 6/3.0 (+1) | 3,276 (-3%) | 7mo | $1,220,000 | $372 | 64 |
| 3131 Sands Pl | 0.24mi | 6/3.0 (+1) | 3,150 (-7%) | 14mo | $900,000 | $286 | 61 |
| 1518 Bayview Ave | 0.65mi | 6/4.0 (+1) | 3,276 (-3%) | 3mo | $1,100,000 | $336 | 54 |
| 1950 Pilgrim Ave | 0.28mi | 4/2.0 (-1) | 3,072 (-9%) | 19mo | $765,000 | $249 | 48 |
| 2812 Dudley Ave | 0.67mi | 6/3.0 (+1) | 3,204 (-5%) | 16mo | $1,125,000 | $351 | 42 |
| 2875 Harrington Ave | 0.57mi | 5/2.0 | 3,078 (-9%) | 16mo | $750,000 | $244 | 42 |
| 3070 Lasalle Ave | 0.56mi | 6/4.0 (+1) | 2,970 (-12%) | 9mo | $1,125,000 | $379 | 37 |
Match score weights: distance 35% · size 25% · config 20% · recency 20%. Top-matched comps best support the ARV.
Projected returns pro-forma
-3.0% appreciation · 7.99% rent growth · sell at horizon
- IRR
- -5.6%
- Equity multiple
- 0.78×
- Total profit
- $-60,325
- Equity at exit
- $148,358
- IRR
- 9.0%
- Equity multiple
- 1.83×
- Total profit
- $232,242
- Equity at exit
- $86,029
Cash invested: $278,600 (down + closing). Projections, not guarantees.
Landlord ↔ Tenant lean methodology
- Overall (CITY)
- 0 Strongly Tenant-Friendly
- State New York
- 15 Strongly Tenant-Friendly · D+10
- County
- — inherits STATE
- City New York
- 0 Strongly Tenant-Friendly · D+34
ZIP-level market 10461
- Home prices YoY
- -28.3%
- Rents YoY
- 8.0%
- Active inventory
- 147
- Price-to-rent
- 25.8×
Monthly cashflow live
- Estimated rent
- $9,034 medium interval (Pro) →
- Mortgage (P&I)
- −$5,218
- Tax from tax record
- −$665 /mo · $7,976/yr
- Insurance
- −$415
- HOA
- −$0
- Vacancy / Maint / Mgmt
- −$1,897
- Net cashflow
- $840
Break-even live
Sensitivity live
| Price | -10% $1,403 | -5% $1,121 | +0% $840 | +5% $558 | +10% $277 |
|---|---|---|---|---|---|
| Rent | -10% $126 | -5% $483 | +0% $840 | +5% $1,197 | +10% $1,553 |
| Rate | -1.0pp $1,341 | -0.5pp $1,093 | base $840 | +0.5pp $582 | +1.0pp $320 |
3-unit breakdown (identical units grouped — click to expand)
| Units | Beds | Baths | Est. rent |
|---|---|---|---|
| 1× unit | 3 | 1.5 | $3,218 |
| 2× units | 2 | 1 | $5,816 |
| #2 | 2 | 1 | $2,908 |
| #3 | 2 | 1 | $2,908 |
| Total (3 units) | $9,034 | ||
UW: 25.0% down · 7.5% · 30yr · 1.5% tax · 5.0% vac · 8.0% maint · 8.0% mgmt
Financing live
Cash to close
- Down payment
- $248,750
- Closing costs
- $29,850
- Reserves months
- —
- Total cash needed
- —
Loan-product check · same deal, 3 products live
Conventional
25% down · 7.5% · 30yr
- Down + closing
- —
- Monthly P&I
- —
- Monthly cashflow
- —
- DSCR
- —
- Eligible?
- —
Personal DTI + credit; lowest rate.
DSCR
20% down · 8.5% · 30yr
- Down + closing
- —
- Monthly P&I
- —
- Monthly cashflow
- —
- DSCR
- —
- Eligible?
- —
No personal income docs; deal must DSCR.
Hard money
10% down · 12.0% · 12mo
- Down + closing
- —
- Monthly P&I
- —
- Monthly cashflow
- —
- DSCR
- —
- Eligible?
- —
Short-term bridge; refi at stabilization.
Listing history 16 events
-
2026-06-21days on market $995,000 Active 37 DOM
-
2026-06-18days on market $995,000 Active 34 DOM
-
2026-06-17days on market $995,000 Active 33 DOM
-
2026-06-16days on market $995,000 Active 32 DOM
-
2026-06-15days on market $995,000 Active 31 DOM
-
2026-06-13days on market $995,000 Active 29 DOM
-
2026-06-10days on market $995,000 Active 25 DOM
-
2026-06-08days on market $995,000 Active 24 DOM
-
2026-06-08days on market $995,000 Active 23 DOM
-
2026-06-04days on market $995,000 Active 20 DOM
-
2026-06-03days on market $995,000 Active 19 DOM
-
2026-06-02days on market $995,000 Active 18 DOM
-
2026-06-01days on market $995,000 Active 17 DOM
-
2026-05-31days on market $995,000 Active 16 DOM
-
2026-05-15$995,000 Active
-
1992-10-26soldstatus $128,000
ⓘ Source: listings_history table (triggers on properties + properties_extension) + one-shot
backfill from property_details.listing_events for pre-trigger history.
Tax reassessment forecast NY · Partial reset (capped growth)
- Current annual tax
- $7,976 · $665/mo
- Projected year-2 tax
- $12,396 · $1,033/mo
- Expected delta
- +$4,420/yr (+$368/mo · 55.4%)
ⓘ Screening estimate from a state-policy table — verify with the county assessor before closing.
Climate risk First Street
- Flood 1/10 Low FEMA zone X (unshaded) · 0% chance over 30 yrs
- Wildfire 1/10 Low
- Heat 6/10 Major 7 d/yr ≥99°F today · 15 d/yr by 30 yrs out
- Wind 6/10 Major 27% chance of damaging wind over 30 yrs
- Air quality 4/10 Moderate 6 unhealthy d/yr today · 6 by 30 yrs out
Nearby sold comps map
Loading sold comps map…
Walkable amenities ~0.75 mi
Loading nearby amenities…
Taxation est. · year 1
- Rental income
- $108,408
- − Mortgage interest
- −$55,735
- − Property taxes
- −$7,976
- − Insurance
- −$4,975
- − Repairs & maintenance
- −$8,673
- − Management
- −$8,673
- − Depreciation
- −$28,945
- Taxable loss
- −$6,569
- Est. tax savings @ 24.0%
- +$1,577
- After-tax cash flow
- $11,654/yr
For passive investors: Depreciation is non-cash, so a rental often shows a tax loss while cash-flowing — sheltering income. Rental losses are passive: they offset passive income freely, and up to $25,000/yr can offset ordinary (W-2) income if you actively participate and your MAGI is under $100k (phasing out to $0 by $150k); unused losses carry forward. On sale, claimed depreciation is recaptured at up to 25%, and gains may owe capital-gains tax (a 1031 exchange can defer both). Figures are a year-1 estimate at your 24.0% rate — not tax advice; consult a CPA.
Schools (NCES district)
No district data.
Livability — New York
- Score
- 75/100
- State rank
- #268
- US rank
- #4188
Category grades
Schools grade is shown separately in the Schools card above.
Census & demographics
- Census place
- New York, NY
- County
- Bronx County · 1,197,324 people
- City population
- 7,731,280
- Metro
- New York-Newark-Jersey City, NY-NJ-PA
- Population (ZIP)
- 52,012
- Household income
- $67,028
- Rent vs Own
- Severe rent burden
- 4430.0
Population outlook (Bronx County) Hauer SSP2
- Today (2025)
- 1,607,353 people
- By 2030
- 1,681,852 · +4.6%
- By 2040
- 1,824,421 · +13.5%
- By 2050
- 1,945,470 · +21.0%
- By 2075
- 2,187,887 · +36.1%
- By 2100
- 2,244,136 · +39.6%
Race, ethnicity, and origin ACS 2023
- Neighborhood character
- Diverse neighborhood (Simpson 0.67)
- Race & ethnicity
- Hispanic / Latino 47% White 30% Asian 13% Two or more races 10% Black 7%
- Hispanic origin (detail)
- Mexican 4% Puerto Rican 20% Cuban 1% Dominican 13%
- Common ancestry
- Romanian 1%
- Foreign-born
- 30% · Canada, China, Vietnam
- Languages at home
- 43% English-only · Spanish 34% Other Indo-European 13% Tagalog/Filipino 3%
Political lean MEDSL · Bronx
- 2024 margin
- Solid D (+45.4) · D 72.7% · R 27.3%
- 2008→2024 swing
- -32.3pp toward R · 2008: 77.8pp · 2024: 45.4pp
- All cycles
- 2024: D+45.4 2020: D+67.6 2016: D+79.1 2012: D+82.9 2008: D+77.8
Not yet ingested
- Civics
- —
Market trends
- HPI YoY
- ▼ -105.06%
- Current HPI
- 266.5457
- Rent YoY
- ▲ 7.99%
- Metro
- New York-Newark-Jersey City, NY-NJ-PA
- State GDP YoY
- ▲ 2.60%
- F500 in state
- 92
Industry mix (Fortune 500 HQ in NY)
| Industry | F500 HQs | Revenue |
|---|---|---|
| Financial Services | 10 | $950B |
|
||
| Consumer Goods | 9 | $162B |
|
||
| Insurance | 4 | $225B |
|
||
| Telecommunications | 2 | $144B |
|
||
| Pharmaceuticals | 2 | $112B |
|
||
| Media / Entertainment | 2 | $69B |
|
||
Price history
+677.3% since first listed2 events — show timeline
- 2026-05-15 Listed $995,000 OneKey® MLS as Distributed by MLS Grid
- 1992-10-26 Sold (Public Records) $128,000 Public Records
Property tax history
+4.5%/yrLatest (2025): $7,976 · +0.8% YoY. Source: county tax records.
Cash-flow waterfall
monthlySold comps — $/sqft
last 12 mo · ≤1 miLoading sold comps…