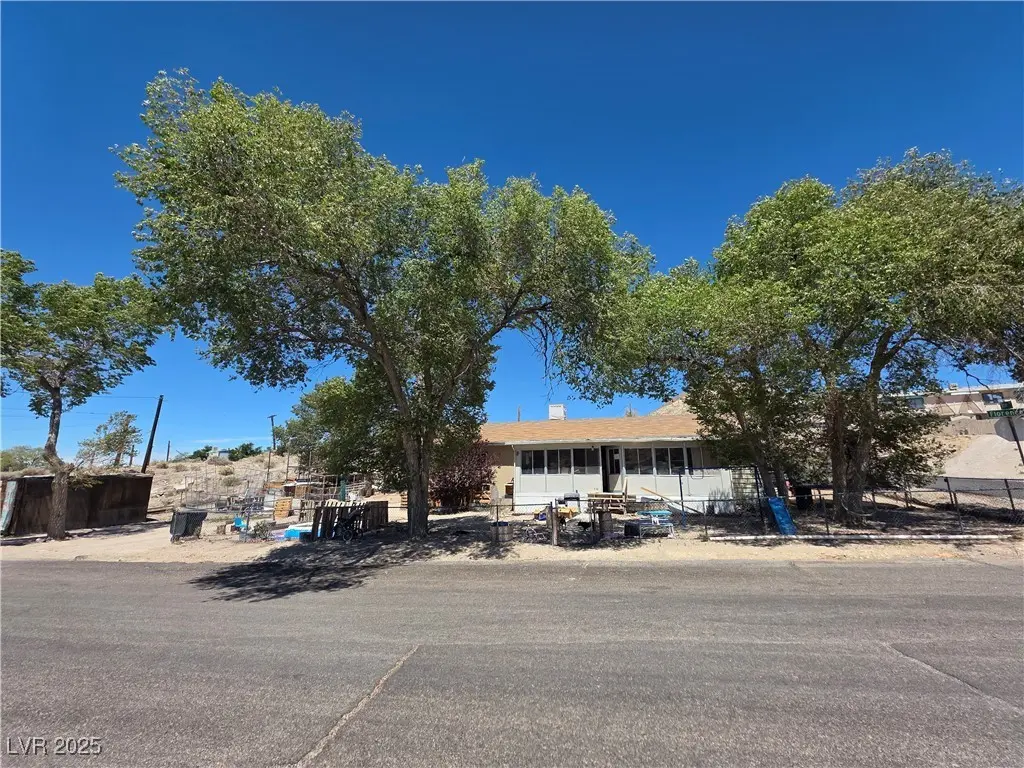
494 S Florence Ave · Tonopah, NV
Flood risk 1/10 · Minimal
- FEMA flood zone
- X (unshaded)
- Chance of flooding over 30 yrs
- 0.0%
- Est. flood insurance / yr
- $507 – $1,088
Fire risk 1/10 · Minimal
- Est. fire insurance / yr
- $490 – $910
Heat risk 4/10 · Minor
- Hot days now (above 90°F)
- 6 days/yr
- Hot days in 30 yrs
- 16 days/yr
Wind risk 1/10 · Minimal
- Chance of severe wind over 30 yrs
- —
Air-quality risk 3/10 · Minor
- Unhealthy air days now
- 2 days/yr
- Unhealthy air days in 30 yrs
- 3 days/yr
Risk factors via First Street. Map © Google.
Why this score? — see what drove the B grade
The composite is a weighted blend of 9 inputs, each scored 0–100. Each bar is that input's sub-score; the figure is the points it added to the 100-point composite (weight × sub-score).
- Cash flow +26.1/30.0
- ARV discount +15.0/15.0
- DSCR +8.8/10.0
- 1% rule +6.9/10.0
- Appreciation +6.9/10.0
- Livability +3.2/5.0
- Rent growth +2.5/5.0
- Schools +2.2/10.0
- Condition / age +2.2/5.0
$125,000
🖨 Deal sheet (PDF) 📄 Offer letter ✓ Due diligence
Listing remarks MLS
Property Description Discover this charming 1,488 sq/ft manufactured home, classified as real property for added value and stability. Nestled on a spacious 0.23-acre corner lot (over 10,000 sq/ft), this 3-bedroom, 2-bathroom residence offers ample space and modern updates. The home features updated aluminum siding (replaced approximately 7 years ago), a fully fenced lot perfect for privacy, and sufficient room for RV parking. Most windows have been upgraded for improved energy efficiency, with only two original windows remaining. Stay cozy with the efficient pellet stove heating system. Ideal for those seeking a blend of rural charm and practical living! Act fast!!!
Key facts
- Rv parking
- Pellet stove heating
- Fenced lot
Tags
Neighborhood map
What this means for you Summary
Snapshot
- This is a 3-bed/2.0-bath manufactured listed at $125k. Condition is rated fair.
Deal economics
- At list price, monthly cash flow is $316 ($4k/yr) — positive.
- The deal already cash-flows at list — no discount required.
- Meets the 1% rule at list price ($1k rent vs $125k).
- Recommended offer: $110k (12.0% below list) — sets the bar for market timing.
Location & tenants
- Location reads 63/100 on livability (#60 in NV) — a middle-class / working-renter tenant base. Strengths: cost of living A+, housing A+, crime B+; Watch: amenities F, commute F, employment F.
- Nye County School District (rural): math 20% / reading 33% proficiency, ranked #16 of 17 in NV (top 94%) — low school quality limits family demand, transient renter base, plan for 1-2y turnover.
- Zoned schools: Tonopah Elementary School (math 27% / reading 32%, grade F, #195 of 402 statewide, top 53%, 170 students, 100% FRL); Tonopah Middle School (math 22% / reading 37%, grade F, #44 of 109 statewide, top 46%, 70 students, 100% FRL); Tonopah High School (math 10% / reading 30%, grade F, #93 of 131 statewide, top 74%, 107 students, 100% FRL) — zoned schools average 100% FRL vs 54% district-wide (46 pts higher); higher-poverty schools than district average — tighter screening recommended.
- Market conditions: 25 active listings in the ZIP.
Forward outlook
- In year one you build about $6k of equity ($864 loan paydown + $5k appreciation (3.9% local appreciation)).
- Nye County population projected at -28% by 2050 — secular population decline; favor cash flow + early exit over multi-decade hold.
- At projected returns (3.9% appreciation + 3.0% rent growth), your $35k cash investment doubles in ~4 years — after that, you're playing with house money.
- By year 6, paydown + projected appreciation supports a ~$30k cash-out refi (75% LTV) — recoverable capital for the next deal without selling this one.
Negotiation context
- It's been on market 324 days — a 12% lower offer ($110k) is reasonable based on typical stale-listing flexibility.
Questions for the listing agent
- It's been on market 324 days. Have you received any prior offers? Is the seller open to a 12% concession, seller financing, or rate buy-down credit?
- Have any recent inspections been done? Can we get a copy of the seller's disclosures and any deferred-maintenance estimates?
- Built in 1974 — when were the roof, HVAC, electrical panel, plumbing, and water heater last replaced?
- Why hasn't it sold? Are there any deal-killer items the seller is aware of (foundation, flood, title, zoning, code violations)?
- Is there a deadline driving the sale (1031 exchange, divorce, estate, relocation)? That informs how much negotiation room exists.
- Schools are F-rated, which usually means shorter tenancies and higher turnover. Who's the typical renter profile here, and what's been the actual vacancy rate?
- What's the average days-on-market for RENTAL listings here right now (not sales)? A rising rental-DOM trend means longer vacancies and softer asking-rent achievability than the comps imply.
- What's the recent tenant-quality profile in this submarket — average credit score on applications, eviction rate, late-payment / NSF rate, and stable-employment percentage? A property-management company in the area should have these aggregated.
- How much new for-sale + rental construction is in the pipeline within 1–3 miles? Heavy new supply typically softens prices + rents 12–24 months out; constrained supply supports both.
Investment metrics
- 1% rule
- 1.19% ✓
- Cap rate
- 9.32%
- Cash-on-cash
- 10.82%
- DSCR
- 1.48
- GRM
- 7.0
CMA / ARV
- ARV (median comp)
- $245,000
- List price
- $125,000
- Delta
- -48.98%
- Verdict
- UNDERPRICED
- Comps
- 3 within 1.0 mi
Show comp detail 3 sales within ~0.75 mi
| Address | Dist | Beds/Ba | Sqft | Sold | Price | $/sf | Match |
|---|---|---|---|---|---|---|---|
| 729 S Central St | 0.25mi | 3/2.0 | 1,440 (-3%) | 0mo | $245,000 | $170 | 82 |
| 520 E Mcculloch Ave Cir | 0.20mi | 2/2.0 (-1) | 1,536 (+3%) | 12mo | $195,000 | $127 | 70 |
| 445 Tonopah Ave | 0.32mi | 3/2.0 | 1,690 (+14%) | 10mo | $260,000 | $154 | 54 |
Match score weights: distance 35% · size 25% · config 20% · recency 20%. Top-matched comps best support the ARV.
Projected returns pro-forma
3.88% appreciation · 3.0% rent growth · sell at horizon
- IRR
- 19.7%
- Equity multiple
- 2.17×
- Total profit
- $41,103
- Equity at exit
- $62,505
- IRR
- 20.2%
- Equity multiple
- 4.18×
- Total profit
- $111,150
- Equity at exit
- $101,543
Cash invested: $35,000 (down + closing). Projections, not guarantees.
Landlord ↔ Tenant lean methodology
- Overall (STATE)
- 71 Landlord-Friendly
- State Nevada
- 71 Landlord-Friendly · R+1
- County
- — inherits STATE
- City
- — inherits STATE
ZIP-level market 89049
- Home prices YoY
- 3.2%
- Active inventory
- 25
- Price-to-rent
- 7.0×
Monthly cashflow live
- Estimated rent
- $1,493 medium interval (Pro) →
- Mortgage (P&I)
- −$656
- Tax est. 1.5%
- −$156 /mo · $1,875/yr
- Insurance
- −$52
- HOA
- −$0
- Vacancy / Maint / Mgmt
- −$314
- Net cashflow
- $316
Break-even live
Sensitivity live
| Price | -10% $402 | -5% $359 | +0% $316 | +5% $272 | +10% $229 |
|---|---|---|---|---|---|
| Rent | -10% $198 | -5% $257 | +0% $316 | +5% $375 | +10% $434 |
| Rate | -1.0pp $379 | -0.5pp $347 | base $316 | +0.5pp $283 | +1.0pp $250 |
UW: 25.0% down · 7.5% · 30yr · 1.5% tax · 5.0% vac · 8.0% maint · 8.0% mgmt
Financing live
Cash to close
- Down payment
- $31,250
- Closing costs
- $3,750
- Reserves months
- —
- Total cash needed
- —
Loan-product check · same deal, 3 products live
Conventional
25% down · 7.5% · 30yr
- Down + closing
- —
- Monthly P&I
- —
- Monthly cashflow
- —
- DSCR
- —
- Eligible?
- —
Personal DTI + credit; lowest rate.
DSCR
20% down · 8.5% · 30yr
- Down + closing
- —
- Monthly P&I
- —
- Monthly cashflow
- —
- DSCR
- —
- Eligible?
- —
No personal income docs; deal must DSCR.
Hard money
10% down · 12.0% · 12mo
- Down + closing
- —
- Monthly P&I
- —
- Monthly cashflow
- —
- DSCR
- —
- Eligible?
- —
Short-term bridge; refi at stabilization.
Listing history 17 events
-
2026-06-19days on market $125,000 Active 324 DOM
-
2026-06-18days on market $125,000 Active 323 DOM
-
2026-06-17days on market $125,000 Active 322 DOM
-
2026-06-16days on market $125,000 Active 321 DOM
-
2026-06-15days on market $125,000 Active 320 DOM
-
2026-06-14days on market $125,000 Active 318 DOM
-
2026-06-12days on market $125,000 Active 317 DOM
-
2026-06-09days on market $125,000 Active 314 DOM
-
2026-06-08days on market $125,000 Active 313 DOM
-
2026-06-07days on market $125,000 Active 312 DOM
-
2026-06-03days on market $125,000 Active 308 DOM
-
2026-06-02days on market $125,000 Active 307 DOM
-
2026-06-01days on market $125,000 Active 306 DOM
-
2026-05-31days on market $125,000 Active 305 DOM
-
2026-05-30days on market $125,000 Active 304 DOM
-
2025-09-27price $125,000 675-char remark
Show marketing remark (675 chars)
Property Description Discover this charming 1,488 sq/ft manufactured home, classified as real property for added value and stability. Nestled on a spacious 0.23-acre corner lot (over 10,000 sq/ft), this 3-bedroom, 2-bathroom residence offers ample space and modern updates. The home features updated aluminum siding (replaced approximately 7 years ago), a fully fenced lot perfect for privacy, and sufficient room for RV parking. Most windows have been upgraded for improved energy efficiency, with only two original windows remaining. Stay cozy with the efficient pellet stove heating system. Ideal for those seeking a blend of rural charm and practical living! Act fast!!!
-
2025-07-30$145,000 Active 675-char remark
Show marketing remark (675 chars)
Property Description Discover this charming 1,488 sq/ft manufactured home, classified as real property for added value and stability. Nestled on a spacious 0.23-acre corner lot (over 10,000 sq/ft), this 3-bedroom, 2-bathroom residence offers ample space and modern updates. The home features updated aluminum siding (replaced approximately 7 years ago), a fully fenced lot perfect for privacy, and sufficient room for RV parking. Most windows have been upgraded for improved energy efficiency, with only two original windows remaining. Stay cozy with the efficient pellet stove heating system. Ideal for those seeking a blend of rural charm and practical living! Act fast!!!
ⓘ Source: listings_history table (triggers on properties + properties_extension) + one-shot
backfill from property_details.listing_events for pre-trigger history.
Climate risk First Street
- Flood 1/10 Low FEMA zone X (unshaded) · 0% chance over 30 yrs
- Wildfire 1/10 Low
- Heat 4/10 Moderate 6 d/yr ≥90°F today · 16 d/yr by 30 yrs out
- Wind 1/10 Low
- Air quality 3/10 Moderate 2 unhealthy d/yr today · 3 by 30 yrs out
Nearby sold comps map
Loading sold comps map…
Walkable amenities ~0.75 mi
Loading nearby amenities…
Taxation est. · year 1
- Rental income
- $17,916
- − Mortgage interest
- −$7,002
- − Property taxes
- −$1,875
- − Insurance
- −$625
- − Repairs & maintenance
- −$1,433
- − Management
- −$1,433
- − Depreciation
- −$3,636
- Taxable income
- $1,911
- Est. tax owed @ 24.0%
- −$459
- After-tax cash flow
- $3,329/yr
For passive investors: Depreciation is non-cash, so a rental often shows a tax loss while cash-flowing — sheltering income. Rental losses are passive: they offset passive income freely, and up to $25,000/yr can offset ordinary (W-2) income if you actively participate and your MAGI is under $100k (phasing out to $0 by $150k); unused losses carry forward. On sale, claimed depreciation is recaptured at up to 25%, and gains may owe capital-gains tax (a 1031 exchange can defer both). Figures are a year-1 estimate at your 24.0% rate — not tax advice; consult a CPA.
Condition & rehab AI · 7 photos
This manufactured home requires significant repairs and updates to improve its condition and value. The exterior, roof, flooring, and HVAC system are in poor condition and need major repairs. Interior walls also require painting. Upgrading these areas will significantly increase its resale and rental value.
Repairs flagged
- Major siding — Severe weathering
- Major roof — Signs of wear and tear
- Major flooring — Worn-out condition
- Major HVAC/mechanicals — Pellet stove heating system
Value-add opportunities
- Both Replace siding and roof — Improves curb appeal and durability
- Both Install new flooring — Enhances comfort and aesthetics
- Both Paint interior walls — Freshens up the interior and improves air quality
- Both Upgrade HVAC system — Enhances comfort and energy efficiency
Renovation cost estimate screening
| Repair item | Severity | Est. cost |
|---|---|---|
| siding · Severe weathering | Major | $15,000–50,000 |
| roof · Signs of wear and tear | Major | $15,000–50,000 |
| flooring · Worn-out condition | Major | $15,000–50,000 |
| HVAC/mechanicals · Pellet stove heating system | Major | $15,000–50,000 |
| Total estimated repair cost · 4 items | $60,000–200,000 |
Value-add ROI direction
- Both Replace siding and roof — Improves curb appeal and durability ↑
- Both Install new flooring — Enhances comfort and aesthetics ↑
- Both Paint interior walls — Freshens up the interior and improves air quality ↑
- Both Upgrade HVAC system — Enhances comfort and energy efficiency ↑
ⓘ Cost ranges are severity-bucket heuristics (US national rule-of-thumb). Get contractor quotes + a written scope before underwriting a rehab budget.
Schools (NCES district)
- District
- Nye County School District
- NCES district ID
- 3200360
- Math proficiency
- 20% ▼ -6.00%
- Reading proficiency
- 33% ▼ -5.00%
- Median HH income
- $41,447
- Composite
- 22.43/100
- National rank
- #8110
- State rank
- #16 of 17 in NV
Livability — Tonopah
- Score
- 63/100
- State rank
- #60
- US rank
- #16080
Category grades
Schools grade is shown separately in the Schools card above.
Census & demographics
- Census place
- Tonopah, NV
- Population (ZIP)
- 2,711
Population outlook (Nye County) Hauer SSP2
- Today (2025)
- 40,727 people
- By 2030
- 38,812 · -4.7%
- By 2040
- 33,952 · -16.6%
- By 2050
- 29,393 · -27.8%
- By 2075
- 21,122 · -48.1%
- By 2100
- 14,400 · -64.6%
Race, ethnicity, and origin ACS 2023
- Neighborhood character
- Predominantly White (73%)
- Race & ethnicity
- White 73% Hispanic / Latino 15% Black 8% Two or more races 4% Asian 1%
- Hispanic origin (detail)
- Mexican 8% Puerto Rican 5%
- Common ancestry
- Lithuanian 2% Romanian 2% Scottish 2%
- Foreign-born
- 8% · Canada, China
- Languages at home
- 90% English-only · French/Haitian/Cajun 6% Spanish 2% Tagalog/Filipino 1%
Political lean MEDSL · Nye
- 2024 margin
- Solid R (+42.2) · D 28.0% · R 70.2% · Other 1.8%
- 2008→2024 swing
- -28.8pp toward R · 2008: -13.4pp · 2024: -42.2pp
- All cycles
- 2024: R+42.2 2020: R+40.4 2016: R+42.0 2012: R+24.2 2008: R+13.4
Not yet ingested
- Civics
- —
Market trends
- HPI YoY
- ▲ 3.88%
- Current HPI
- 124.5675
- Rent YoY
- —
- Metro
- —
- State GDP YoY
- ▲ 3.08%
- F500 in state
- 6
Industry mix (Fortune 500 HQ in NV)
| Industry | F500 HQs | Revenue |
|---|---|---|
| Hotels / Casinos | 3 | $36B |
|
||
Price history
-13.8% since first listed2 events — show timeline
- 2025-09-27 Price Changed $125,000 GLVAR
- 2025-07-30 Listed $145,000 GLVAR
Cash-flow waterfall
monthlySold comps — $/sqft
last 12 mo · ≤1 miLoading sold comps…