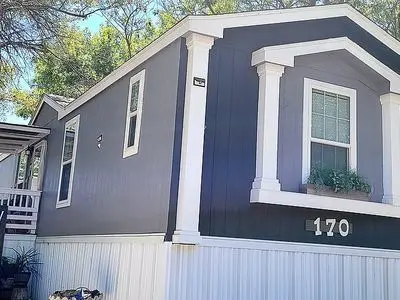
9605 W US Highway 90 · San Antonio, TX
Flood risk 1/10 · Minimal
- FEMA flood zone
- X (unshaded)
- Chance of flooding over 30 yrs
- 0.0%
- Est. flood insurance / yr
- $507 – $1,088
Fire risk 5/10 · Moderate
- Est. fire insurance / yr
- $1,222 – $2,270
Heat risk 8/10 · Major
- Hot days now (above 108°F)
- 7 days/yr
- Hot days in 30 yrs
- 22 days/yr
Wind risk 7/10 · Major
- Chance of severe wind over 30 yrs
- 78.0%
Air-quality risk 2/10 · Minimal
- Unhealthy air days now
- 1 days/yr
- Unhealthy air days in 30 yrs
- 1 days/yr
Risk factors via First Street. Map © Google.
Why this score? — see what drove the B- grade
The composite is a weighted blend of 9 inputs, each scored 0–100. Each bar is that input's sub-score; the figure is the points it added to the 100-point composite (weight × sub-score).
- Cash flow +30.0/30.0
- 1% rule +10.0/10.0
- DSCR +10.0/10.0
- ARV discount +7.5/15.0
- Livability +4.0/5.0
- Condition / age +3.8/5.0
- Schools +2.2/10.0
- Rent growth +1.7/5.0
- Appreciation +0.0/10.0
$45,000
🖨 Deal sheet 📄 Offer letter ✓ Due diligence
Listing remarks
Located in Camino Creek Mobile Home Community. This 1162 sq ft home built in 2016 features an open floor plan, carpet replaced Jan 2026, crown molding throughout, recently painted, 2& quot; blinds. Every window is a double-hung easy clean style. Other features include lever door handles, washer and dryer, electric fireplace, & amp; more. The kitchen has all upgraded stainless steel appliances. Tons of cabinets and a spacious pantry. The newly renovated 2nd bathroom includes subway tiles, new vanity, vessel sink, added storage, and more. The 3rd bedroom has a Murphy bed and custom shelving to maximize living space. The updated master bedroom has a custom closet. The master bath f
Key facts
- Open floor plan
- Custom closet
- Custom shelving
Tags
Neighborhood map
What this means for you Summary
Snapshot
- This is a 3-bed/2.0-bath manufactured listed at $45k. Condition is rated good.
Deal economics
- At list price, monthly cash flow is $849 ($10k/yr) — positive.
- The deal already cash-flows at list — no discount required.
- Meets the 1% rule at list price ($2k rent vs $45k).
- Recommended offer: $44k (1.5% below list) — sets the bar for market timing.
- Cap rate 28.9% vs local median 3.8% in San Antonio — top-decile yield for the area; either an underpriced asset or a hidden risk that comps aren't pricing in. Stress-test before assuming the spread holds.
Location & tenants
- Location reads 80/100 on livability (#31 in TX, #1,616 nationally) — a professional / high-income tenant draw. Strengths: amenities A+, commute A+, cost of living A+; Watch: schools C-, crime F.
- Southwest ISD (rural): math 21% / reading 31% proficiency, ranked #701 of 826 in TX (top 85%) — low school quality limits family demand, transient renter base, plan for 1-2y turnover; 75% free/reduced lunch — lower-income household profile, screen leases tightly.
- Market conditions: Rents falling (-3.0%/yr); 1133 active listings in the ZIP; 17 comparable units currently listed for rent nearby; rentals at typical pace (median 24d on market — plan ~3-4 weeks tenant-placement turnaround); solid renter incomes; 8,308 units permitted in Bexar County in 2024 (2,506 in 5+ unit buildings).
Forward outlook
- Local home prices are declining (-3.0%/yr); year-one equity from $311 of loan paydown is wiped out by about $1k of value loss. Plan a longer hold.
- Bexar County population projected at +50% by 2050 — long-run rental-demand tailwind backs the buy-and-hold thesis.
- At projected returns (-3.0% appreciation + 0.0% rent growth), your $13k cash investment doubles in ~2 years — after that, you're playing with house money.
Negotiation context
- It's been on market 16 days — a 2% lower offer ($44k) is reasonable based on typical stale-listing flexibility.
- 4 sale attempts since 5y ago with the ask held roughly flat each time — persistent listings suggest the price (not the market) is what's stuck; bring a comps-based counter.
Risks & watch-outs
- Watch-outs: property tax is 3.0% of price.
- Climate carrying-cost: major wind risk, 78% chance of damaging wind over 30y; moderate wildfire risk; extreme-heat days projected 7→22/yr by 2055 (HVAC capex compounding) — expect insurance premiums to compound above CPI over the hold.
Questions for the listing agent
- Property tax is high relative to price — has the assessment been appealed recently, and will the sale trigger a re-assessment?
- Is there a deadline driving the sale (1031 exchange, divorce, estate, relocation)? That informs how much negotiation room exists.
- Crime grade is F in this area — have there been break-ins, vandalism, or insurance claims at this property in the last 3 years? What carrier currently insures it and at what premium?
- What's the average days-on-market for RENTAL listings here right now (not sales)? A rising rental-DOM trend means longer vacancies and softer asking-rent achievability than the comps imply.
- What's the recent tenant-quality profile in this submarket — average credit score on applications, eviction rate, late-payment / NSF rate, and stable-employment percentage? A property-management company in the area should have these aggregated.
- How much new for-sale + rental construction is in the pipeline within 1–3 miles? Heavy new supply typically softens prices + rents 12–24 months out; constrained supply supports both.
Investment metrics
- 1% rule
- 3.42% ✓
- Cap rate
- 28.93%
- Cash-on-cash
- 80.85%
- DSCR
- 4.60
- GRM
- 2.4
CMA / ARV
No comps found within radius.
Projected returns pro-forma
-3.0% appreciation · 0.0% rent growth · sell at horizon
- IRR
- 77.5%
- Equity multiple
- 4.36×
- Total profit
- $42,327
- Equity at exit
- $6,710
- IRR
- 80.3%
- Equity multiple
- 8.09×
- Total profit
- $89,299
- Equity at exit
- $3,891
Cash invested: $12,600 (down + closing). Projections, not guarantees.
Landlord ↔ Tenant lean methodology
- Overall (STATE)
- 87 Strongly Landlord-Friendly
- State Texas
- 87 Strongly Landlord-Friendly · R+5
- County
- — inherits STATE
- City
- — inherits STATE
ZIP-level market 78245
- Home prices YoY
- -18.5%
- Rents YoY
- -3.0%
- Active inventory
- 1133
- Price-to-rent
- 2.4×
Monthly cashflow live
- Estimated rent
- $1,537 high interval (Pro) →
- Mortgage (P&I)
- −$236
- Tax from tax record
- −$111 /mo · $1,329/yr
- Insurance
- −$19
- HOA
- −$0
- Vacancy / Maint / Mgmt
- −$323
- Net cashflow
- $849
Break-even live
UW: 25.0% down · 7.5% · 30yr · 1.5% tax · 5.0% vac · 8.0% maint · 8.0% mgmt
Financing live
Cash to close
- Down payment
- $11,250
- Closing costs
- $1,350
- Reserves months
- —
- Total cash needed
- —
Loan-product check · same deal, 3 products live
Conventional
25% down · 7.5% · 30yr
- Down + closing
- —
- Monthly P&I
- —
- Monthly cashflow
- —
- DSCR
- —
- Eligible?
- —
Personal DTI + credit; lowest rate.
DSCR
20% down · 8.5% · 30yr
- Down + closing
- —
- Monthly P&I
- —
- Monthly cashflow
- —
- DSCR
- —
- Eligible?
- —
No personal income docs; deal must DSCR.
Hard money
10% down · 12.0% · 12mo
- Down + closing
- —
- Monthly P&I
- —
- Monthly cashflow
- —
- DSCR
- —
- Eligible?
- —
Short-term bridge; refi at stabilization.
Rent comps 17 comps
| Address | Beds | Baths | Sqft | Rent | $/sqft | DOM | Units | Dist |
|---|---|---|---|---|---|---|---|---|
| 9605 U.S. 90 San Antonio, TX | 2.0 | 2.0 | 1020 | $1,249 | $1.22 | 1d | 1 | 0.05mi |
| 9911 Boxer Crk San Antonio, TX | 4.0 | 2.0 | 1357 | $1,500 | $1.11 | 43d | 1 | 0.44mi |
| 4445 Barberry Crk San Antonio, TX | 3.0 | 2.0 | 1400 | $1,650 | $1.18 | 4d | 1 | 0.55mi |
| 10227 Brad Fld San Antonio, TX | 4.0 | 2.5 | 1443 | $1,680 | $1.16 | 43d | 1 | 1.10mi |
| 10203 Sunset Fld San Antonio, TX | 3.0 | 2.0 | 1270 | $1,550 | $1.22 | 12d | 1 | 1.13mi |
| 11427 Long Trl San Antonio, TX | 3.0 | 2.5 | 1444 | $2,400 | $1.66 | 1d | 1 | 1.15mi |
| 10215 Athens Fld San Antonio, TX | 3.0 | 2.5 | 1160 | $1,499 | $1.29 | 21d | 1 | 1.19mi |
| 10247 Sunrise Fld San Antonio, TX | 3.0 | 2.5 | 1177 | $1,530 | $1.30 | 43d | 1 | 1.19mi |
| 2891 Cherry Field Dr San Antonio, TX | 3.0 | 1.0 | 1136 | $1,300 | $1.14 | 23d | 1 | 1.30mi |
| 2923 Black River Ln San Antonio, TX | 3.0 | 2.0 | 1251 | $1,520 | $1.22 | 43d | 1 | 1.35mi |
| 10203 Raven Field Dr San Antonio, TX | 3.0 | 2.0 | 1235 | $1,700 | $1.38 | 23d | 1 | 1.38mi |
| 11510 Hatchet Pass Dr San Antonio, TX | 3.0 | 2.0 | 1385 | $2,000 | $1.44 | 23d | 1 | 1.42mi |
| 11331 Two Wells Dr San Antonio, TX | 2.0 | 2.0 | 1103 | $1,350 | $1.22 | 23d | 1 | 1.43mi |
| 10239 Raven Field Dr San Antonio, TX | 3.0 | 2.5 | 1252 | $1,655 | $1.32 | 10d | 1 | 1.43mi |
| 2730 Mud Lake Dr San Antonio, TX | 3.0 | 2.0 | 1287 | $1,550 | $1.20 | 4d | 1 | 1.43mi |
| 2730 Mud Lake Dr San Antonio, TX | 3.0 | 2.0 | 1287 | $1,550 | $1.20 | 23d | 1 | 1.43mi |
| 10243 Raven Field Dr San Antonio, TX | 3.0 | 2.0 | 1023 | $1,700 | $1.66 | 43d | 1 | 1.44mi |
Listing history 21 events
-
2026-06-18days on market $45,000 Active 16 DOM
-
2026-06-17days on market $45,000 Active 15 DOM
-
2026-06-16days on market $45,000 Active 14 DOM
-
2026-06-15days on market $45,000 Active 13 DOM
-
2026-06-13days on market $45,000 Active 11 DOM
-
2026-06-09days on market $45,000 Active 7 DOM
-
2026-06-08days on market $45,000 Active 6 DOM
-
2026-06-07days on market $45,000 Active 5 DOM
-
2026-06-04days on market $45,000 Active 2 DOM
-
2026-06-03remarks 691-char remark
-
2026-06-03days on market $45,000 Active 1 DOM
-
2026-06-02days on market $45,000 Active 10 DOM
-
2026-06-01days on market $45,000 Active 9 DOM
-
2026-05-31days on market $45,000 Active 8 DOM
-
2026-05-24$45,000 Active
-
2023-09-29historical
-
2023-09-25$30,000 New
-
2022-02-18historical
-
2022-01-23$99,500 New
-
2021-03-15historical
-
2021-02-09$85,000 New
ⓘ Source: listings_history table (triggers on properties + properties_extension) + one-shot
backfill from property_details.listing_events for pre-trigger history.
Tax reassessment forecast TX · Resets to sale price
- Current annual tax
- $1,329 · $111/mo
- Projected year-2 tax
- $1,329 · $111/mo
- Expected delta
- $0/yr ($0/mo · 0.0%)
ⓘ Screening estimate from a state-policy table — verify with the county assessor before closing.
Climate risk First Street
- Flood 1/10 Low FEMA zone X (unshaded) · 0% chance over 30 yrs
- Wildfire 5/10 Major
- Heat 8/10 Severe 7 d/yr ≥108°F today · 22 d/yr by 30 yrs out
- Wind 7/10 Severe 78% chance of damaging wind over 30 yrs
- Air quality 2/10 Low 1 unhealthy d/yr today · 1 by 30 yrs out
Nearby sold comps map
Loading sold comps map…
Walkable amenities ~0.75 mi
Loading nearby amenities…
Taxation est. · year 1
- Rental income
- $18,447
- − Mortgage interest
- −$2,521
- − Property taxes
- −$1,329
- − Insurance
- −$225
- − Repairs & maintenance
- −$1,476
- − Management
- −$1,476
- − Depreciation
- −$1,309
- Taxable income
- $10,111
- Est. tax owed @ 24.0%
- −$2,427
- After-tax cash flow
- $7,760/yr
For passive investors: Depreciation is non-cash, so a rental often shows a tax loss while cash-flowing — sheltering income. Rental losses are passive: they offset passive income freely, and up to $25,000/yr can offset ordinary (W-2) income if you actively participate and your MAGI is under $100k (phasing out to $0 by $150k); unused losses carry forward. On sale, claimed depreciation is recaptured at up to 25%, and gains may owe capital-gains tax (a 1031 exchange can defer both). Figures are a year-1 estimate at your 24.0% rate — not tax advice; consult a CPA.
Condition & rehab AI · 1 photo
This 2016 manufactured home in Camino Creek Mobile Home Community is in good condition with recent renovations and upgrades. It is move-in ready with a good curb appeal and potential for further value-add improvements.
Value-add opportunities
- Both Landscaping and curb appeal improvements — Enhances curb appeal and can attract more buyers/renters.
- Both Add smart home features — Improves convenience and can be a selling point for buyers.
- Both Install energy-efficient windows — Reduces energy costs and enhances home value.
- Both Add a smart thermostat — Improves comfort and can be a selling point for buyers.
- Both Install a smart security system — Enhances safety and can be a selling point for buyers.
- Both Add a smart lighting system — Enhances comfort and can be a selling point for buyers.
Renovation cost estimate screening
Value-add ROI direction
- Both Landscaping and curb appeal improvements — Enhances curb appeal and can attract more buyers/renters. ↑
- Both Add smart home features — Improves convenience and can be a selling point for buyers. ↑
- Both Install energy-efficient windows — Reduces energy costs and enhances home value. ↑
- Both Add a smart thermostat — Improves comfort and can be a selling point for buyers. ↑
- Both Install a smart security system — Enhances safety and can be a selling point for buyers. ↑
- Both Add a smart lighting system — Enhances comfort and can be a selling point for buyers. ↑
ⓘ Cost ranges are severity-bucket heuristics (US national rule-of-thumb). Get contractor quotes + a written scope before underwriting a rehab budget.
Schools (NCES district)
- District
- Southwest ISD
- NCES district ID
- 4840950
- Math proficiency
- 21% ▼ -21.00%
- Reading proficiency
- 31% ▼ -5.00%
- Median HH income
- $43,362
- Composite
- 22.22/100
- National rank
- #8153
- State rank
- #701 of 826 in TX
Livability — San Antonio
- Score
- 80/100
- State rank
- #31
- US rank
- #1616
Category grades
Schools grade is shown separately in the Schools card above.
Census & demographics
- County
- Bexar County · 1,990,555 people
- City population
- 1,806,925
- Metro
- San Antonio-New Braunfels, TX
- Population (ZIP)
- 96,015
- Household income
- $90,029
- Rent vs Own
- Severe rent burden
- 2466.0
Population outlook (Bexar County) Hauer SSP2
- Today (2025)
- 2,336,851 people
- By 2030
- 2,560,728 · +9.6%
- By 2040
- 3,020,569 · +29.3%
- By 2050
- 3,493,522 · +49.5%
- By 2075
- 4,668,459 · +99.8%
- By 2100
- 5,533,242 · +136.8%
Race, ethnicity, and origin ACS 2023
- Neighborhood character
- Majority Hispanic (64%)
- Race & ethnicity
- Hispanic / Latino 64% Two or more races 27% White 20% Black 9% Asian 2%
- Hispanic origin (detail)
- Mexican 53% Puerto Rican 2%
- Common ancestry
- Slovak 1% Lithuanian 1% Romanian 1%
- Foreign-born
- 9% · Canada, Vietnam
- Languages at home
- 66% English-only · Spanish 30% Arabic 1% Tagalog/Filipino 1%
Political lean MEDSL · Bexar
- 2024 margin
- Lean D (+9.8) · D 54.3% · R 44.6% · Other 1.1%
- 2008→2024 swing
- +4.2pp toward D · 2008: 5.6pp · 2024: 9.8pp
- All cycles
- 2024: D+9.8 2020: D+18.2 2016: D+13.5 2012: D+4.6 2008: D+5.6
Not yet ingested
- Civics
- —
Market trends
- HPI YoY
- ▼ -53.31%
- Current HPI
- 234.7931
- Rent YoY
- ▼ -3.02%
- Metro
- San Antonio-New Braunfels, TX
- State GDP YoY
- ▲ 3.95%
- F500 in state
- 110
Industry mix (Fortune 500 HQ in TX)
| Industry | F500 HQs | Revenue |
|---|---|---|
| Energy | 16 | $1,198B |
|
||
| Technology | 5 | $198B |
|
||
| Engineering / Construction | 4 | $72B |
|
||
| Energy Services | 3 | $60B |
|
||
| Utilities | 3 | $41B |
|
||
| Healthcare | 2 | $330B |
|
||
Price history
-47.1% since first listed7 events — show timeline
- 2026-05-24 Listed $45,000 FSBO.com
- 2023-09-29 Listing Removed — LERA
- 2023-09-25 Listed $30,000 LERA
- 2022-02-18 Listing Removed — LERA
- 2022-01-23 Listed $99,500 LERA
- 2021-03-15 Listing Removed — LERA
- 2021-02-09 Listed $85,000 LERA
Property tax history
-0.9%/yrLatest (2025): $1,329 · -0.9% YoY. Source: county tax records.
Cash-flow waterfall
monthlySold comps — $/sqft
last 12 mo · ≤1 miLoading sold comps…