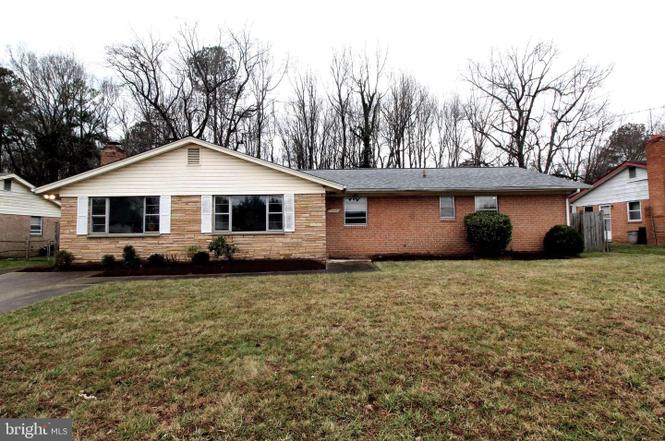
7015 Dower House Rd · Rosaryville, MD
Flood risk 1/10 · Minimal
- FEMA flood zone
- X (unshaded)
- Chance of flooding over 30 yrs
- 0.0%
- Est. flood insurance / yr
- $507 – $1,088
Fire risk 4/10 · Minor
- Est. fire insurance / yr
- $755 – $1,403
Heat risk 8/10 · Major
- Hot days now (above 103°F)
- 7 days/yr
- Hot days in 30 yrs
- 16 days/yr
Wind risk 5/10 · Moderate
- Chance of severe wind over 30 yrs
- 25.0%
Air-quality risk 2/10 · Minimal
- Unhealthy air days now
- 2 days/yr
- Unhealthy air days in 30 yrs
- 2 days/yr
Risk factors via First Street. Map © Google.
Why this score? — see what drove the D+ grade
The composite is a weighted blend of 9 inputs, each scored 0–100. Each bar is that input's sub-score; the figure is the points it added to the 100-point composite (weight × sub-score).
- Cash flow +14.5/30.0
- ARV discount +12.1/15.0
- Rent growth +5.0/5.0
- DSCR +4.4/10.0
- 1% rule +3.8/10.0
- Livability +3.0/5.0
- Condition / age +2.5/5.0
- Schools +1.7/10.0
- Appreciation +0.0/10.0
$380,000
🖨 Deal sheet (PDF) 📄 Offer letter ✓ Due diligence
Listing remarks
* BACK ON MARKET BUYER UNABLE TO PERFORM! Lovely 4 bedroom rambler nestled on a beautiful level lot with a spacious back yard. Property has many upgrades that feature stainless steel appliances, new luxury vinyl flooring, gas heat, central ac. Minutes from Pennsylvania Ave and county admin offices. Estate sale "as is"
Key facts
- 0.23 acre lot
- Built 1967
- Listed 14 days
Neighborhood map
What this means for you Summary
Snapshot
- This is a 4-bed/2.0-bath single-family listed at $380k.
Deal economics
- At list price, monthly cash flow is $87 ($1k/yr) — positive.
- The deal already cash-flows at list — no discount required.
- To meet the 1% rule (rent ≥ 1% of price), the offer needs to be $333k (12.4% below list).
- Recommended offer: $333k (12.4% below list) — sets the bar for 1% rule.
- Cap rate 6.6% vs local median 4.1% in Rosaryville — top-decile yield for the area; either an underpriced asset or a hidden risk that comps aren't pricing in. Stress-test before assuming the spread holds.
Location & tenants
- Location reads 60/100 on livability (#357 in MD) — a middle-class / working-renter tenant base. Strengths: employment A+, housing A+; Watch: amenities F, commute F, cost of living F.
- Prince George'S County Public Schools (suburban): math 8% / reading 24% proficiency, ranked #21 of 24 in MD (top 88%) — low school quality limits family demand, transient renter base, plan for 1-2y turnover.
- Zoned schools: Melwood Elementary (math 5% / reading 17%, grade F, #581 of 860 statewide, top 68%, 450 students, 64% FRL); James Madison Middle (math 4% / reading 27%, grade F, #190 of 225 statewide, top 85%, 873 students, 62% FRL); Dr. Henry A. Wise Jr. High (math 17% / reading 38%, grade F, #158 of 222 statewide, top 71%, 2,257 students, 59% FRL).
- Market conditions: Rents rising fast (+9.8%/yr); 313 active listings in the ZIP; 2 comparable units currently listed for rent nearby; high-income renter base; 1,481 units permitted in Prince George's County in 2024 (0 in 5+ unit buildings).
Forward outlook
- Local home prices are declining (-3.0%/yr); year-one equity from $3k of loan paydown is wiped out by about $11k of value loss. Plan a longer hold.
- Prince George's County population projected at +18% by 2050 — long-run rental-demand tailwind backs the buy-and-hold thesis.
Negotiation context
- Only 14 days on market — expect competitive offers; lowballing is unlikely to land.
- 4 sale attempts with the ask held roughly flat each time — persistent listings suggest the price (not the market) is what's stuck; bring a comps-based counter.
- Current owner paid $116k; list at $380k implies a 226% gain — meaningful room to come down on a strong offer.
Risks & watch-outs
- Climate carrying-cost: moderate wind risk, 25% chance of damaging wind over 30y; extreme-heat days projected 7→16/yr by 2055 (HVAC capex compounding) — expect insurance premiums to compound above CPI over the hold.
Questions for the listing agent
- Built in 1967 — when were the roof, HVAC, electrical panel, plumbing, and water heater last replaced?
- Is there a deadline driving the sale (1031 exchange, divorce, estate, relocation)? That informs how much negotiation room exists.
- Schools are F-rated, which usually means shorter tenancies and higher turnover. Who's the typical renter profile here, and what's been the actual vacancy rate?
- The area grade is low — what's the realistic commute time and amenity access for the typical tenant pool here? Any planned neighborhood developments (good or bad) we should know about?
- What's the average days-on-market for RENTAL listings here right now (not sales)? A rising rental-DOM trend means longer vacancies and softer asking-rent achievability than the comps imply.
- What's the recent tenant-quality profile in this submarket — average credit score on applications, eviction rate, late-payment / NSF rate, and stable-employment percentage? A property-management company in the area should have these aggregated.
- How much new for-sale + rental construction is in the pipeline within 1–3 miles? Heavy new supply typically softens prices + rents 12–24 months out; constrained supply supports both.
Investment metrics
- 1% rule
- 0.88% ✗
- Cap rate
- 6.57%
- Cash-on-cash
- 0.98%
- DSCR
- 1.04
- GRM
- 9.5
CMA / ARV
- ARV (on-the-fly)
- $423,000
- Comps found
- 9
Show comp detail 9 sales within ~0.75 mi
| Address | Dist | Beds/Ba | Sqft | Sold | Price | $/sf | Match |
|---|---|---|---|---|---|---|---|
| 7015 Dower House Rd | 0.00mi | 4/2.0 | 1,800 (0%) | 1mo | $375,000 | $208 | 99 |
| 7105 Antock Pl | 0.16mi | 4/3.5 | 2,000 (+11%) | 9mo | $440,000 | $220 | 61 |
| 7207 Robin Hood Dr | 0.56mi | 4/2.5 | 1,862 (+3%) | 10mo | $437,075 | $235 | 57 |
| 7800 Locris Dr | 0.63mi | 3/2.5 (-1) | 1,814 (+1%) | 7mo | $410,000 | $226 | 56 |
| 9532 Sherwood Dr | 0.29mi | 3/2.0 (-1) | 1,638 (-9%) | 13mo | $463,000 | $283 | 56 |
| 7602 Locris Dr | 0.42mi | 4/2.5 | 2,066 (+15%) | 1mo | $364,000 | $176 | 53 |
| 7904 Rosaryville Rd | 0.73mi | 4/3.0 | 1,700 (-6%) | 2mo | $510,000 | $300 | 51 |
| 7206 Robin Hood Dr | 0.52mi | 5/3.0 (+1) | 1,960 (+9%) | 11mo | $655,000 | $334 | 42 |
| 7704 Parnu Ct | 0.49mi | 4/3.0 | 2,038 (+13%) | 15mo | $550,000 | $270 | 38 |
Match score weights: distance 35% · size 25% · config 20% · recency 20%. Top-matched comps best support the ARV.
Projected returns pro-forma
-3.0% appreciation · 8.0% rent growth · sell at horizon
- IRR
- -9.4%
- Equity multiple
- 0.64×
- Total profit
- $-38,482
- Equity at exit
- $56,659
- IRR
- 5.6%
- Equity multiple
- 1.50×
- Total profit
- $53,614
- Equity at exit
- $32,855
Cash invested: $106,400 (down + closing). Projections, not guarantees.
Landlord ↔ Tenant lean methodology
- Overall (STATE)
- 27 Tenant-Leaning
- State Maryland
- 27 Tenant-Leaning · D+14
- County
- — inherits STATE
- City
- — inherits STATE
ZIP-level market 20772
- Rents YoY
- 9.8%
- Active inventory
- 313
- Price-to-rent
- 9.5×
Monthly cashflow live
- Estimated rent
- $3,327 medium interval (Pro) →
- Mortgage (P&I)
- −$1,993
- Tax from tax record
- −$391 /mo · $4,690/yr
- Insurance
- −$158
- HOA
- −$0
- Vacancy / Maint / Mgmt
- −$699
- Net cashflow
- $87
Break-even live
Sensitivity live
| Price | -10% $302 | -5% $194 | +0% $87 | +5% $-21 | +10% $-129 |
|---|---|---|---|---|---|
| Rent | -10% $-176 | -5% $-45 | +0% $87 | +5% $218 | +10% $349 |
| Rate | -1.0pp $278 | -0.5pp $183 | base $87 | +0.5pp $-12 | +1.0pp $-112 |
UW: 25.0% down · 7.5% · 30yr · 1.5% tax · 5.0% vac · 8.0% maint · 8.0% mgmt
Financing live
Cash to close
- Down payment
- $95,000
- Closing costs
- $11,400
- Reserves months
- —
- Total cash needed
- —
Loan-product check · same deal, 3 products live
Conventional
25% down · 7.5% · 30yr
- Down + closing
- —
- Monthly P&I
- —
- Monthly cashflow
- —
- DSCR
- —
- Eligible?
- —
Personal DTI + credit; lowest rate.
DSCR
20% down · 8.5% · 30yr
- Down + closing
- —
- Monthly P&I
- —
- Monthly cashflow
- —
- DSCR
- —
- Eligible?
- —
No personal income docs; deal must DSCR.
Hard money
10% down · 12.0% · 12mo
- Down + closing
- —
- Monthly P&I
- —
- Monthly cashflow
- —
- DSCR
- —
- Eligible?
- —
Short-term bridge; refi at stabilization.
Rent comps 2 comps
| Address | Beds | Baths | Sqft | Rent | $/sqft | DOM | Units | Dist |
|---|---|---|---|---|---|---|---|---|
| 7614 Oakpost Ct Upper Marlboro, MD | 3.0 | 2.5 | 1416 | $2,150 | $1.52 | 45d | 1 | 0.56mi |
| 9810 Stonewood Ct Upper Marlboro, MD | 3.0 | 3.0 | 2426 | $3,700 | $1.53 | 45d | 1 | 1.38mi |
Listing history 15 events
-
2026-04-23status Pending
-
2026-04-22historical
-
2026-04-17status Active
-
2026-04-01status Pending
-
2026-03-31historical
-
2026-03-24status Active
-
2026-03-24historical Active Under Contract
-
2026-02-26status Pending
-
2026-02-25historical
-
2026-02-24status Active
-
2026-01-23historical
-
2026-01-23$380,000 Active
-
2026-01-21historical $380,000
-
1988-12-20soldstatus $116,500
-
1967-12-13soldstatus $26,900
ⓘ Source: listings_history table (triggers on properties + properties_extension) + one-shot
backfill from property_details.listing_events for pre-trigger history.
Tax reassessment forecast MD · Partial reset (capped growth)
- Current annual tax
- $4,690 · $391/mo
- Projected year-2 tax
- $4,690 · $391/mo
- Expected delta
- $0/yr ($0/mo · 0.0%)
ⓘ Screening estimate from a state-policy table — verify with the county assessor before closing.
Climate risk First Street
- Flood 1/10 Low FEMA zone X (unshaded) · 0% chance over 30 yrs
- Wildfire 4/10 Moderate
- Heat 8/10 Severe 7 d/yr ≥103°F today · 16 d/yr by 30 yrs out
- Wind 5/10 Major 25% chance of damaging wind over 30 yrs
- Air quality 2/10 Low 2 unhealthy d/yr today · 2 by 30 yrs out
Nearby sold comps map
Loading sold comps map…
Walkable amenities ~0.75 mi
Loading nearby amenities…
Taxation est. · year 1
- Rental income
- $39,927
- − Mortgage interest
- −$21,286
- − Property taxes
- −$4,690
- − Insurance
- −$1,900
- − Repairs & maintenance
- −$3,194
- − Management
- −$3,194
- − Depreciation
- −$11,055
- Taxable loss
- −$5,392
- Est. tax savings @ 24.0%
- +$1,294
- After-tax cash flow
- $2,333/yr
For passive investors: Depreciation is non-cash, so a rental often shows a tax loss while cash-flowing — sheltering income. Rental losses are passive: they offset passive income freely, and up to $25,000/yr can offset ordinary (W-2) income if you actively participate and your MAGI is under $100k (phasing out to $0 by $150k); unused losses carry forward. On sale, claimed depreciation is recaptured at up to 25%, and gains may owe capital-gains tax (a 1031 exchange can defer both). Figures are a year-1 estimate at your 24.0% rate — not tax advice; consult a CPA.
Schools (NCES district)
- District
- Prince George'S County Public Schools
- NCES district ID
- 2400510
- Math proficiency
- 8% ▼ -11.00%
- Reading proficiency
- 24% ▼ -9.00%
- Median HH income
- $73,967
- Composite
- 16.82/100
- National rank
- #9151
- State rank
- #21 of 24 in MD
Livability — Rosaryville
- Score
- 60/100
- State rank
- #357
- US rank
- #19348
Category grades
Schools grade is shown separately in the Schools card above.
Census & demographics
- Census place
- Rosaryville, MD
- County
- Prince Georges County · 919,866 people
- City population
- 2,846
- Metro
- Washington-Arlington-Alexandria, DC-VA-MD-WV
- Population (ZIP)
- 54,319
- Household income
- $139,403
- Rent vs Own
- Severe rent burden
- 524.0
Population outlook (Prince George's County) Hauer SSP2
- Today (2025)
- 1,005,426 people
- By 2030
- 1,048,416 · +4.3%
- By 2040
- 1,123,425 · +11.7%
- By 2050
- 1,183,220 · +17.7%
- By 2075
- 1,306,202 · +29.9%
- By 2100
- 1,408,179 · +40.1%
Race, ethnicity, and origin ACS 2023
- Neighborhood character
- Predominantly Black (78%)
- Race & ethnicity
- Black 78% White 10% Hispanic / Latino 7% Two or more races 5% Asian 1%
- Hispanic origin (detail)
- Mexican 1%
- Foreign-born
- 10% · Canada, China
- Languages at home
- 88% English-only · Spanish 5% French/Haitian/Cajun 1% Other Indo-European 1%
Political lean MEDSL · Prince George's
- 2024 margin
- Solid D (+75.2) · D 86.3% · R 11.2% · Other 2.5%
- 2008→2024 swing
- -3.3pp toward R · 2008: 78.5pp · 2024: 75.2pp
- All cycles
- 2024: D+75.2 2020: D+80.5 2016: D+81.0 2012: D+80.9 2008: D+78.5
Not yet ingested
- Civics
- —
Market trends
- HPI YoY
- ▼ -184.63%
- Current HPI
- 251.8236
- Rent YoY
- ▲ 9.80%
- Metro
- Washington-Arlington-Alexandria, DC-VA-MD-WV
- State GDP YoY
- ▲ 2.97%
- F500 in state
- 12
Industry mix (Fortune 500 HQ in MD)
| Industry | F500 HQs | Revenue |
|---|---|---|
| Aerospace / Defense | 1 | $71B |
|
||
| Utilities | 1 | $25B |
|
||
| Hotels | 1 | $24B |
|
||
| Consumer Goods | 1 | $7B |
|
||
| Real Estate | 1 | $6B |
|
||
| Chemicals | 1 | $2B |
|
||
Price history
+1312.6% since first listed15 events — show timeline
- 2026-04-23 Pending — BRIGHT MLS
- 2026-04-22 Listing Removed — BRIGHT MLS
- 2026-04-17 Relisted — BRIGHT MLS
- 2026-04-01 Pending — BRIGHT MLS
- 2026-03-31 Listing Removed — BRIGHT MLS
- 2026-03-24 Relisted — BRIGHT MLS
- 2026-03-24 Contingent — BRIGHT MLS
- 2026-02-26 Pending — BRIGHT MLS
- 2026-02-25 Listing Removed — BRIGHT MLS
- 2026-02-24 Relisted — BRIGHT MLS
- 2026-01-23 Listing Removed — BRIGHT MLS
- 2026-01-23 Listed $380,000 BRIGHT MLS
- 2026-01-21 Coming Soon $380,000 BRIGHT MLS
- 1988-12-20 Sold (Public Records) $116,500 Public Records
- 1967-12-13 Sold (Public Records) $26,900 Public Records
Property tax history
+6.3%/yrLatest (2025): $4,690 · +5.8% YoY. Source: county tax records.
Cash-flow waterfall
monthlySold comps — $/sqft
last 12 mo · ≤1 miLoading sold comps…