55 Londonderry Ln · Belfast, ME
Flood risk 1/10 · Minimal
- FEMA flood zone
- X (unshaded)
- Chance of flooding over 30 yrs
- 0.0%
- Est. flood insurance / yr
- $473 – $860
Fire risk 2/10 · Minimal
- Est. fire insurance / yr
- $669 – $1,243
Heat risk 3/10 · Minor
- Hot days now (above 91°F)
- 7 days/yr
- Hot days in 30 yrs
- 15 days/yr
Wind risk 6/10 · Moderate
- Chance of severe wind over 30 yrs
- 41.0%
Air-quality risk 1/10 · Minimal
- Unhealthy air days now
- 0 days/yr
- Unhealthy air days in 30 yrs
- 0 days/yr
Risk factors via First Street. Map © Google.
Why this score? — see what drove the B grade
The composite is a weighted blend of 9 inputs, each scored 0–100. Each bar is that input's sub-score; the figure is the points it added to the 100-point composite (weight × sub-score).
- Cash flow +30.0/30.0
- 1% rule +10.0/10.0
- DSCR +10.0/10.0
- ARV discount +7.5/15.0
- Schools +6.7/10.0
- Livability +4.1/5.0
- Rent growth +2.5/5.0
- Condition / age +2.5/5.0
- Appreciation +0.0/10.0
$99,900
🖨 Deal sheet 📄 Offer letter ✓ Due diligence
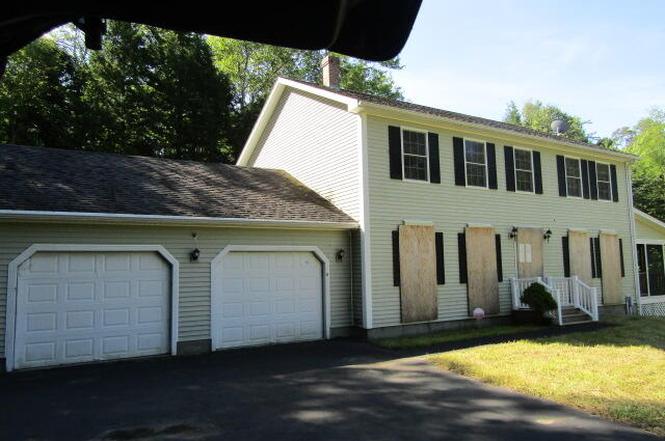
Listing remarks
CONTRACTOR OR INVESTOR PROJECT- This property has suffered water damage and there is organic growth throughput the first floor and basement. This is a short sale and is being sold as is, where is. Only cash offers will be considered.
Key facts
- 2.03 acre lot
- 2 garage spots
- Built 2004
Neighborhood map
What this means for you Summary
Snapshot
- This is a 4-bed/2.5-bath single-family listed at $100k.
Deal economics
- At list price, monthly cash flow is $770 ($9k/yr) — positive.
- The deal already cash-flows at list — no discount required.
- Meets the 1% rule at list price ($2k rent vs $100k).
- Cap rate 15.5% vs local median 2.5% in Belfast — top-decile yield for the area; either an underpriced asset or a hidden risk that comps aren't pricing in. Stress-test before assuming the spread holds.
Location & tenants
- Location reads 82/100 on livability (#14 in ME, #1,247 nationally) — a professional / high-income tenant draw. Strengths: crime A+, cost of living A+, health & safety A+; Watch: commute C-, schools D+, amenities F.
- RSU 71 (town): math 79% / reading 82% proficiency, ranked #85 of 112 in ME (top 76%) — strong family-tenant draw, lease renewals of 3-5y typical.
- Market conditions: 119 active listings in the ZIP; 143 units permitted in Waldo County in 2024 (0 in 5+ unit buildings).
Forward outlook
- Local home prices are declining (-3.0%/yr); year-one equity from $691 of loan paydown is wiped out by about $3k of value loss. Plan a longer hold.
- Waldo County population projected to shrink 9% by 2050 — rents likely to lag national; underwrite the cash flow, not the appreciation.
- At projected returns (-3.0% appreciation + 3.0% rent growth), your $28k cash investment doubles in ~4 years — after that, you're playing with house money.
Negotiation context
- Only 6 days on market — expect competitive offers; lowballing is unlikely to land.
- 4 sale attempts since 18y ago with the ask held roughly flat each time — persistent listings suggest the price (not the market) is what's stuck; bring a comps-based counter.
Risks & watch-outs
- Watch-outs: property tax is 3.1% of price.
- Climate carrying-cost: major wind risk, 41% chance of damaging wind over 30y — expect insurance premiums to compound above CPI over the hold.
Questions for the listing agent
- Property tax is high relative to price — has the assessment been appealed recently, and will the sale trigger a re-assessment?
- What does the HOA fee cover, when was the last increase, and are there any pending special assessments or reserve-fund shortfalls?
- Is there a deadline driving the sale (1031 exchange, divorce, estate, relocation)? That informs how much negotiation room exists.
- Schools are D-rated, which usually means shorter tenancies and higher turnover. Who's the typical renter profile here, and what's been the actual vacancy rate?
- What's the average days-on-market for RENTAL listings here right now (not sales)? A rising rental-DOM trend means longer vacancies and softer asking-rent achievability than the comps imply.
- What's the recent tenant-quality profile in this submarket — average credit score on applications, eviction rate, late-payment / NSF rate, and stable-employment percentage? A property-management company in the area should have these aggregated.
- How much new for-sale + rental construction is in the pipeline within 1–3 miles? Heavy new supply typically softens prices + rents 12–24 months out; constrained supply supports both.
Investment metrics
- 1% rule
- 2.06% ✓
- Cap rate
- 15.55%
- Cash-on-cash
- 33.04%
- DSCR
- 2.47
- GRM
- 4.0
CMA / ARV
- ARV (on-the-fly)
- $294,800
- Comps found
- 2
Show comp detail 2 sales within ~0.75 mi
| Address | Dist | Beds/Ba | Sqft | Sold | Price | $/sf | Match |
|---|---|---|---|---|---|---|---|
| 18 Edgecomb Rd | 0.42mi | 3/1.0 (-1) | 1,008 (-8%) | 14mo | $270,000 | $268 | 44 |
| 20 Edgecomb Rd | 0.45mi | 3/1.0 (-1) | 974 (-12%) | 13mo | $187,500 | $193 | 38 |
Match score weights: distance 35% · size 25% · config 20% · recency 20%. Top-matched comps best support the ARV.
Projected returns pro-forma
-3.0% appreciation · 3.0% rent growth · sell at horizon
- IRR
- 28.3%
- Equity multiple
- 2.18×
- Total profit
- $33,004
- Equity at exit
- $14,895
- IRR
- 35.8%
- Equity multiple
- 4.31×
- Total profit
- $92,454
- Equity at exit
- $8,638
Cash invested: $27,972 (down + closing). Projections, not guarantees.
Landlord ↔ Tenant lean methodology
- Overall (STATE)
- 41 Moderately Tenant-Leaning
- State Maine
- 41 Moderately Tenant-Leaning · D+2
- County
- — inherits STATE
- City
- — inherits STATE
ZIP-level market 04915
- Home prices YoY
- -15.1%
- Active inventory
- 119
- Price-to-rent
- 4.0×
Monthly cashflow live
- Estimated rent
- $2,061 medium interval (Pro) →
- Mortgage (P&I)
- −$524
- Tax from tax record
- −$254 /mo · $3,054/yr
- Insurance
- −$42
- HOA
- −$38
- Vacancy / Maint / Mgmt
- −$433
- Net cashflow
- $770
Break-even live
UW: 25.0% down · 7.5% · 30yr · 1.5% tax · 5.0% vac · 8.0% maint · 8.0% mgmt
Financing live
Cash to close
- Down payment
- $24,975
- Closing costs
- $2,997
- Reserves months
- —
- Total cash needed
- —
Loan-product check · same deal, 3 products live
Conventional
25% down · 7.5% · 30yr
- Down + closing
- —
- Monthly P&I
- —
- Monthly cashflow
- —
- DSCR
- —
- Eligible?
- —
Personal DTI + credit; lowest rate.
DSCR
20% down · 8.5% · 30yr
- Down + closing
- —
- Monthly P&I
- —
- Monthly cashflow
- —
- DSCR
- —
- Eligible?
- —
No personal income docs; deal must DSCR.
Hard money
10% down · 12.0% · 12mo
- Down + closing
- —
- Monthly P&I
- —
- Monthly cashflow
- —
- DSCR
- —
- Eligible?
- —
Short-term bridge; refi at stabilization.
HOA detail
- Monthly dues
- $38 · $456/yr
- Likely covers
- water
Listing history 10 events
-
2025-11-10status Pending
-
2025-11-04$99,900 Active
-
2025-10-17price $250,000
-
2025-09-08price $275,000
-
2022-12-27historical
-
2022-12-06price $329,000
-
2022-11-09price $375,000
-
2022-10-10$425,000 Active
-
2014-06-19$59,900
-
2008-09-23$375,000
ⓘ Source: listings_history table (triggers on properties + properties_extension) + one-shot
backfill from property_details.listing_events for pre-trigger history.
Tax reassessment forecast ME · Partial reset (capped growth)
- Current annual tax
- $3,054 · $254/mo
- Projected year-2 tax
- $3,054 · $254/mo
- Expected delta
- $0/yr ($0/mo · 0.0%)
ⓘ Screening estimate from a state-policy table — verify with the county assessor before closing.
Climate risk First Street
- Flood 1/10 Low FEMA zone X (unshaded) · 0% chance over 30 yrs
- Wildfire 2/10 Low
- Heat 3/10 Moderate 7 d/yr ≥91°F today · 15 d/yr by 30 yrs out
- Wind 6/10 Major 41% chance of damaging wind over 30 yrs
- Air quality 1/10 Low 0 unhealthy d/yr today · 0 by 30 yrs out
Nearby sold comps map
Loading sold comps map…
Walkable amenities ~0.75 mi
Loading nearby amenities…
Taxation est. · year 1
- Rental income
- $24,733
- − Mortgage interest
- −$5,596
- − Property taxes
- −$3,054
- − Insurance
- −$500
- − Repairs & maintenance
- −$1,979
- − Management
- −$1,979
- − HOA
- −$456
- − Depreciation
- −$2,906
- Taxable income
- $8,264
- Est. tax owed @ 24.0%
- −$1,983
- After-tax cash flow
- $7,260/yr
For passive investors: Depreciation is non-cash, so a rental often shows a tax loss while cash-flowing — sheltering income. Rental losses are passive: they offset passive income freely, and up to $25,000/yr can offset ordinary (W-2) income if you actively participate and your MAGI is under $100k (phasing out to $0 by $150k); unused losses carry forward. On sale, claimed depreciation is recaptured at up to 25%, and gains may owe capital-gains tax (a 1031 exchange can defer both). Figures are a year-1 estimate at your 24.0% rate — not tax advice; consult a CPA.
Schools (NCES district)
- District
- RSU 71
- NCES district ID
- 2314822
- Math proficiency
- 79% ▲ 55.00%
- Reading proficiency
- 82% ▲ 34.00%
- Median HH income
- $43,774
- Composite
- 67.47/100
- National rank
- #374
- State rank
- #85 of 112 in ME
Livability — Belfast
- Score
- 82/100
- State rank
- #14
- US rank
- #1247
Category grades
Schools grade is shown separately in the Schools card above.
Census & demographics
- Census place
- Belfast, ME
- City population
- 9,030
- Population (ZIP)
- 9,030
Population outlook (Waldo County) Hauer SSP2
- Today (2025)
- 39,611 people
- By 2030
- 39,475 · -0.3%
- By 2040
- 38,245 · -3.4%
- By 2050
- 36,078 · -8.9%
- By 2075
- 29,774 · -24.8%
- By 2100
- 22,172 · -44.0%
Race, ethnicity, and origin ACS 2023
- Neighborhood character
- Predominantly White (89%)
- Race & ethnicity
- White 89% Two or more races 6% Hispanic / Latino 1%
- Common ancestry
- Lithuanian 8% Slovak 3% Italian 3%
- Foreign-born
- 4% · Canada
- Languages at home
- 96% English-only · French/Haitian/Cajun 2% Chinese 1%
Political lean MEDSL · Waldo
- 2024 margin
- Toss-up / Even · D 50.4% · R 47.0% · Other 2.6%
- 2008→2024 swing
- -8.3pp toward R · 2008: 11.6pp · 2024: 3.4pp
- All cycles
- 2024: D+3.4 2020: D+4.7 2016: D+0.3 2012: D+10.7 2008: D+11.6
Not yet ingested
- Civics
- —
Market trends
- HPI YoY
- ▼ -46.00%
- Current HPI
- 258.9162
- Rent YoY
- —
- Metro
- —
- State GDP YoY
- —
- F500 in state
- 0
Price history
-73.4% since first listed10 events — show timeline
- 2025-11-10 Pending — MREIS
- 2025-11-04 Listed $99,900 MREIS
- 2025-10-17 Price Changed $250,000 MREIS
- 2025-09-08 Price Changed $275,000 MREIS
- 2022-12-27 Delisted — MREIS
- 2022-12-06 Price Changed $329,000 MREIS
- 2022-11-09 Price Changed $375,000 MREIS
- 2022-10-10 Listed $425,000 MREIS
- 2014-06-19 Listed $59,900 MREIS
- 2008-09-23 Listed $375,000 MREIS
Property tax history
+4.3%/yrLatest (2025): $3,054 · +6.3% YoY. Source: county tax records.
Cash-flow waterfall
monthlySold comps — $/sqft
last 12 mo · ≤1 miLoading sold comps…