 Duplex
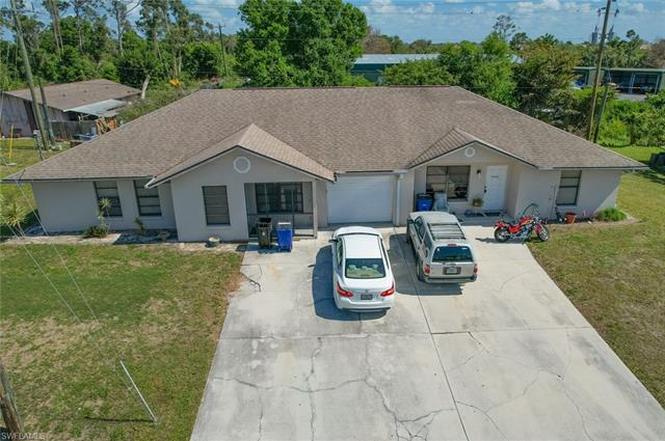
19029 / 19031 Holly Rd · San Carlos Park, FL
Flood risk 4/10 · Minor
- FEMA flood zone
- X (shaded)
- Chance of flooding over 30 yrs
- 0.21%
- Est. flood insurance / yr
- $507 – $1,088
Fire risk 1/10 · Minimal
- Est. fire insurance / yr
- $947 – $1,759
Heat risk 10/10 · Severe
- Hot days now (above 107°F)
- 7 days/yr
- Hot days in 30 yrs
- 29 days/yr
Wind risk 10/10 · Severe
- Chance of severe wind over 30 yrs
- 99.0%
Air-quality risk 2/10 · Minimal
- Unhealthy air days now
- 1 days/yr
- Unhealthy air days in 30 yrs
- 1 days/yr
Risk factors via First Street. Map © Google.
Why this score? — see what drove the D- grade
The composite is a weighted blend of 9 inputs, each scored 0–100. Each bar is that input's sub-score; the figure is the points it added to the 100-point composite (weight × sub-score).
- Cash flow +13.3/30.0
- ARV discount +7.5/15.0
- Schools +4.1/10.0
- DSCR +4.0/10.0
- 1% rule +3.7/10.0
- Livability +3.2/5.0
- Condition / age +2.5/5.0
- Rent growth +1.1/5.0
- Appreciation +0.0/10.0
$439,000
🖨 Deal sheet (PDF) 📄 Offer letter ✓ Due diligence
Multi-family units
County records classify this as Multi-Family (2-4 Unit). Listing-text estimate: 2 units. confirmed
Listing remarks
Return of investment right away: $ 34.320 (7.80% Gross Return) as annually rental income in place! Well maintained concrete block / stucco Duplex in good neighborhood of San Carlos Park with City-water. This solid income generating investment has 2 units: a spacious 3/2 with 1,343 sft with an enjoyable screened lanai and a single garage. The second unit is a 2/1 with a screened lanai as well. Citi water in place and assessments paid! The large driveway offers room for parking and the covered back yard is beloved by the tenants. Sitting on an elevated lot, there was never any issue with flooding! The roof was replaced late 2015, one A/C unit was renewed in 2021, the other is from 2016. Water
Key facts
- Large driveway
- Covered back yard
- Concrete block
Tags
Property features AI
Finance
- Other: Property contains 2 units (duplex)
- HOA & community: No HOA amenities listed; Community type: See remarks
Exterior
- Utilities: Central water; Sewer assessment paid; Cable available
- Home design: Residential income property; Duplex; Built in 1990; Located in SAN CARLOS PARK development; Zoning: TFC2
- Construction: Concrete block construction; Shingle roof; Double-hung, single-hung and sliding windows
- Exterior features: Stucco exterior; Oversize lot; Paved public road access
Interior
- Flooring: Tile
- Bathrooms: 3 full bathrooms
- Heating & cooling: Central electric heat; Central electric cooling; Ceiling fans
- Interior features: Tile flooring
Neighborhood map
What this means for you Summary
Snapshot
- This is a 2 × 2-bed/1.5-bath units multifamily listed at $439k.
Deal economics
- At list price, monthly cash flow is $-1 ($-12/yr) — negative. Per door: $-1/mo.
- To cash-flow at today's rent, offer at most $439k (0.0% below list).
- To meet the 1% rule (rent ≥ 1% of price), the offer needs to be $384k (12.6% below list).
- Recommended offer: $384k (12.6% below list) — sets the bar for 1% rule.
- Cap rate 6.3% vs local median 2.4% in San Carlos Park — top-decile yield for the area; either an underpriced asset or a hidden risk that comps aren't pricing in. Stress-test before assuming the spread holds.
Location & tenants
- Location reads 65/100 on livability (#662 in FL) — a middle-class / working-renter tenant base. Strengths: housing A+, employment A-, crime B+; Watch: schools F, amenities F, commute F.
- Lee (suburban): math 47% / reading 50% proficiency, ranked #42 of 73 in FL (top 58%) — families likely to look elsewhere, expect single-tenant / working-renter base with shorter leases.
- Market conditions: Rents falling (-5.7%/yr); 226 active listings in the ZIP; 30 comparable units currently listed for rent nearby; rentals at typical pace (median 22d on market — plan ~3-4 weeks tenant-placement turnaround); solid renter incomes; 15,411 units permitted in Lee County in 2024 (4,686 in 5+ unit buildings).
- At $3,839/mo this rent would consume 51% of the median local household income ($91k/yr) (locally 491% of renters already pay >50% of income on rent) — very limited rent-growth headroom before tenants either downsize or default.
Forward outlook
- Local home prices are declining (-3.0%/yr); year-one equity from $3k of loan paydown is wiped out by about $13k of value loss. Plan a longer hold.
- Lee County population projected at +44% by 2050 — long-run rental-demand tailwind backs the buy-and-hold thesis.
Negotiation context
- It's been on market 182 days — a 12% lower offer ($386k) is reasonable based on typical stale-listing flexibility.
- 3 sale attempts since 2y ago; this cycle's ask has dropped $40k (8%) from the opening price — seller is motivated, your offer sets the floor, not the list.
Risks & watch-outs
- Climate carrying-cost: severe wind risk, 99% chance of damaging wind over 30y; extreme-heat days projected 7→29/yr by 2055 (HVAC capex compounding) — expect insurance premiums to compound above CPI over the hold.
Questions for the listing agent
- What do current leases actually rent for vs. the listed asking? Can we see a recent rent roll and the last 12 months of T-12 income?
- It's been on market 182 days. Have you received any prior offers? Is the seller open to a 13% concession, seller financing, or rate buy-down credit?
- Can we see the unit-by-unit rent roll, current vacancy, and any below-market leases? What's the average tenancy length?
- What capital expenditures (roof, boiler, parking lot, exteriors) have been made in the last 5 years, and what's planned in the next 2?
- Why hasn't it sold? Are there any deal-killer items the seller is aware of (foundation, flood, title, zoning, code violations)?
- Is there a deadline driving the sale (1031 exchange, divorce, estate, relocation)? That informs how much negotiation room exists.
- Schools are F-rated, which usually means shorter tenancies and higher turnover. Who's the typical renter profile here, and what's been the actual vacancy rate?
- The area grade is low — what's the realistic commute time and amenity access for the typical tenant pool here? Any planned neighborhood developments (good or bad) we should know about?
- What's the average days-on-market for RENTAL listings here right now (not sales)? A rising rental-DOM trend means longer vacancies and softer asking-rent achievability than the comps imply.
- What's the recent tenant-quality profile in this submarket — average credit score on applications, eviction rate, late-payment / NSF rate, and stable-employment percentage? A property-management company in the area should have these aggregated.
- How much new apartment / multifamily construction is in the pipeline within 1–3 miles? Heavy new supply (>2% of stock underway) typically softens rents 12–24 months out; light construction supports rent growth.
Investment metrics
- 1% rule
- 0.87% ✗
- Cap rate
- 6.29%
- Cash-on-cash
- -0.01%
- DSCR
- 1.00
- GRM
- 9.5
CMA / ARV
No comps found within radius.
Projected returns pro-forma
-3.0% appreciation · 0.0% rent growth · sell at horizon
- IRR
- -19.7%
- Equity multiple
- 0.33×
- Total profit
- $-82,395
- Equity at exit
- $65,456
- IRR
- -20.8%
- Equity multiple
- 0.06×
- Total profit
- $-115,075
- Equity at exit
- $37,957
Cash invested: $122,920 (down + closing). Projections, not guarantees.
Landlord ↔ Tenant lean methodology
- Overall (STATE)
- 87 Strongly Landlord-Friendly
- State Florida
- 87 Strongly Landlord-Friendly · R+3
- County
- — inherits STATE
- City
- — inherits STATE
ZIP-level market 33967
- Home prices YoY
- -29.3%
- Rents YoY
- -5.7%
- Active inventory
- 226
- Price-to-rent
- 19.1×
Monthly cashflow live
- Estimated rent
- $3,839 high interval (Pro) →
- Mortgage (P&I)
- −$2,302
- Tax est. 1.5%
- −$549 /mo · $6,585/yr
- Insurance
- −$183
- HOA
- −$0
- Vacancy / Maint / Mgmt
- −$806
- Net cashflow
- $-1
Break-even live
Sensitivity live
| Price | -10% $302 | -5% $151 | +0% $-1 | +5% $-153 | +10% $-304 |
|---|---|---|---|---|---|
| Rent | -10% $-304 | -5% $-153 | +0% $-1 | +5% $151 | +10% $302 |
| Rate | -1.0pp $220 | -0.5pp $111 | base $-1 | +0.5pp $-115 | +1.0pp $-231 |
2-unit breakdown (identical units grouped — click to expand)
| Units | Beds | Baths | Est. rent |
|---|---|---|---|
| 2× units | 2 | 1.5 | $3,838 |
| #1 | 2 | 1.5 | $1,919 |
| #2 | 2 | 1.5 | $1,919 |
| Total (2 units) | $3,839 | ||
UW: 25.0% down · 7.5% · 30yr · 1.5% tax · 5.0% vac · 8.0% maint · 8.0% mgmt
Financing live
Cash to close
- Down payment
- $109,750
- Closing costs
- $13,170
- Reserves months
- —
- Total cash needed
- —
Loan-product check · same deal, 3 products live
Conventional
25% down · 7.5% · 30yr
- Down + closing
- —
- Monthly P&I
- —
- Monthly cashflow
- —
- DSCR
- —
- Eligible?
- —
Personal DTI + credit; lowest rate.
DSCR
20% down · 8.5% · 30yr
- Down + closing
- —
- Monthly P&I
- —
- Monthly cashflow
- —
- DSCR
- —
- Eligible?
- —
No personal income docs; deal must DSCR.
Hard money
10% down · 12.0% · 12mo
- Down + closing
- —
- Monthly P&I
- —
- Monthly cashflow
- —
- DSCR
- —
- Eligible?
- —
Short-term bridge; refi at stabilization.
Rent comps 30 comps
| Address | Beds | Baths | Sqft | Rent | $/sqft | DOM | Units | Dist |
|---|---|---|---|---|---|---|---|---|
| 18606 Cedar Dr E Fort Myers, FL | 3.0 | 2.0 | 1698 | $2,676 | $1.58 | 4d | 1 | 0.26mi |
| 18521 Olive Rd Fort Myers, FL | 3.0 | 2.0 | 1798 | $2,396 | $1.33 | 4d | 1 | 0.33mi |
| 8157 Albatross Rd Fort Myers, FL | 4.0 | 2.0 | 1667 | $3,095 | $1.86 | 4d | 1 | 0.47mi |
| 8157 Albatross Rd Fort Myers, FL | 4.0 | 2.0 | 1700 | $3,095 | $1.82 | 24d | 1 | 0.47mi |
| 8430 Southbridge Dr #3 Estero, FL | 3.0 | 2.0 | 1805 | $4,447 | $2.46 | 24d | 1 | 0.51mi |
| 7340 Stoney Grove CIR Fort Myers, FL | 1.0–3.0 | 1.0–2.0 | 1106 | $2,595 | $2.35 | 3d | 39 | 0.53mi |
| 18477 Sunflower Rd Fort Myers, FL | 3.0 | 2.0 | 1548 | $2,100 | $1.36 | 22d | 1 | 0.57mi |
| 18477 Sunflower Rd Fort Myers, FL | 3.0 | 2.0 | 2120 | $2,100 | $0.99 | 17d | 1 | 0.57mi |
| 18145 Baruch Dr Fort Myers, FL | 4.0 | 2.0 | 1818 | $2,531 | $1.39 | 4d | 1 | 0.67mi |
| 7286 Jonas Rd Fort Myers, FL | 3.0 | 2.0 | 1427 | $2,556 | $1.79 | 17d | 1 | 0.67mi |
| 18125 Hilda Dr Fort Myers, FL | 3.0 | 2.0 | 1517 | $2,056 | $1.36 | 15d | 1 | 0.69mi |
| 8357 Matanzas Rd Fort Myers, FL | 4.0 | 2.0 | 1828 | $3,095 | $1.69 | 24d | 1 | 0.78mi |
| 18422 Huckleberry Rd Fort Myers, FL | 3.0 | 2.5 | 2028 | $2,975 | $1.47 | 24d | 1 | 0.79mi |
| 18911 Bay Woods Lake Dr #201 Fort Myers, FL | 3.0 | 2.0 | 2348 | $3,000 | $1.28 | 24d | 1 | 0.83mi |
| 8418 Wren Rd Fort Myers, FL | 3.0 | 2.0 | 1502 | $2,246 | $1.50 | 3d | 1 | 0.89mi |
| 18205 Apple Rd Fort Myers, FL | 3.0 | 2.0 | 1588 | $2,646 | $1.67 | 4d | 1 | 0.98mi |
| 7135 Greenwood Park Cir Fort Myers, FL | 3.0 | 2.5 | 1730 | $2,350 | $1.36 | 24d | 1 | 1.07mi |
| 8792 Largo Mar Dr Estero, FL | 4.0 | 3.0 | 2568 | $8,000 | $3.12 | 22d | 1 | 1.11mi |
| 8847 Largo Mar Dr Estero, FL | 3.0 | 2.0 | 2099 | $4,500 | $2.14 | 20d | 1 | 1.19mi |
| 7252 Pebble Beach Rd Fort Myers, FL | 4.0 | 2.0 | 1683 | $3,500 | $2.08 | 4d | 1 | 1.25mi |
| 9051 Astonia Way Estero, FL | 4.0 | 3.5 | 2696 | $8,500 | $3.15 | 24d | 1 | 1.29mi |
| 19809 Maddelena Cir Estero, FL | 3.0 | 2.0 | 2348 | $3,500 | $1.49 | 24d | 1 | 1.33mi |
| 3783 Pino Vista Way #201 Estero, FL | 3.0 | 2.0 | 1523 | $3,300 | $2.17 | 24d | 1 | 1.33mi |
| 3702 Pino Vista Way #3 Estero, FL | 3.0 | 2.0 | 1610 | $2,300 | $1.43 | 4d | 1 | 1.35mi |
| 18500 Winter Haven Rd Fort Myers, FL | 3.0 | 2.0 | 1523 | $2,100 | $1.38 | 22d | 1 | 1.42mi |
| 19639 Villa Rosa Loop Estero, FL | 3.0 | 2.0 | 2075 | $2,600 | $1.25 | 12d | 1 | 1.43mi |
| 17464 Dumont Dr Fort Myers, FL | 4.0 | 2.0 | 1500 | $2,200 | $1.47 | 24d | 1 | 1.44mi |
| 17366 Ithaca Dr #368 Fort Myers, FL | 3.0 | 2.0 | 2489 | $2,200 | $0.88 | 24d | 1 | 1.49mi |
| 7435 Albany Rd Fort Myers, FL | 5.0 | 3.0 | 2147 | $2,700 | $1.26 | 15d | 1 | 1.49mi |
| 9135 Astonia Way Estero, FL | 4.0 | 2.5 | 2539 | $3,000 | $1.18 | 24d | 1 | 1.50mi |
Listing history 6 events
-
2026-05-03status Pending
-
2026-03-12status Active
-
2026-01-05price $439,000
-
2025-10-21$479,000 Active
-
2024-04-12price $580,000
-
2024-02-26$599,000 Active
ⓘ Source: listings_history table (triggers on properties + properties_extension) + one-shot
backfill from property_details.listing_events for pre-trigger history.
Climate risk First Street
- Flood 4/10 Moderate FEMA zone X (shaded) · 21% chance over 30 yrs
- Wildfire 1/10 Low
- Heat 10/10 Extreme 7 d/yr ≥107°F today · 29 d/yr by 30 yrs out
- Wind 10/10 Extreme 99% chance of damaging wind over 30 yrs
- Air quality 2/10 Low 1 unhealthy d/yr today · 1 by 30 yrs out
Nearby sold comps map
Loading sold comps map…
Walkable amenities ~0.75 mi
Loading nearby amenities…
Taxation est. · year 1
- Rental income
- $46,068
- − Mortgage interest
- −$24,591
- − Property taxes
- −$6,585
- − Insurance
- −$2,195
- − Repairs & maintenance
- −$3,685
- − Management
- −$3,685
- − Depreciation
- −$12,771
- Taxable loss
- −$7,445
- Est. tax savings @ 24.0%
- +$1,787
- After-tax cash flow
- $1,774/yr
For passive investors: Depreciation is non-cash, so a rental often shows a tax loss while cash-flowing — sheltering income. Rental losses are passive: they offset passive income freely, and up to $25,000/yr can offset ordinary (W-2) income if you actively participate and your MAGI is under $100k (phasing out to $0 by $150k); unused losses carry forward. On sale, claimed depreciation is recaptured at up to 25%, and gains may owe capital-gains tax (a 1031 exchange can defer both). Figures are a year-1 estimate at your 24.0% rate — not tax advice; consult a CPA.
Schools (NCES district)
- District
- Lee
- NCES district ID
- 1201080
- Math proficiency
- 47% ▼ -11.00%
- Reading proficiency
- 50% ▼ -4.00%
- Median HH income
- $49,518
- Composite
- 41.49/100
- National rank
- #3458
- State rank
- #42 of 73 in FL
Livability — San Carlos Park
- Score
- 65/100
- State rank
- #662
- US rank
- #13354
Category grades
Schools grade is shown separately in the Schools card above.
Census & demographics
- Census place
- San Carlos Park, FL
- County
- Lee County · 788,662 people
- City population
- 27,337
- Metro
- Cape Coral-Fort Myers, FL
- Population (ZIP)
- 28,341
- Household income
- $90,519
- Rent vs Own
- Severe rent burden
- 491.0
Population outlook (Lee County) Hauer SSP2
- Today (2025)
- 871,946 people
- By 2030
- 955,468 · +9.6%
- By 2040
- 1,113,587 · +27.7%
- By 2050
- 1,256,891 · +44.1%
- By 2075
- 1,560,270 · +78.9%
- By 2100
- 1,726,848 · +98.0%
Race, ethnicity, and origin ACS 2023
- Neighborhood character
- Predominantly White (67%)
- Race & ethnicity
- White 67% Hispanic / Latino 23% Two or more races 16% Asian 3% Black 3%
- Hispanic origin (detail)
- Mexican 8% Puerto Rican 2% Cuban 4% Dominican 1%
- Common ancestry
- Romanian 3% Lithuanian 2% Slovak 2%
- Foreign-born
- 14% · Canada, Jamaica, Vietnam
- Languages at home
- 79% English-only · Spanish 16% Other Indo-European 1% Vietnamese 1%
Political lean MEDSL · Lee
- 2024 margin
- Strong R (+28.4) · D 35.5% · R 63.9%
- 2008→2024 swing
- -18.0pp toward R · 2008: -10.4pp · 2024: -28.4pp
- All cycles
- 2024: R+28.4 2020: R+19.2 2016: R+20.4 2012: R+16.6 2008: R+10.4
Not yet ingested
- Civics
- —
Market trends
- HPI YoY
- ▼ -123.07%
- Current HPI
- 296.5923
- Rent YoY
- ▼ -5.68%
- Metro
- Cape Coral-Fort Myers, FL
- State GDP YoY
- ▲ 3.28%
- F500 in state
- 36
Industry mix (Fortune 500 HQ in FL)
| Industry | F500 HQs | Revenue |
|---|---|---|
| Industrial Technology | 2 | $29B |
|
||
| Insurance | 2 | $17B |
|
||
| Retail | 1 | $60B |
|
||
| Technology Distribution | 1 | $58B |
|
||
| Homebuilding | 1 | $35B |
|
||
| Technology Manufacturing | 1 | $35B |
|
||
Price history
-26.7% since first listed6 events — show timeline
- 2026-05-03 Pending — BEARMLS
- 2026-03-12 Relisted — BEARMLS
- 2026-01-05 Price Changed $439,000 BEARMLS
- 2025-10-21 Listed $479,000 BEARMLS
- 2024-04-12 Price Changed $580,000 BEARMLS
- 2024-02-26 Listed $599,000 BEARMLS
Cash-flow waterfall
monthlySold comps — $/sqft
last 12 mo · ≤1 miLoading sold comps…