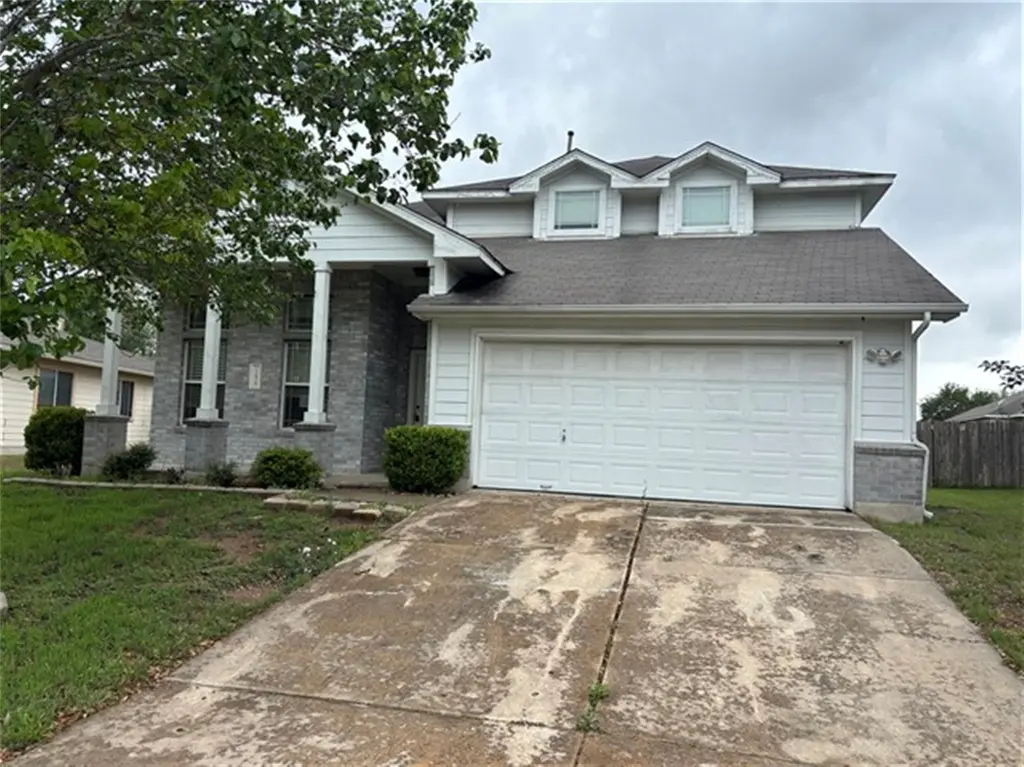
12828 Starbrimson Trl · Elgin, TX
Flood risk 1/10 · Minimal
- FEMA flood zone
- X (unshaded)
- Chance of flooding over 30 yrs
- 0.0%
- Est. flood insurance / yr
- $507 – $1,088
Fire risk 4/10 · Minor
- Est. fire insurance / yr
- $1,222 – $2,270
Heat risk 8/10 · Major
- Hot days now (above 109°F)
- 7 days/yr
- Hot days in 30 yrs
- 23 days/yr
Wind risk 8/10 · Major
- Chance of severe wind over 30 yrs
- 80.0%
Air-quality risk 1/10 · Minimal
- Unhealthy air days now
- 0 days/yr
- Unhealthy air days in 30 yrs
- 0 days/yr
Risk factors via First Street. Map © Google.
Why this score? — see what drove the C- grade
The composite is a weighted blend of 9 inputs, each scored 0–100. Each bar is that input's sub-score; the figure is the points it added to the 100-point composite (weight × sub-score).
- ARV discount +15.0/15.0
- Appreciation +10.0/10.0
- Cash flow +8.6/30.0
- 1% rule +5.1/10.0
- Livability +3.7/5.0
- Rent growth +3.3/5.0
- Condition / age +2.5/5.0
- DSCR +2.4/10.0
- Schools +2.0/10.0
$215,000
🖨 Deal sheet (PDF) 📄 Offer letter ✓ Due diligence
Listing remarks MLS
Super cute 3 bed 2 1/2 bath home located in a good neighborhood. House is close to pool and other amenities. Primary bed and bath are downstairs; other two bedrooms, full bath and bonus room are upstairs. Home is close to schools, shopping and entertainment. This property may qualify for Seller Financing (Vendee).
Key facts
- Close to schools
- Close to pool
- Close to shopping
Tags
Neighborhood map
What this means for you Summary
Snapshot
- This is a 3-bed/3.0-bath single-family listed at $215k.
Deal economics
- At list price, monthly cash flow is $-186 ($-2k/yr) — negative.
- To cash-flow at today's rent, offer at most $182k (15.3% below list).
- Meets the 1% rule at list price ($2k rent vs $215k).
- Recommended offer: $182k (15.3% below list) — sets the bar for cash-flow.
Location & tenants
- Location reads 74/100 on livability (#167 in TX, #4,404 nationally) — a middle-class / working-renter tenant base. Strengths: cost of living A+, housing A+, health & safety A+; Watch: schools F, amenities F, commute F.
- Elgin ISD (rural): math 17% / reading 26% proficiency, ranked #741 of 826 in TX (top 90%) — low school quality limits family demand, transient renter base, plan for 1-2y turnover; 67% free/reduced lunch — lower-income household profile, screen leases tightly.
- Market conditions: Rents rising (+3.1%/yr); 813 active listings in the ZIP; 14 comparable units currently listed for rent nearby; rentals at typical pace (median 22d on market — plan ~3-4 weeks tenant-placement turnaround); solid renter incomes; 17,121 units permitted in Travis County in 2024 (11,963 in 5+ unit buildings).
Forward outlook
- In year one you build about $23k of equity ($1k loan paydown + $22k appreciation (10.0% local appreciation)).
- Travis County population projected at +60% by 2050 — long-run rental-demand tailwind backs the buy-and-hold thesis.
- By year 2, paydown + projected appreciation supports a ~$37k cash-out refi (75% LTV) — recoverable capital for the next deal without selling this one.
Negotiation context
- It's been on market 70 days — a 6% lower offer ($202k) is reasonable based on typical stale-listing flexibility.
- 3 sale attempts since 6y ago; this cycle's ask has dropped $28k (11%) from the opening price — seller is motivated, your offer sets the floor, not the list.
Risks & watch-outs
- Watch-outs: property tax is 3.6% of price.
- Climate carrying-cost: severe wind risk, 80% chance of damaging wind over 30y; extreme-heat days projected 7→23/yr by 2055 (HVAC capex compounding) — expect insurance premiums to compound above CPI over the hold.
Questions for the listing agent
- What do current leases actually rent for vs. the listed asking? Can we see a recent rent roll and the last 12 months of T-12 income?
- It's been on market 70 days. Have you received any prior offers? Is the seller open to a 15% concession, seller financing, or rate buy-down credit?
- Property tax is high relative to price — has the assessment been appealed recently, and will the sale trigger a re-assessment?
- What does the HOA fee cover, when was the last increase, and are there any pending special assessments or reserve-fund shortfalls?
- Why hasn't it sold? Are there any deal-killer items the seller is aware of (foundation, flood, title, zoning, code violations)?
- Is there a deadline driving the sale (1031 exchange, divorce, estate, relocation)? That informs how much negotiation room exists.
- Schools are F-rated, which usually means shorter tenancies and higher turnover. Who's the typical renter profile here, and what's been the actual vacancy rate?
- What's the average days-on-market for RENTAL listings here right now (not sales)? A rising rental-DOM trend means longer vacancies and softer asking-rent achievability than the comps imply.
- What's the recent tenant-quality profile in this submarket — average credit score on applications, eviction rate, late-payment / NSF rate, and stable-employment percentage? A property-management company in the area should have these aggregated.
- How much new for-sale + rental construction is in the pipeline within 1–3 miles? Heavy new supply typically softens prices + rents 12–24 months out; constrained supply supports both.
Investment metrics
- 1% rule
- 1.01% ✓
- Cap rate
- 5.26%
- Cash-on-cash
- -3.70%
- DSCR
- 0.84
- GRM
- 8.2
CMA / ARV
- ARV (median comp)
- $317,183
- List price
- $215,000
- Delta
- -32.22%
- Verdict
- UNDERPRICED
- Comps
- 20 within 1.0 mi
Show comp detail 12 sales within ~0.75 mi
| Address | Dist | Beds/Ba | Sqft | Sold | Price | $/sf | Match |
|---|---|---|---|---|---|---|---|
| 12717 Wood Lily Trl | 0.15mi | 3/2.0 | 2,149 (-8%) | 1mo | $295,000 | $137 | 75 |
| 12820 Starbrimson Trl | 0.02mi | 4/2.5 (+1) | 2,277 (-2%) | 21mo | $308,737 | $136 | 70 |
| 12701 Waynespur Ln | 0.19mi | 3/2.0 | 2,149 (-8%) | 6mo | $315,000 | $147 | 68 |
| 17816 Honey Locust Ln | 0.35mi | 4/3.0 (+1) | 2,146 (-8%) | 2mo | $199,999 | $93 | 63 |
| 17705 Wild Lily Cv | 0.18mi | 4/2.5 (+1) | 2,277 (-2%) | 21mo | $289,900 | $127 | 62 |
| 12832 Waynespur Ln | 0.06mi | 3/2.0 | 2,149 (-8%) | 22mo | $320,000 | $149 | 62 |
| 23825 Glowing Embers Dr | 0.51mi | 4/2.5 (+1) | 2,162 (-7%) | 2mo | $258,990 | $120 | 55 |
| 18354 Basket Flower Bnd | 0.44mi | 3/2.5 | 2,103 (-10%) | 8mo | $298,000 | $142 | 54 |
| 18141 Basket Flower Bnd | 0.31mi | 3/2.5 | 2,131 (-9%) | 21mo | $340,000 | $160 | 52 |
| 17712 Wild Lily Cv | 0.22mi | 3/2.0 | 2,104 (-10%) | 22mo | $289,500 | $138 | 51 |
| 12801 Sago Palm Trl | 0.22mi | 4/2.5 (+1) | 2,632 (+13%) | 16mo | $360,000 | $137 | 48 |
| 12809 Sago Palm Trl | 0.21mi | 4/2.5 (+1) | 2,573 (+10%) | 23mo | $313,000 | $122 | 47 |
Match score weights: distance 35% · size 25% · config 20% · recency 20%. Top-matched comps best support the ARV.
Projected returns pro-forma
10.0% appreciation · 3.12% rent growth · sell at horizon
- IRR
- 21.7%
- Equity multiple
- 2.76×
- Total profit
- $105,818
- Equity at exit
- $193,689
- IRR
- 19.7%
- Equity multiple
- 6.35×
- Total profit
- $322,042
- Equity at exit
- $417,698
Cash invested: $60,200 (down + closing). Projections, not guarantees.
Landlord ↔ Tenant lean methodology
- Overall (STATE)
- 87 Strongly Landlord-Friendly
- State Texas
- 87 Strongly Landlord-Friendly · R+5
- County
- — inherits STATE
- City
- — inherits STATE
ZIP-level market 78621
- Home prices YoY
- 7.6%
- Rents YoY
- 3.1%
- Active inventory
- 813
- Price-to-rent
- 8.2×
Monthly cashflow live
- Estimated rent
- $2,181 high interval (Pro) →
- Mortgage (P&I)
- −$1,127
- Tax from tax record
- −$637 /mo · $7,644/yr
- Insurance
- −$90
- HOA
- −$55
- Vacancy / Maint / Mgmt
- −$458
- Net cashflow
- $-186
Break-even live
Sensitivity live
| Price | -10% $-64 | -5% $-125 | +0% $-186 | +5% $-247 | +10% $-308 |
|---|---|---|---|---|---|
| Rent | -10% $-358 | -5% $-272 | +0% $-186 | +5% $-100 | +10% $-13 |
| Rate | -1.0pp $-78 | -0.5pp $-131 | base $-186 | +0.5pp $-242 | +1.0pp $-298 |
UW: 25.0% down · 7.5% · 30yr · 1.5% tax · 5.0% vac · 8.0% maint · 8.0% mgmt
Financing live
Cash to close
- Down payment
- $53,750
- Closing costs
- $6,450
- Reserves months
- —
- Total cash needed
- —
Loan-product check · same deal, 3 products live
Conventional
25% down · 7.5% · 30yr
- Down + closing
- —
- Monthly P&I
- —
- Monthly cashflow
- —
- DSCR
- —
- Eligible?
- —
Personal DTI + credit; lowest rate.
DSCR
20% down · 8.5% · 30yr
- Down + closing
- —
- Monthly P&I
- —
- Monthly cashflow
- —
- DSCR
- —
- Eligible?
- —
No personal income docs; deal must DSCR.
Hard money
10% down · 12.0% · 12mo
- Down + closing
- —
- Monthly P&I
- —
- Monthly cashflow
- —
- DSCR
- —
- Eligible?
- —
Short-term bridge; refi at stabilization.
Rent comps 14 comps
| Address | Beds | Baths | Sqft | Rent | $/sqft | DOM | Units | Dist |
|---|---|---|---|---|---|---|---|---|
| 17812 Prairie Verbena Ln Elgin, TX | 3.0 | 2.5 | 2049 | $2,199 | $1.07 | 44d | 1 | 0.15mi |
| 13305 Banquete St Elgin, TX | 4.0 | 2.0 | 1707 | $1,995 | $1.17 | 44d | 1 | 0.42mi |
| 13520 Knights Branch Dr Elgin, TX | 3.0 | 2.5 | 1600 | $1,850 | $1.16 | 3d | 1 | 0.44mi |
| 13121 Blackeyed Susan Trl Elgin, TX | 4.0 | 2.0 | 1586 | $1,800 | $1.13 | 18d | 1 | 0.46mi |
| 13725 Knights Branch Dr Elgin, TX | 4.0 | 2.5 | 1800 | $2,100 | $1.17 | 25d | 1 | 0.49mi |
| 13501 Mussel Run Elgin, TX | 4.0 | 2.0 | 1667 | $1,800 | $1.08 | 17d | 1 | 0.51mi |
| 14129 Tordillo Dr Elgin, TX | 4.0 | 2.5 | 1874 | $2,675 | $1.43 | 25d | 1 | 0.66mi |
| 14129 Tordillo Dr Unit NA Elgin, TX | 4.0 | 2.5 | 1874 | $2,595 | $1.38 | 5d | 1 | 0.66mi |
| 13249 Illumination Rd Unit R2 Elgin, TX | 4.0 | 3.0 | 2000 | $600 | $0.30 | 18d | 1 | 0.83mi |
| 13249 Illumination Rd Unit R3 Elgin, TX | 4.0 | 3.0 | 2000 | $560 | $0.28 | 23d | 1 | 0.83mi |
| 13249 Illumination Rd Unit R4 Elgin, TX | 4.0 | 3.0 | 2000 | $589 | $0.29 | 44d | 1 | 0.84mi |
| 23408 Tiny Moons Way Elgin, TX | 4.0 | 2.5 | 2000 | $1,960 | $0.98 | 21d | 1 | 0.85mi |
| 13501 Sierra Wind Ln Elgin, TX | 4.0 | 2.5 | 2066 | $2,500 | $1.21 | 21d | 1 | 0.97mi |
| 18436 Weatherby Ln Elgin, TX | 4.0 | 2.5 | 2095 | $2,000 | $0.95 | 5d | 1 | 1.32mi |
HOA detail
- Monthly dues
- $55 · $660/yr
- Likely covers
- pool
Listing history 24 events
-
2026-06-21days on market $215,000 Active 70 DOM
-
2026-06-18days on market $215,000 Active 67 DOM
-
2026-06-17days on market $215,000 Active 66 DOM
-
2026-06-16pricedays on market $215,000 Active 65 DOM
-
2026-06-15days on market $230,400 Active 64 DOM
-
2026-06-13days on market $230,400 Active 62 DOM
-
2026-06-09days on market $230,400 Active 58 DOM
-
2026-06-08days on market $230,400 Active 57 DOM
-
2026-06-07days on market $230,400 Active 56 DOM
-
2026-06-04days on market $230,400 Active 53 DOM
-
2026-06-03days on market $230,400 Active 52 DOM
-
2026-06-02days on market $230,400 Active 51 DOM
-
2026-06-01days on market $230,400 Active 50 DOM
-
2026-05-31days on market $230,400 Active 49 DOM
-
2026-05-15price $230,400 315-char remark
Show marketing remark (315 chars)
Super cute 3 bed 2 1/2 bath home located in a good neighborhood. House is close to pool and other amenities. Primary bed and bath are downstairs; other two bedrooms, full bath and bonus room are upstairs. Home is close to schools, shopping and entertainment. This property may qualify for Seller Financing (Vendee).
-
2026-04-12$242,500 Active 315-char remark
Show marketing remark (315 chars)
Super cute 3 bed 2 1/2 bath home located in a good neighborhood. House is close to pool and other amenities. Primary bed and bath are downstairs; other two bedrooms, full bath and bonus room are upstairs. Home is close to schools, shopping and entertainment. This property may qualify for Seller Financing (Vendee).
-
2025-06-07price
-
2025-05-09price
-
2025-05-01price
-
2025-02-13Active
-
2020-06-17soldstatus
-
2020-06-12soldstatus Sold
-
2020-05-14status Pending - Taking Backups
-
2020-03-20$223,000 Active
ⓘ Source: listings_history table (triggers on properties + properties_extension) + one-shot
backfill from property_details.listing_events for pre-trigger history.
Tax reassessment forecast TX · Resets to sale price
- Current annual tax
- $7,644 · $637/mo
- Projected year-2 tax
- $7,644 · $637/mo
- Expected delta
- $0/yr ($0/mo · 0.0%)
ⓘ Screening estimate from a state-policy table — verify with the county assessor before closing.
Climate risk First Street
- Flood 1/10 Low FEMA zone X (unshaded) · 0% chance over 30 yrs
- Wildfire 4/10 Moderate
- Heat 8/10 Severe 7 d/yr ≥109°F today · 23 d/yr by 30 yrs out
- Wind 8/10 Severe 80% chance of damaging wind over 30 yrs
- Air quality 1/10 Low 0 unhealthy d/yr today · 0 by 30 yrs out
Nearby sold comps map
Loading sold comps map…
Walkable amenities ~0.75 mi
Loading nearby amenities…
Taxation est. · year 1
- Rental income
- $26,176
- − Mortgage interest
- −$12,043
- − Property taxes
- −$7,644
- − Insurance
- −$1,075
- − Repairs & maintenance
- −$2,094
- − Management
- −$2,094
- − HOA
- −$660
- − Depreciation
- −$6,255
- Taxable loss
- −$5,689
- Est. tax savings @ 24.0%
- +$1,365
- After-tax cash flow
- $-864/yr
For passive investors: Depreciation is non-cash, so a rental often shows a tax loss while cash-flowing — sheltering income. Rental losses are passive: they offset passive income freely, and up to $25,000/yr can offset ordinary (W-2) income if you actively participate and your MAGI is under $100k (phasing out to $0 by $150k); unused losses carry forward. On sale, claimed depreciation is recaptured at up to 25%, and gains may owe capital-gains tax (a 1031 exchange can defer both). Figures are a year-1 estimate at your 24.0% rate — not tax advice; consult a CPA.
Schools (NCES district)
- District
- Elgin ISD
- NCES district ID
- 4818360
- Math proficiency
- 17% ▼ -9.00%
- Reading proficiency
- 26% ▼ -5.00%
- Median HH income
- $55,176
- Composite
- 19.62/100
- National rank
- #8749
- State rank
- #741 of 826 in TX
Livability — Elgin
- Score
- 74/100
- State rank
- #167
- US rank
- #4404
Category grades
Schools grade is shown separately in the Schools card above.
Census & demographics
- County
- Bastrop County · 68,601 people
- City population
- 27,860
- Metro
- Austin-Round Rock-Georgetown, TX
- Population (ZIP)
- 30,411
- Household income
- $98,534
- Rent vs Own
- Severe rent burden
- 235.0
Population outlook (Travis County) Hauer SSP2
- Today (2025)
- 1,545,133 people
- By 2030
- 1,729,269 · +11.9%
- By 2040
- 2,097,596 · +35.8%
- By 2050
- 2,463,890 · +59.5%
- By 2075
- 3,249,374 · +110.3%
- By 2100
- 3,801,868 · +146.1%
Race, ethnicity, and origin ACS 2023
- Neighborhood character
- Diverse neighborhood (Simpson 0.64)
- Race & ethnicity
- Hispanic / Latino 46% White 38% Two or more races 19% Black 11% Native American 1%
- Hispanic origin (detail)
- Mexican 38%
- Common ancestry
- Slovak 2% Italian 2% Romanian 1%
- Foreign-born
- 17% · Canada, Vietnam
- Languages at home
- 63% English-only · Spanish 36%
Political lean MEDSL · Travis
- 2024 margin
- Solid D (+39.3) · D 68.8% · R 29.4% · Other 1.8%
- 2008→2024 swing
- +9.9pp toward D · 2008: 29.4pp · 2024: 39.3pp
- All cycles
- 2024: D+39.3 2020: D+45.0 2016: D+38.9 2012: D+23.9 2008: D+29.4
Not yet ingested
- Civics
- —
Market trends
- HPI YoY
- ▲ 29.47%
- Current HPI
- 416.87
- Rent YoY
- ▲ 3.12%
- Metro
- Austin-Round Rock-Georgetown, TX
- State GDP YoY
- ▲ 3.95%
- F500 in state
- 110
Industry mix (Fortune 500 HQ in TX)
| Industry | F500 HQs | Revenue |
|---|---|---|
| Energy | 16 | $1,198B |
|
||
| Technology | 5 | $198B |
|
||
| Engineering / Construction | 4 | $72B |
|
||
| Energy Services | 3 | $60B |
|
||
| Utilities | 3 | $41B |
|
||
| Healthcare | 2 | $330B |
|
||
Price history
+3.3% since first listed10 events — show timeline
- 2026-05-15 Price Changed $230,400 Unlock MLS
- 2026-04-12 Listed $242,500 Unlock MLS
- 2025-06-07 Price Changed — Unlock MLS
- 2025-05-09 Price Changed — Unlock MLS
- 2025-05-01 Price Changed — Unlock MLS
- 2025-02-13 Listed — Unlock MLS
- 2020-06-17 Sold (Public Records) — Public Records
- 2020-06-12 Sold (MLS) — Unlock MLS
- 2020-05-14 Pending — Unlock MLS
- 2020-03-20 Listed $223,000 Unlock MLS
Property tax history
+3.4%/yrLatest (2026): $7,644 · -4.1% YoY. Source: county tax records.
Cash-flow waterfall
monthlySold comps — $/sqft
last 12 mo · ≤1 miLoading sold comps…