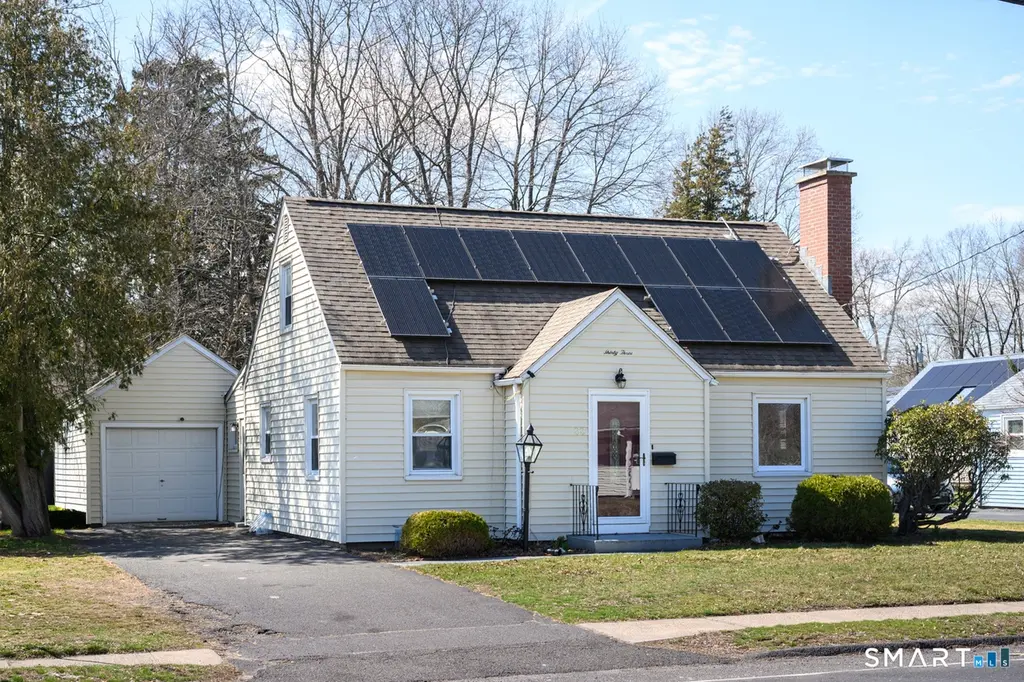
33 Washington St · Bristol, CT
Flood risk No data
- FEMA flood zone
- —
- Chance of flooding over 30 yrs
- —
- Est. flood insurance / yr
- —
Fire risk No data
- Est. fire insurance / yr
- —
Heat risk No data
- Hot days now (above threshold)
- —
- Hot days in 30 yrs
- —
Wind risk No data
- Chance of severe wind over 30 yrs
- —
Air-quality risk No data
- Unhealthy air days now
- —
- Unhealthy air days in 30 yrs
- —
Risk factors via First Street. Map © Google.
Why this score? — see what drove the F grade
The composite is a weighted blend of 9 inputs, each scored 0–100. Each bar is that input's sub-score; the figure is the points it added to the 100-point composite (weight × sub-score).
- Cash flow +5.0/30.0
- ARV discount +4.3/15.0
- Schools +4.3/10.0
- Livability +4.0/5.0
- Rent growth +2.5/5.0
- Condition / age +2.5/5.0
- 1% rule +0.9/10.0
- DSCR +0.0/10.0
- Appreciation +0.0/10.0
$345,000
🖨 Deal sheet 📄 Offer letter ✓ Due diligence
Listing remarks MLS
Nice cape with first floor fireplaced family room-dining rm and-new windows-1bdrm on first floor-appliances sold in as-is condition interior freshly painted - hardwood floors throughout-2 fireplaces
Key facts
- 0.26 acre lot
- Garage
- Built 1950
Property features AI
Exterior
- Parking: Attached garage (1-car)
- Utilities: Public water connected; Public sewer connected; Sewer usage fee applies annually
- Home design: Single-family home
- Construction: Frame construction; Concrete foundation; Asphalt shingle roof; Vinyl siding; Built as a single-family residence
- Exterior features: Chain-link fenced yard; Level lot
Interior
- Kitchen: Electric cooktop; Microwave; Dishwasher
- Bedrooms: Four bedrooms
- Bathrooms: Two full bathrooms; One half bathroom
- Heating & cooling: Hot air heating fueled by natural gas; Central air conditioning
- Interior features: Seven total rooms; Two fireplaces; Full, fully finished basement; Bonus room
- Laundry & utility: Washer; Electric dryer; 40-gallon hot water tank
Neighborhood map
What this means for you Summary
Snapshot
- This is a 4-bed/2.5-bath single-family listed at $345k.
Deal economics
- At list price, monthly cash flow is $-815 ($-10k/yr) — negative.
- To cash-flow at today's rent, offer at most $201k (41.7% below list).
- To meet the 1% rule (rent ≥ 1% of price), the offer needs to be $203k (41.2% below list).
- Recommended offer: $201k (41.7% below list) — sets the bar for cash-flow.
Location & tenants
- Location reads 81/100 on livability (#21 in CT, #1,585 nationally) — a professional / high-income tenant draw. Strengths: crime A+, housing A+, health & safety A+; Watch: commute F.
- Plainville School District (suburban): math 40% / reading 58% proficiency, ranked #82 of 153 in CT (top 54%) — families likely to look elsewhere, expect single-tenant / working-renter base with shorter leases.
- Zoned schools: Plainville High School (math 42% / reading 62%, grade D+, #80 of 194 statewide, top 44%, 686 students, 42% FRL) — zoned schools average 42% FRL vs 23% district-wide (19 pts higher); higher-poverty schools than district average — tighter screening recommended.
- Market conditions: 41 active listings in the ZIP; 1,867 units permitted in Capitol Planning Region in 2024 (1,399 in 5+ unit buildings).
Forward outlook
- Local home prices are declining (-3.0%/yr); year-one equity from $2k of loan paydown is wiped out by about $10k of value loss. Plan a longer hold.
Negotiation context
- Only 11 days on market — expect competitive offers; lowballing is unlikely to land.
- 2 sale attempts since 24y ago with the ask held roughly flat each time — persistent listings suggest the price (not the market) is what's stuck; bring a comps-based counter.
- Current owner paid $137k; list at $345k implies a 152% gain — meaningful room to come down on a strong offer.
Risks & watch-outs
- Watch-outs: built in 1950 — expect roof / HVAC / electrical / plumbing capex.
Questions for the listing agent
- What do current leases actually rent for vs. the listed asking? Can we see a recent rent roll and the last 12 months of T-12 income?
- Built in 1950 — when were the roof, HVAC, electrical panel, plumbing, and water heater last replaced?
- Is there a deadline driving the sale (1031 exchange, divorce, estate, relocation)? That informs how much negotiation room exists.
- The area grade is low — what's the realistic commute time and amenity access for the typical tenant pool here? Any planned neighborhood developments (good or bad) we should know about?
- What's the average days-on-market for RENTAL listings here right now (not sales)? A rising rental-DOM trend means longer vacancies and softer asking-rent achievability than the comps imply.
- What's the recent tenant-quality profile in this submarket — average credit score on applications, eviction rate, late-payment / NSF rate, and stable-employment percentage? A property-management company in the area should have these aggregated.
- How much new for-sale + rental construction is in the pipeline within 1–3 miles? Heavy new supply typically softens prices + rents 12–24 months out; constrained supply supports both.
Investment metrics
- 1% rule
- 0.59% ✗
- Cap rate
- 3.46%
- Cash-on-cash
- -10.13%
- DSCR
- 0.55
- GRM
- 14.2
CMA / ARV
- ARV (on-the-fly)
- $321,782
- Comps found
- 12
Show comp detail 12 sales within ~0.75 mi
| Address | Dist | Beds/Ba | Sqft | Sold | Price | $/sf | Match |
|---|---|---|---|---|---|---|---|
| 9 Hemingway St | 0.22mi | 3/1.0 (-1) | 1,304 (+2%) | 4mo | $340,000 | $261 | 73 |
| 56 Bohemia St | 0.49mi | 4/1.5 | 1,290 (+1%) | 6mo | $320,000 | $248 | 67 |
| 25 Lincoln St | 0.14mi | 4/1.0 | 1,159 (-10%) | 8mo | $325,888 | $281 | 65 |
| 269 W Main St | 0.56mi | 4/2.0 | 1,260 (-2%) | 7mo | $280,000 | $222 | 63 |
| 1 S Canal St | 0.22mi | 3/2.0 (-1) | 1,094 (-15%) | 5mo | $175,000 | $160 | 54 |
| 18 Homestead Ave | 0.57mi | 3/2.0 (-1) | 1,344 (+5%) | 8mo | $360,000 | $268 | 52 |
| 9 Walter Pl | 0.70mi | 4/1.5 | 1,300 (+1%) | 12mo | $315,000 | $242 | 51 |
| 19 Maple St | 0.72mi | 4/2.5 | 1,396 (+9%) | 3mo | $350,000 | $251 | 49 |
| 62 Marion St | 0.74mi | 3/2.0 (-1) | 1,316 (+3%) | 8mo | $315,992 | $240 | 47 |
| 6 Bruce Ave | 0.68mi | 3/2.0 (-1) | 1,218 (-5%) | 8mo | $320,000 | $263 | 46 |
| 84 Overlook Ave | 0.67mi | 3/2.0 (-1) | 1,206 (-6%) | 10mo | $350,000 | $290 | 44 |
| 34 Forest St | 0.63mi | 3/1.0 (-1) | 1,426 (+11%) | 10mo | $350,000 | $245 | 32 |
Match score weights: distance 35% · size 25% · config 20% · recency 20%. Top-matched comps best support the ARV.
Projected returns pro-forma
-3.0% appreciation · 3.0% rent growth · sell at horizon
- IRR
- -34.5%
- Equity multiple
- -0.12×
- Total profit
- $-107,769
- Equity at exit
- $51,441
- IRR
- -44.3%
- Equity multiple
- -0.66×
- Total profit
- $-160,484
- Equity at exit
- $29,829
Cash invested: $96,600 (down + closing). Projections, not guarantees.
Landlord ↔ Tenant lean methodology
- Overall (STATE)
- 27 Tenant-Leaning
- State Connecticut
- 27 Tenant-Leaning · D+7
- County
- — inherits STATE
- City
- — inherits STATE
ZIP-level market 06062
- Active inventory
- 41
- Price-to-rent
- 14.2×
Monthly cashflow live
- Estimated rent
- $2,030 medium interval (Pro) →
- Mortgage (P&I)
- −$1,809
- Tax from tax record
- −$466 /mo · $5,587/yr
- Insurance
- −$144
- HOA
- −$0
- Vacancy / Maint / Mgmt
- −$426
- Net cashflow
- $-815
Break-even live
UW: 25.0% down · 7.5% · 30yr · 1.5% tax · 5.0% vac · 8.0% maint · 8.0% mgmt
Financing live
Cash to close
- Down payment
- $86,250
- Closing costs
- $10,350
- Reserves months
- —
- Total cash needed
- —
Loan-product check · same deal, 3 products live
Conventional
25% down · 7.5% · 30yr
- Down + closing
- —
- Monthly P&I
- —
- Monthly cashflow
- —
- DSCR
- —
- Eligible?
- —
Personal DTI + credit; lowest rate.
DSCR
20% down · 8.5% · 30yr
- Down + closing
- —
- Monthly P&I
- —
- Monthly cashflow
- —
- DSCR
- —
- Eligible?
- —
No personal income docs; deal must DSCR.
Hard money
10% down · 12.0% · 12mo
- Down + closing
- —
- Monthly P&I
- —
- Monthly cashflow
- —
- DSCR
- —
- Eligible?
- —
Short-term bridge; refi at stabilization.
Listing history 6 events
-
2026-04-20status Under Contract
-
2026-04-10$345,000 Active
-
2026-03-28historical $345,000
-
2002-11-01soldstatus $137,000
-
2002-10-30soldstatus $137,000 198-char remark
Show marketing remark (198 chars)
Nice cape with first floor fireplaced family room-dining rm and-new windows-1bdrm on first floor-appliances sold in as-is condition interior freshly painted - hardwood floors throughout-2 fireplaces
-
2002-09-07$134,900 198-char remark
Show marketing remark (198 chars)
Nice cape with first floor fireplaced family room-dining rm and-new windows-1bdrm on first floor-appliances sold in as-is condition interior freshly painted - hardwood floors throughout-2 fireplaces
ⓘ Source: listings_history table (triggers on properties + properties_extension) + one-shot
backfill from property_details.listing_events for pre-trigger history.
Tax reassessment forecast CT · Partial reset (capped growth)
- Current annual tax
- $5,587 · $466/mo
- Projected year-2 tax
- $6,485 · $540/mo
- Expected delta
- +$898/yr (+$75/mo · 16.1%)
ⓘ Screening estimate from a state-policy table — verify with the county assessor before closing.
Nearby sold comps map
Loading sold comps map…
Walkable amenities ~0.75 mi
Loading nearby amenities…
Taxation est. · year 1
- Rental income
- $24,356
- − Mortgage interest
- −$19,325
- − Property taxes
- −$5,587
- − Insurance
- −$1,725
- − Repairs & maintenance
- −$1,948
- − Management
- −$1,948
- − Depreciation
- −$10,036
- Taxable loss
- −$16,215
- Est. tax savings @ 24.0%
- +$3,892
- After-tax cash flow
- $-5,890/yr
For passive investors: Depreciation is non-cash, so a rental often shows a tax loss while cash-flowing — sheltering income. Rental losses are passive: they offset passive income freely, and up to $25,000/yr can offset ordinary (W-2) income if you actively participate and your MAGI is under $100k (phasing out to $0 by $150k); unused losses carry forward. On sale, claimed depreciation is recaptured at up to 25%, and gains may owe capital-gains tax (a 1031 exchange can defer both). Figures are a year-1 estimate at your 24.0% rate — not tax advice; consult a CPA.
Schools (NCES district)
- District
- Plainville School District
- NCES district ID
- 0903300
- Math proficiency
- 40% ▼ -11.00%
- Reading proficiency
- 58% ▼ -6.00%
- Median HH income
- $60,758
- Composite
- 42.92/100
- National rank
- #3117
- State rank
- #82 of 153 in CT
Livability — Bristol
- Score
- 81/100
- State rank
- #21
- US rank
- #1585
Category grades
Schools grade is shown separately in the Schools card above.
Census & demographics
- City population
- 61,684
- Population (ZIP)
- 17,499
Population outlook (Capitol County) Hauer SSP2
- By 2040
- 1,063,519
Race, ethnicity, and origin ACS 2023
- Neighborhood character
- Predominantly White (78%)
- Race & ethnicity
- White 78% Hispanic / Latino 11% Two or more races 9% Asian 3% Black 3%
- Hispanic origin (detail)
- Mexican 2% Puerto Rican 4%
- Common ancestry
- Romanian 18% Lithuanian 10% Italian 3%
- Foreign-born
- 11% · Canada, China
- Languages at home
- 81% English-only · Russian/Polish/Slavic 7% Spanish 7% Other Indo-European 3%
Political lean MEDSL · Capitol
- 2024 margin
- Strong D (+21.9) · D 60.1% · R 38.2% · Other 1.7%
- All cycles
- 2024: D+21.9
Not yet ingested
- Civics
- —
Market trends
- HPI YoY
- ▼ -241.12%
- Current HPI
- 245.3485
- Rent YoY
- —
- Metro
- —
- State GDP YoY
- ▲ 1.06%
- F500 in state
- 38
Industry mix (Fortune 500 HQ in CT)
| Industry | F500 HQs | Revenue |
|---|---|---|
| Industrial Machinery | 4 | $38B |
|
||
| Insurance | 3 | $71B |
|
||
| Financial Services | 2 | $25B |
|
||
| Transportation / Logistics | 2 | $18B |
|
||
| Healthcare | 1 | $247B |
|
||
| Telecommunications | 1 | $55B |
|
||
Price history
+155.7% since first listed6 events — show timeline
- 2026-04-20 Pending — Smart MLS
- 2026-04-10 Listed $345,000 Smart MLS
- 2026-03-28 Coming Soon $345,000 Smart MLS
- 2002-11-01 Sold (Public Records) $137,000 Public Records
- 2002-10-30 Sold (MLS) $137,000 Smart MLS
- 2002-09-07 Listed $134,900 Smart MLS
Property tax history
+2.8%/yrLatest (2025): $5,587 · +5.3% YoY. Source: county tax records.
Cash-flow waterfall
monthlySold comps — $/sqft
last 12 mo · ≤1 miLoading sold comps…