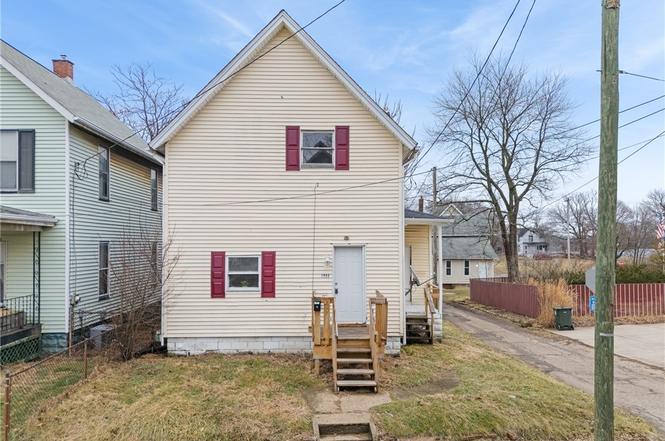
1024 Rex Ave NE · Canton, OH
Flood risk 1/10 · Minimal
- FEMA flood zone
- X (unshaded)
- Chance of flooding over 30 yrs
- 0.0%
- Est. flood insurance / yr
- $473 – $860
Fire risk 1/10 · Minimal
- Est. fire insurance / yr
- $713 – $1,323
Heat risk 3/10 · Minor
- Hot days now (above 96°F)
- 7 days/yr
- Hot days in 30 yrs
- 17 days/yr
Wind risk 1/10 · Minimal
- Chance of severe wind over 30 yrs
- —
Air-quality risk 2/10 · Minimal
- Unhealthy air days now
- 0 days/yr
- Unhealthy air days in 30 yrs
- 1 days/yr
Risk factors via First Street. Map © Google.
Why this score? — see what drove the B+ grade
The composite is a weighted blend of 9 inputs, each scored 0–100. Each bar is that input's sub-score; the figure is the points it added to the 100-point composite (weight × sub-score).
- Cash flow +30.0/30.0
- DSCR +10.0/10.0
- ARV discount +9.9/15.0
- 1% rule +8.7/10.0
- Appreciation +8.1/10.0
- Livability +3.6/5.0
- Rent growth +2.5/5.0
- Condition / age +2.5/5.0
- Schools +1.7/10.0
$79,000
🖨 Deal sheet 📄 Offer letter ✓ Due diligence
Listing remarks
Welcome to 1024 Rex — a fantastic investment opportunity packed with potential! This charming home offers 3 bedrooms, including a convenient main-floor bedroom that provides flexible living options for owners or tenants alike. Whether you're an investor looking to expand your portfolio or a buyer ready to put your personal touch on a home, this property presents endless possibilities. With solid bones and a functional layout, there’s plenty of room to add value and make it shine. The additional bedrooms provide comfortable space for family, guests, or rental potential, while the main-floor bedroom adds extra convenience and versatility.
Key facts
- 2,304 sq ft lot
- Built 1913
- Listed 26 days
Neighborhood map
What this means for you Summary
Snapshot
- This is a 3-bed/1.0-bath single-family listed at $79k.
Deal economics
- At list price, monthly cash flow is $353 ($4k/yr) — positive.
- The deal already cash-flows at list — no discount required.
- Meets the 1% rule at list price ($1k rent vs $79k).
- Recommended offer: $78k (1.5% below list) — sets the bar for market timing.
- Cap rate 11.7% vs local median 5.1% in Canton — top-decile yield for the area; either an underpriced asset or a hidden risk that comps aren't pricing in. Stress-test before assuming the spread holds.
Location & tenants
- Location reads 71/100 on livability (#441 in OH) — a middle-class / working-renter tenant base. Strengths: commute A+, cost of living A+, housing A; Watch: crime F, employment F.
- Canton City (urban): math 17% / reading 26% proficiency, ranked #627 of 656 in OH (top 96%) — low school quality limits family demand, transient renter base, plan for 1-2y turnover; 76% free/reduced lunch — lower-income household profile, screen leases tightly.
- Market conditions: 20 active listings in the ZIP; 23 comparable units currently listed for rent nearby; rentals at typical pace (median 21d on market — plan ~3-4 weeks tenant-placement turnaround); lower-income renter base — watch delinquency; 528 units permitted in Stark County in 2024 (84 in 5+ unit buildings).
- This rent runs 38% of the median local income ($34k/yr) — at the standard rent-burdened threshold; future hikes will face affordability resistance.
Forward outlook
- In year one you build about $5k of equity ($546 loan paydown + $5k appreciation (6.2% local appreciation)).
- Stark County population projected to shrink 8% by 2050 — rents likely to lag national; underwrite the cash flow, not the appreciation.
- At projected returns (6.2% appreciation + 3.0% rent growth), your $22k cash investment doubles in ~3 years — after that, you're playing with house money.
- By year 7, paydown + projected appreciation supports a ~$36k cash-out refi (75% LTV) — recoverable capital for the next deal without selling this one.
Negotiation context
- It's been on market 26 days — a 2% lower offer ($78k) is reasonable based on typical stale-listing flexibility.
- 4 sale attempts since 24y ago; this cycle's ask has dropped $6k (7%) from the opening price — seller is motivated, your offer sets the floor, not the list.
Risks & watch-outs
- Watch-outs: built in 1913 — expect roof / HVAC / electrical / plumbing capex.
Questions for the listing agent
- Built in 1913 — when were the roof, HVAC, electrical panel, plumbing, and water heater last replaced?
- Is there a deadline driving the sale (1031 exchange, divorce, estate, relocation)? That informs how much negotiation room exists.
- Crime grade is F in this area — have there been break-ins, vandalism, or insurance claims at this property in the last 3 years? What carrier currently insures it and at what premium?
- What's the average days-on-market for RENTAL listings here right now (not sales)? A rising rental-DOM trend means longer vacancies and softer asking-rent achievability than the comps imply.
- What's the recent tenant-quality profile in this submarket — average credit score on applications, eviction rate, late-payment / NSF rate, and stable-employment percentage? A property-management company in the area should have these aggregated.
- How much new for-sale + rental construction is in the pipeline within 1–3 miles? Heavy new supply typically softens prices + rents 12–24 months out; constrained supply supports both.
Investment metrics
- 1% rule
- 1.37% ✓
- Cap rate
- 11.65%
- Cash-on-cash
- 19.14%
- DSCR
- 1.85
- GRM
- 6.1
CMA / ARV
- ARV (on-the-fly)
- $83,460
- Comps found
- 12
Show comp detail 12 sales within ~0.75 mi
| Address | Dist | Beds/Ba | Sqft | Sold | Price | $/sf | Match |
|---|---|---|---|---|---|---|---|
| 1161 Spring Ave NE | 0.19mi | 3/2.0 | 1,250 (-3%) | 3mo | $25,000 | $20 | 80 |
| 1446 Downing Ct NE | 0.47mi | 3/1.0 | 1,248 (-3%) | 1mo | $10,000 | $8 | 72 |
| 601 Melrose Pl NE | 0.40mi | 3/1.0 | 1,158 (-10%) | 2mo | $75,000 | $65 | 63 |
| 1525 14th St NE | 0.71mi | 3/1.0 | 1,264 (-2%) | 2mo | $21,900 | $17 | 62 |
| 1544 Spring Ave NE | 0.59mi | 3/1.0 | 1,218 (-5%) | 4mo | $71,500 | $59 | 61 |
| 1521 Gibbs Ave NE | 0.61mi | 3/1.0 | 1,360 (+6%) | 1mo | $109,900 | $81 | 61 |
| 715 6th St NE | 0.40mi | 3/1.0 | 1,096 (-15%) | 1mo | $117,900 | $108 | 56 |
| 706 Harriet Ave NW | 0.69mi | 3/1.0 | 1,384 (+8%) | 3mo | $92,000 | $66 | 52 |
| 1629 Gibbs Ave NE | 0.68mi | 3/1.0 | 1,152 (-10%) | 0mo | $75,000 | $65 | 51 |
| 1611 Rowland Ave NE | 0.72mi | 3/1.0 | 1,152 (-10%) | 6mo | $102,000 | $89 | 44 |
| 1316 4th St NE | 0.71mi | 2/1.0 (-1) | 1,152 (-10%) | 2mo | $58,000 | $50 | 43 |
| 1227 Worley Ave NW | 0.61mi | 3/2.0 | 1,092 (-15%) | 3mo | $120,000 | $110 | 40 |
Match score weights: distance 35% · size 25% · config 20% · recency 20%. Top-matched comps best support the ARV.
Projected returns pro-forma
6.17% appreciation · 3.0% rent growth · sell at horizon
- IRR
- 31.7%
- Equity multiple
- 3.08×
- Total profit
- $46,063
- Equity at exit
- $50,507
- IRR
- 29.4%
- Equity multiple
- 6.32×
- Total profit
- $117,675
- Equity at exit
- $92,331
Cash invested: $22,120 (down + closing). Projections, not guarantees.
Landlord ↔ Tenant lean methodology
- Overall (STATE)
- 73 Landlord-Friendly
- State Ohio
- 73 Landlord-Friendly · R+6
- County
- — inherits STATE
- City
- — inherits STATE
ZIP-level market 44704
- Home prices YoY
- 7.2%
- Active inventory
- 20
- Price-to-rent
- 6.1×
Monthly cashflow live
- Estimated rent
- $1,085 high interval (Pro) →
- Mortgage (P&I)
- −$414
- Tax from tax record
- −$57 /mo · $683/yr
- Insurance
- −$33
- HOA
- −$0
- Vacancy / Maint / Mgmt
- −$228
- Net cashflow
- $353
Break-even live
UW: 25.0% down · 7.5% · 30yr · 1.5% tax · 5.0% vac · 8.0% maint · 8.0% mgmt
Financing live
Cash to close
- Down payment
- $19,750
- Closing costs
- $2,370
- Reserves months
- —
- Total cash needed
- —
Loan-product check · same deal, 3 products live
Conventional
25% down · 7.5% · 30yr
- Down + closing
- —
- Monthly P&I
- —
- Monthly cashflow
- —
- DSCR
- —
- Eligible?
- —
Personal DTI + credit; lowest rate.
DSCR
20% down · 8.5% · 30yr
- Down + closing
- —
- Monthly P&I
- —
- Monthly cashflow
- —
- DSCR
- —
- Eligible?
- —
No personal income docs; deal must DSCR.
Hard money
10% down · 12.0% · 12mo
- Down + closing
- —
- Monthly P&I
- —
- Monthly cashflow
- —
- DSCR
- —
- Eligible?
- —
Short-term bridge; refi at stabilization.
Rent comps 23 comps
| Address | Beds | Baths | Sqft | Rent | $/sqft | DOM | Units | Dist |
|---|---|---|---|---|---|---|---|---|
| 924 Spring Ave NE Canton, OH | 4.0 | 1.5 | 1407 | $1,395 | $0.99 | 21d | 1 | 0.20mi |
| 1220 Market Ave N Unit 4 Canton, OH | 3.0 | 1.0 | 1400 | $1,100 | $0.79 | 43d | 1 | 0.23mi |
| 1206 Lawrence Rd NE Apt 3 Canton, OH | 2.0 | 1.0 | 900 | $950 | $1.06 | 21d | 1 | 0.38mi |
| 1307 Woodland Ave NW Unit 2 Canton, OH | 2.0 | 1.0 | 973 | $675 | $0.69 | 43d | 1 | 0.48mi |
| 1613 Spring Ave NE Canton, OH | 3.0 | 1.0 | 1320 | $1,095 | $0.83 | 21d | 1 | 0.59mi |
| 1629 Spring Ave NE Unit Na Canton, OH | 2.0 | 1.0 | 1100 | $836 | $0.76 | 21d | 1 | 0.62mi |
| 123 17th St NW Canton, OH | 2.0 | 1.0–1.5 | 766 | $1,050 | $1.37 | 13d | 1 | 0.67mi |
| 316 Young Ave NE Canton, OH | 4.0 | 1.0 | 1268 | $1,050 | $0.83 | 13d | 1 | 0.76mi |
| 1008 14th St NW Canton, OH | 3.0 | 1.5 | 1100 | $898 | $0.82 | 21d | 1 | 0.77mi |
| 1137 7th St NW Canton, OH | 3.0 | 1.0 | 1736 | $1,095 | $0.63 | 43d | 1 | 0.86mi |
| 1016 2nd St NW Canton, OH | 1.0–3.0 | 1.0–2.0 | 916 | $1,050 | $1.15 | 13d | 20 | 0.87mi |
| 1511 2nd St NE Canton, OH | 3.0 | 1.0 | 1129 | $1,250 | $1.11 | 43d | 1 | 0.88mi |
| 1216 14th St NW Canton, OH | 3.0 | 1.0 | 1352 | $1,100 | $0.81 | 21d | 1 | 0.92mi |
| 1224 15th St NW Unit 1 Canton, OH | 2.0 | 1.0 | 900 | $749 | $0.83 | 21d | 1 | 0.99mi |
| 1421 Piper Ct NW Canton, OH | 3.0 | 1.5 | 1311 | $995 | $0.76 | 21d | 1 | 1.01mi |
| 1100 5th St SW Canton, OH | 4.0 | 1.0 | 1397 | $1,200 | $0.86 | 43d | 1 | 1.06mi |
| 1906 6th St NE Unit 1906-002 Canton, OH | 3.0 | 1.0 | 906 | $1,000 | $1.10 | 13d | 1 | 1.11mi |
| 1946 Otto Pl NE Canton, OH | 3.0 | 1.0 | 1499 | $28,000 | $18.68 | 13d | 1 | 1.19mi |
| 1000 Market Ave S Canton, OH | 1.0–2.0 | 1.0–2.0 | 1500 | $4,505 | $3.00 | 13d | 12 | 1.20mi |
| 2018 Maple Ave NE Canton, OH | 2.0 | 1.0 | 1206 | $950 | $0.79 | 13d | 1 | 1.23mi |
| 1029 23rd St NW Canton, OH | 3.0 | 1.0 | 1356 | $1,500 | $1.11 | 13d | 1 | 1.33mi |
| 2213 17th St NE Canton, OH | 2.0 | 1.0 | 1132 | $1,100 | $0.97 | 44d | 1 | 1.36mi |
| 2048 2nd St NE Unit 2048 Canton, OH | 2.0 | 1.0 | 1092 | $950 | $0.87 | 13d | 1 | 1.36mi |
Listing history 11 events
-
2026-03-31status Pending
-
2026-03-09price $79,000
-
2026-03-05$85,000 Active
-
2007-07-31historical
-
2006-10-23$35,000
-
2005-01-06soldstatus $262,000
-
2003-11-20historical
-
2002-11-20$33,900
-
2002-06-01historical
-
2002-01-07$34,000
-
1998-10-02soldstatus $80,000
ⓘ Source: listings_history table (triggers on properties + properties_extension) + one-shot
backfill from property_details.listing_events for pre-trigger history.
Tax reassessment forecast OH · Partial reset (capped growth)
- Current annual tax
- $683 · $57/mo
- Projected year-2 tax
- $958 · $80/mo
- Expected delta
- +$275/yr (+$23/mo · 40.2%)
ⓘ Screening estimate from a state-policy table — verify with the county assessor before closing.
Climate risk First Street
- Flood 1/10 Low FEMA zone X (unshaded) · 0% chance over 30 yrs
- Wildfire 1/10 Low
- Heat 3/10 Moderate 7 d/yr ≥96°F today · 17 d/yr by 30 yrs out
- Wind 1/10 Low
- Air quality 2/10 Low 0 unhealthy d/yr today · 1 by 30 yrs out
Nearby sold comps map
Loading sold comps map…
Walkable amenities ~0.75 mi
Loading nearby amenities…
Taxation est. · year 1
- Rental income
- $13,017
- − Mortgage interest
- −$4,425
- − Property taxes
- −$683
- − Insurance
- −$395
- − Repairs & maintenance
- −$1,041
- − Management
- −$1,041
- − Depreciation
- −$2,298
- Taxable income
- $3,132
- Est. tax owed @ 24.0%
- −$752
- After-tax cash flow
- $3,482/yr
For passive investors: Depreciation is non-cash, so a rental often shows a tax loss while cash-flowing — sheltering income. Rental losses are passive: they offset passive income freely, and up to $25,000/yr can offset ordinary (W-2) income if you actively participate and your MAGI is under $100k (phasing out to $0 by $150k); unused losses carry forward. On sale, claimed depreciation is recaptured at up to 25%, and gains may owe capital-gains tax (a 1031 exchange can defer both). Figures are a year-1 estimate at your 24.0% rate — not tax advice; consult a CPA.
Schools (NCES district)
- District
- Canton City
- NCES district ID
- 3904371
- Math proficiency
- 17% ▼ -17.00%
- Reading proficiency
- 26% ▼ -12.00%
- Median HH income
- $28,825
- Composite
- 17.1/100
- National rank
- #9116
- State rank
- #627 of 656 in OH
Livability — Canton
- Score
- 71/100
- State rank
- #441
- US rank
- #7259
Category grades
Schools grade is shown separately in the Schools card above.
Census & demographics
- Census place
- Canton, OH
- County
- Stark · 366,688 people
- City population
- 103,614
- Metro
- Canton-Massillon, OH
- Population (ZIP)
- 3,583
- Household income
- $34,063
- Rent vs Own
- Severe rent burden
- 10.1
Population outlook (Stark County) Hauer SSP2
- Today (2025)
- 373,708 people
- By 2030
- 371,245 · -0.7%
- By 2040
- 361,331 · -3.3%
- By 2050
- 345,290 · -7.6%
- By 2075
- 302,669 · -19.0%
- By 2100
- 238,870 · -36.1%
Race, ethnicity, and origin ACS 2023
- Neighborhood character
- Diverse neighborhood (Simpson 0.56)
- Race & ethnicity
- Black 58% White 33% Two or more races 7% Hispanic / Latino 2%
- Common ancestry
- Hispanic 3% Romanian 1% Polish 1%
Political lean MEDSL · Stark
- 2024 margin
- Strong R (+21.9) · D 38.6% · R 60.5%
- 2008→2024 swing
- -27.4pp toward R · 2008: 5.5pp · 2024: -21.9pp
- All cycles
- 2024: R+21.9 2020: R+18.5 2016: R+17.4 2012: R+0.4 2008: D+5.5
Not yet ingested
- Civics
- —
Market trends
- HPI YoY
- ▲ 6.17%
- Current HPI
- 91.3426
- Rent YoY
- —
- Metro
- —
- State GDP YoY
- ▲ 1.98%
- F500 in state
- 48
Industry mix (Fortune 500 HQ in OH)
| Industry | F500 HQs | Revenue |
|---|---|---|
| Insurance | 3 | $145B |
|
||
| Industrial Machinery | 3 | $49B |
|
||
| Financial Services | 3 | $24B |
|
||
| Consumer Goods | 2 | $93B |
|
||
| Aerospace / Defense | 2 | $47B |
|
||
| Utilities | 2 | $33B |
|
||
Price history
-1.2% since first listed11 events — show timeline
- 2026-03-31 Pending — MLSNOW
- 2026-03-09 Price Changed $79,000 MLSNOW
- 2026-03-05 Listed $85,000 MLSNOW
- 2007-07-31 Listing Removed — MLSNOW
- 2006-10-23 Listed $35,000 MLSNOW
- 2005-01-06 Sold (Public Records) $262,000 Public Records
- 2003-11-20 Listing Removed — MLSNOW
- 2002-11-20 Listed $33,900 MLSNOW
- 2002-06-01 Listing Removed — MLSNOW
- 2002-01-07 Listed $34,000 MLSNOW
- 1998-10-02 Sold (Public Records) $80,000 Public Records
Property tax history
+1.8%/yrLatest (2024): $683 · +71.5% YoY. Source: county tax records.
Cash-flow waterfall
monthlySold comps — $/sqft
last 12 mo · ≤1 miLoading sold comps…