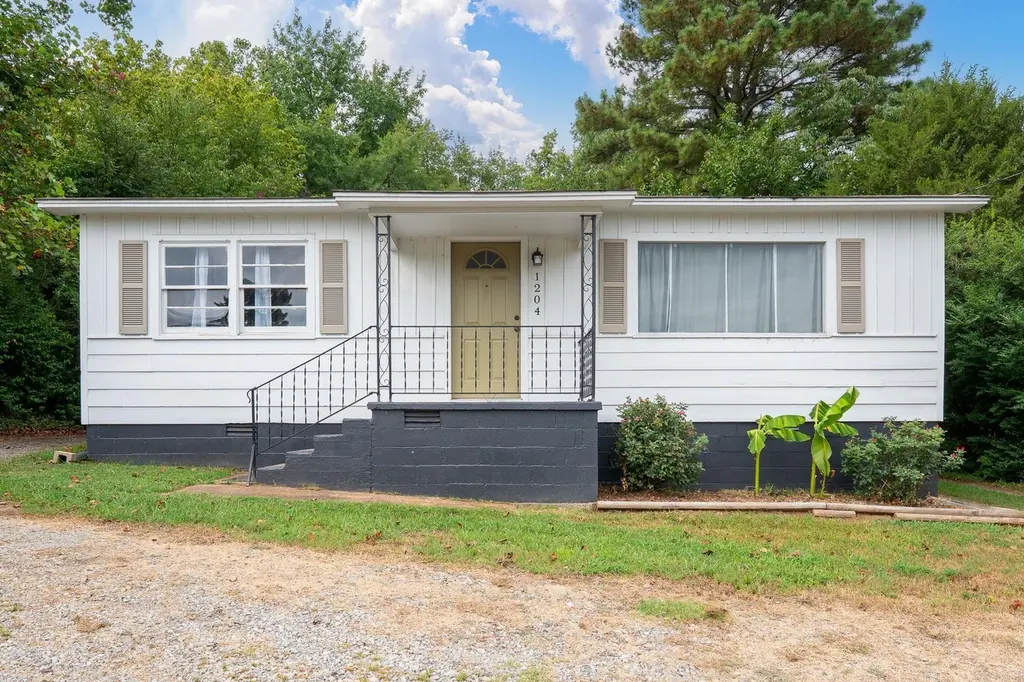
1204 W Main St · Heber Springs, AR
Flood risk 1/10 · Minimal
- FEMA flood zone
- X (unshaded)
- Chance of flooding over 30 yrs
- 0.0%
- Est. flood insurance / yr
- $473 – $860
Fire risk 3/10 · Minor
- Est. fire insurance / yr
- $1,499 – $2,785
Heat risk 6/10 · Moderate
- Hot days now (above 108°F)
- 7 days/yr
- Hot days in 30 yrs
- 20 days/yr
Wind risk 3/10 · Minor
- Chance of severe wind over 30 yrs
- 6.0%
Air-quality risk 1/10 · Minimal
- Unhealthy air days now
- 0 days/yr
- Unhealthy air days in 30 yrs
- 0 days/yr
Risk factors via First Street. Map © Google.
Why this score? — see what drove the D grade
The composite is a weighted blend of 9 inputs, each scored 0–100. Each bar is that input's sub-score; the figure is the points it added to the 100-point composite (weight × sub-score).
- Cash flow +14.6/30.0
- ARV discount +8.4/15.0
- DSCR +4.5/10.0
- Schools +4.1/10.0
- 1% rule +3.0/10.0
- Livability +2.9/5.0
- Rent growth +2.5/5.0
- Condition / age +2.5/5.0
- Appreciation +0.0/10.0
$125,000
🖨 Deal sheet (PDF) 📄 Offer letter ✓ Due diligence
Listing remarks
Come fall in love with this charming home in the heart of Heber Springs! This home has a lot of character that you don't find in today's homes. With refinished hardwood floors, updated countertops, and new lighting throughout, this home is move-in ready for you! This home also has a spacious unfinished basement which is currently being used as the laundry room, but could have endless possibilities as bonus living space. Conveniently located less than a mile from a boat launch and Sandy Beach, this home has it all at an affordable price. Call us today for your private tour to see if this home is right for you.
Key facts
- New lighting
- Boat launch
- Updated countertops
Tags
Property features AI
Exterior
- Parking: Parking pads for 2 cars
- Utilities: Public sewer; Public water; Municipal electric service (includes Entergy); Natural gas; Cable TV available
- Home design: Single-family property
- Construction: Block and wood exterior; Composition roof; Slab/crawlspace combination foundation; Built on tax-recorded acreage of 0.24 acres
- Exterior features: Sloped, up-slope lot; Gravel and paved road access; Inside city limits
Interior
- Kitchen: Free-standing stove; Microwave; Garbage disposal; Ice maker connection
- Flooring: Wood flooring; Vinyl flooring; Tile flooring
- Bathrooms: 1 full bathroom
- Heating & cooling: Central electric heat; Central electric cooling
- Interior features: Great room; Den / family room; Unfinished space; Basement
- Laundry & utility: Laundry room
Neighborhood map
What this means for you Summary
Snapshot
- This is a 2-bed/1.0-bath single-family listed at $125k.
Deal economics
- At list price, monthly cash flow is $30 ($358/yr) — positive.
- The deal already cash-flows at list — no discount required.
- To meet the 1% rule (rent ≥ 1% of price), the offer needs to be $100k (20.2% below list).
- Recommended offer: $100k (20.2% below list) — sets the bar for 1% rule.
- Cap rate 6.6% vs local median 2.1% in Heber Springs — top-decile yield for the area; either an underpriced asset or a hidden risk that comps aren't pricing in. Stress-test before assuming the spread holds.
Location & tenants
- Location reads 58/100 on livability (#329 in AR) — a working-class tenant base; expect higher turnover. Strengths: cost of living A+; Watch: crime C-, employment D+, amenities F.
- Heber Springs School District (town): math 50% / reading 49% proficiency, ranked #19 of 238 in AR (top 8%) — families likely to look elsewhere, expect single-tenant / working-renter base with shorter leases.
- Zoned schools: Heber Springs Elem. School (math 48% / reading 40%, grade F, #164 of 454 statewide, top 37%, 756 students, 61% FRL); Heber Springs Middle School (math 60% / reading 58%, grade B, #13 of 201 statewide, top 7%, 380 students, 46% FRL); Heber Springs High School (math 37% / reading 49%, grade F, #37 of 292 statewide, top 12%, 484 students, 40% FRL) — zoned schools at 49% FRL track the district average.
- Market conditions: 296 active listings in the ZIP; 2 comparable units currently listed for rent nearby; 13 units permitted in Cleburne County in 2024 (0 in 5+ unit buildings).
Forward outlook
- Local home prices are declining (-3.0%/yr); year-one equity from $864 of loan paydown is wiped out by about $4k of value loss. Plan a longer hold.
- Cleburne County population projected at -18% by 2050 — secular population decline; favor cash flow + early exit over multi-decade hold.
Negotiation context
- It's been on market 59 days — a 3% lower offer ($121k) is reasonable based on typical stale-listing flexibility.
- 8 sale attempts since 8y ago with the ask held roughly flat each time — persistent listings suggest the price (not the market) is what's stuck; bring a comps-based counter.
- Current owner paid $105k; 19% above their basis — modest negotiation headroom, anchor on the comps not their cost.
Risks & watch-outs
- Watch-outs: built in 1952 — expect roof / HVAC / electrical / plumbing capex.
- Climate carrying-cost: extreme-heat days projected 7→20/yr by 2055 (HVAC capex compounding) — expect insurance premiums to compound above CPI over the hold.
Questions for the listing agent
- It's been on market 59 days. Have you received any prior offers? Is the seller open to a 20% concession, seller financing, or rate buy-down credit?
- Built in 1952 — when were the roof, HVAC, electrical panel, plumbing, and water heater last replaced?
- Is there a deadline driving the sale (1031 exchange, divorce, estate, relocation)? That informs how much negotiation room exists.
- The area grade is low — what's the realistic commute time and amenity access for the typical tenant pool here? Any planned neighborhood developments (good or bad) we should know about?
- What's the average days-on-market for RENTAL listings here right now (not sales)? A rising rental-DOM trend means longer vacancies and softer asking-rent achievability than the comps imply.
- What's the recent tenant-quality profile in this submarket — average credit score on applications, eviction rate, late-payment / NSF rate, and stable-employment percentage? A property-management company in the area should have these aggregated.
- How much new for-sale + rental construction is in the pipeline within 1–3 miles? Heavy new supply typically softens prices + rents 12–24 months out; constrained supply supports both.
Investment metrics
- 1% rule
- 0.80% ✗
- Cap rate
- 6.58%
- Cash-on-cash
- 1.02%
- DSCR
- 1.05
- GRM
- 10.4
CMA / ARV
- ARV (median comp)
- $127,500
- List price
- $125,000
- Delta
- -1.96%
- Verdict
- FAIR
- Comps
- 20 within 1.0 mi
Show comp detail 12 sales within ~0.75 mi
| Address | Dist | Beds/Ba | Sqft | Sold | Price | $/sf | Match |
|---|---|---|---|---|---|---|---|
| 807 W Walnut St | 0.36mi | 2/2.0 | 1,160 (-1%) | 2mo | $140,000 | $121 | 76 |
| 1403 W Walnut St | 0.25mi | 3/2.0 (+1) | 1,144 (-2%) | 4mo | $115,000 | $101 | 72 |
| 706 W Pne | 0.41mi | 3/1.0 (+1) | 1,210 (+4%) | 2mo | $171,000 | $141 | 68 |
| 609 Scenic Vly | 0.57mi | 3/2.0 (+1) | 1,166 (-0%) | 2mo | $164,000 | $141 | 62 |
| 431 Ash St | 0.56mi | 3/1.0 (+1) | 1,140 (-2%) | 4mo | $145,000 | $127 | 62 |
| 402 Hill Crest Dr | 0.39mi | 3/2.0 (+1) | 1,256 (+8%) | 6mo | $167,000 | $133 | 55 |
| 411 N 3rd St | 0.71mi | 2/2.0 | 1,096 (-6%) | 2mo | $90,000 | $82 | 51 |
| 532 Scenic Valley Dr | 0.58mi | 3/2.0 (+1) | 1,256 (+8%) | 10mo | $188,000 | $150 | 43 |
| 507 Case St | 0.52mi | 3/1.0 (+1) | 1,008 (-14%) | 7mo | $158,000 | $157 | 42 |
| 620 Spruce St | 0.69mi | 3/1.0 (+1) | 1,000 (-14%) | 3mo | $95,000 | $95 | 36 |
| 2125 Snooze Rd | 0.73mi | 2/1.0 | 1,000 (-14%) | 7mo | $149,900 | $150 | 36 |
| 1002 S 11th St | 0.65mi | 3/2.0 (+1) | 1,316 (+13%) | 8mo | $165,000 | $125 | 33 |
Match score weights: distance 35% · size 25% · config 20% · recency 20%. Top-matched comps best support the ARV.
Projected returns pro-forma
-3.0% appreciation · 3.0% rent growth · sell at horizon
- IRR
- -14.7%
- Equity multiple
- 0.47×
- Total profit
- $-18,405
- Equity at exit
- $18,638
- IRR
- -6.1%
- Equity multiple
- 0.61×
- Total profit
- $-13,782
- Equity at exit
- $10,808
Cash invested: $35,000 (down + closing). Projections, not guarantees.
Landlord ↔ Tenant lean methodology
- Overall (STATE)
- 92 Strongly Landlord-Friendly
- State Arkansas
- 92 Strongly Landlord-Friendly · R+14
- County
- — inherits STATE
- City
- — inherits STATE
ZIP-level market 72543
- Home prices YoY
- -26.7%
- Active inventory
- 296
- Price-to-rent
- 10.4×
Monthly cashflow live
- Estimated rent
- $998 medium interval (Pro) →
- Mortgage (P&I)
- −$656
- Tax from tax record
- −$51 /mo · $612/yr
- Insurance
- −$52
- HOA
- −$0
- Vacancy / Maint / Mgmt
- −$210
- Net cashflow
- $30
Break-even live
Sensitivity live
| Price | -10% $101 | -5% $65 | +0% $30 | +5% $-6 | +10% $-41 |
|---|---|---|---|---|---|
| Rent | -10% $-49 | -5% $-10 | +0% $30 | +5% $69 | +10% $109 |
| Rate | -1.0pp $93 | -0.5pp $62 | base $30 | +0.5pp $-3 | +1.0pp $-36 |
UW: 25.0% down · 7.5% · 30yr · 1.5% tax · 5.0% vac · 8.0% maint · 8.0% mgmt
Financing live
Cash to close
- Down payment
- $31,250
- Closing costs
- $3,750
- Reserves months
- —
- Total cash needed
- —
Loan-product check · same deal, 3 products live
Conventional
25% down · 7.5% · 30yr
- Down + closing
- —
- Monthly P&I
- —
- Monthly cashflow
- —
- DSCR
- —
- Eligible?
- —
Personal DTI + credit; lowest rate.
DSCR
20% down · 8.5% · 30yr
- Down + closing
- —
- Monthly P&I
- —
- Monthly cashflow
- —
- DSCR
- —
- Eligible?
- —
No personal income docs; deal must DSCR.
Hard money
10% down · 12.0% · 12mo
- Down + closing
- —
- Monthly P&I
- —
- Monthly cashflow
- —
- DSCR
- —
- Eligible?
- —
Short-term bridge; refi at stabilization.
Rent comps 2 comps
| Address | Beds | Baths | Sqft | Rent | $/sqft | DOM | Units | Dist |
|---|---|---|---|---|---|---|---|---|
| 311 Colonial Dr Unit 1 Heber Springs, AR | 2.0 | 1.0 | 720 | $775 | $1.08 | 45d | 1 | 0.61mi |
| 313 N High St Unit A Heber Springs, AR | 3.0 | 2.0 | 1350 | $1,299 | $0.96 | 25d | 1 | 1.15mi |
Listing history 40 events
-
2026-06-22days on market $125,000 Active 59 DOM
-
2026-06-21days on market $125,000 Active 58 DOM
-
2026-06-19days on market $125,000 Active 56 DOM
-
2026-06-18days on market $125,000 Active 55 DOM
-
2026-06-17days on market $125,000 Active 54 DOM
-
2026-06-16days on market $125,000 Active 53 DOM
-
2026-06-15days on market $125,000 Active 52 DOM
-
2026-06-14days on market $125,000 Active 50 DOM
-
2026-06-12days on market $125,000 Active 49 DOM
-
2026-06-09days on market $125,000 Active 46 DOM
-
2026-06-08days on market $125,000 Active 45 DOM
-
2026-06-07days on market $125,000 Active 44 DOM
-
2026-06-07days on market $125,000 Active 43 DOM
-
2026-06-04days on market $125,000 Active 40 DOM
-
2026-06-02days on market $125,000 Active 39 DOM
-
2026-06-01days on market $125,000 Active 38 DOM
-
2026-05-31days on market $125,000 Active 37 DOM
-
2026-05-31days on market $125,000 Active 36 DOM
-
2026-04-24$125,000 New Listing 616-char remark
-
2026-04-01historical
-
2026-01-23$129,900 New Listing
-
2025-12-01historical
-
2025-10-01status Back on Market
-
2025-10-01historical
-
2025-09-17price $132,500
-
2025-08-04$135,000 New Listing
-
2022-08-16soldstatus $105,000
-
2022-08-12soldstatus $105,000 Sold
-
2022-08-09status Under Contract
-
2022-07-18historical Take Backups
-
2022-06-30price $106,000
-
2022-06-22price $108,000
-
2022-06-09$110,000 New Listing
-
2019-09-25soldstatus $35,000 Sold
-
2019-08-20status Back on Market
-
2019-04-04status Under Contract
-
2019-03-18$45,000 New Listing
-
2018-12-27historical
-
2018-09-11price $53,500
-
2018-07-30$58,500 New Listing
ⓘ Source: listings_history table (triggers on properties + properties_extension) + one-shot
backfill from property_details.listing_events for pre-trigger history.
Tax reassessment forecast AR · Resets to sale price
- Current annual tax
- $612 · $51/mo
- Projected year-2 tax
- $800 · $67/mo
- Expected delta
- +$188/yr (+$16/mo · 30.6%)
ⓘ Screening estimate from a state-policy table — verify with the county assessor before closing.
Climate risk First Street
- Flood 1/10 Low FEMA zone X (unshaded) · 0% chance over 30 yrs
- Wildfire 3/10 Moderate
- Heat 6/10 Major 7 d/yr ≥108°F today · 20 d/yr by 30 yrs out
- Wind 3/10 Moderate 6% chance of damaging wind over 30 yrs
- Air quality 1/10 Low 0 unhealthy d/yr today · 0 by 30 yrs out
Nearby sold comps map
Loading sold comps map…
Walkable amenities ~0.75 mi
Loading nearby amenities…
Taxation est. · year 1
- Rental income
- $11,977
- − Mortgage interest
- −$7,002
- − Property taxes
- −$612
- − Insurance
- −$625
- − Repairs & maintenance
- −$958
- − Management
- −$958
- − Depreciation
- −$3,636
- Taxable loss
- −$1,815
- Est. tax savings @ 24.0%
- +$436
- After-tax cash flow
- $794/yr
For passive investors: Depreciation is non-cash, so a rental often shows a tax loss while cash-flowing — sheltering income. Rental losses are passive: they offset passive income freely, and up to $25,000/yr can offset ordinary (W-2) income if you actively participate and your MAGI is under $100k (phasing out to $0 by $150k); unused losses carry forward. On sale, claimed depreciation is recaptured at up to 25%, and gains may owe capital-gains tax (a 1031 exchange can defer both). Figures are a year-1 estimate at your 24.0% rate — not tax advice; consult a CPA.
Schools (NCES district)
- District
- Heber Springs School District
- NCES district ID
- 0507560
- Math proficiency
- 50% ▼ -11.00%
- Reading proficiency
- 49% ▼ -11.00%
- Median HH income
- $39,577
- Composite
- 41.39/100
- National rank
- #3478
- State rank
- #19 of 238 in AR
Livability — Heber Springs
- Score
- 58/100
- State rank
- #329
- US rank
- #21491
Category grades
Schools grade is shown separately in the Schools card above.
Census & demographics
- Census place
- Heber Springs, AR
- Population (ZIP)
- 12,642
Population outlook (Cleburne County) Hauer SSP2
- Today (2025)
- 24,198 people
- By 2030
- 23,324 · -3.6%
- By 2040
- 21,566 · -10.9%
- By 2050
- 19,916 · -17.7%
- By 2075
- 16,744 · -30.8%
- By 2100
- 13,303 · -45.0%
Race, ethnicity, and origin ACS 2023
- Neighborhood character
- Predominantly White (93%)
- Race & ethnicity
- White 93% Two or more races 3% Hispanic / Latino 3%
- Common ancestry
- Italian 3% Slovak 2% Lithuanian 2%
- Foreign-born
- 1%
- Languages at home
- 99% English-only · Spanish 1%
Political lean MEDSL · Cleburne
- 2024 margin
- Solid R (+67.9) · D 15.2% · R 83.2% · Other 1.6%
- 2008→2024 swing
- -23.7pp toward R · 2008: -44.2pp · 2024: -67.9pp
- All cycles
- 2024: R+67.9 2020: R+65.8 2016: R+61.4 2012: R+52.2 2008: R+44.2
Not yet ingested
- Civics
- —
Market trends
- HPI YoY
- ▼ -78.45%
- Current HPI
- 215.4322
- Rent YoY
- —
- Metro
- —
- State GDP YoY
- ▲ 3.80%
- F500 in state
- 10
Industry mix (Fortune 500 HQ in AR)
| Industry | F500 HQs | Revenue |
|---|---|---|
| Retail | 1 | $681B |
|
||
| Food / Agriculture | 1 | $53B |
|
||
| Retail / Energy | 1 | $22B |
|
||
| Transportation / Logistics | 1 | $12B |
|
||
| Energy | 1 | $4B |
|
||
Price history
+113.7% since first listed22 events — show timeline
- 2026-04-24 Listed $125,000 CARMLS
- 2026-04-01 Listing Removed — CARMLS
- 2026-01-23 Listed $129,900 CARMLS
- 2025-12-01 Listing Removed — CARMLS
- 2025-10-01 Relisted — CARMLS
- 2025-10-01 Listing Removed — CARMLS
- 2025-09-17 Price Changed $132,500 CARMLS
- 2025-08-04 Listed $135,000 CARMLS
- 2022-08-16 Sold (Public Records) $105,000 Public Records
- 2022-08-12 Sold (MLS) $105,000 CARMLS
- 2022-08-09 Pending — CARMLS
- 2022-07-18 Contingent — CARMLS
- 2022-06-30 Price Changed $106,000 CARMLS
- 2022-06-22 Price Changed $108,000 CARMLS
- 2022-06-09 Listed $110,000 CARMLS
- 2019-09-25 Sold (MLS) $35,000 CARMLS
- 2019-08-20 Relisted — CARMLS
- 2019-04-04 Pending — CARMLS
- 2019-03-18 Listed $45,000 CARMLS
- 2018-12-27 Listing Removed — CARMLS
- 2018-09-11 Price Changed $53,500 CARMLS
- 2018-07-30 Listed $58,500 CARMLS
Property tax history
+4.0%/yrLatest (2025): $612 · +10.0% YoY. Source: county tax records.
Cash-flow waterfall
monthlySold comps — $/sqft
last 12 mo · ≤1 miLoading sold comps…