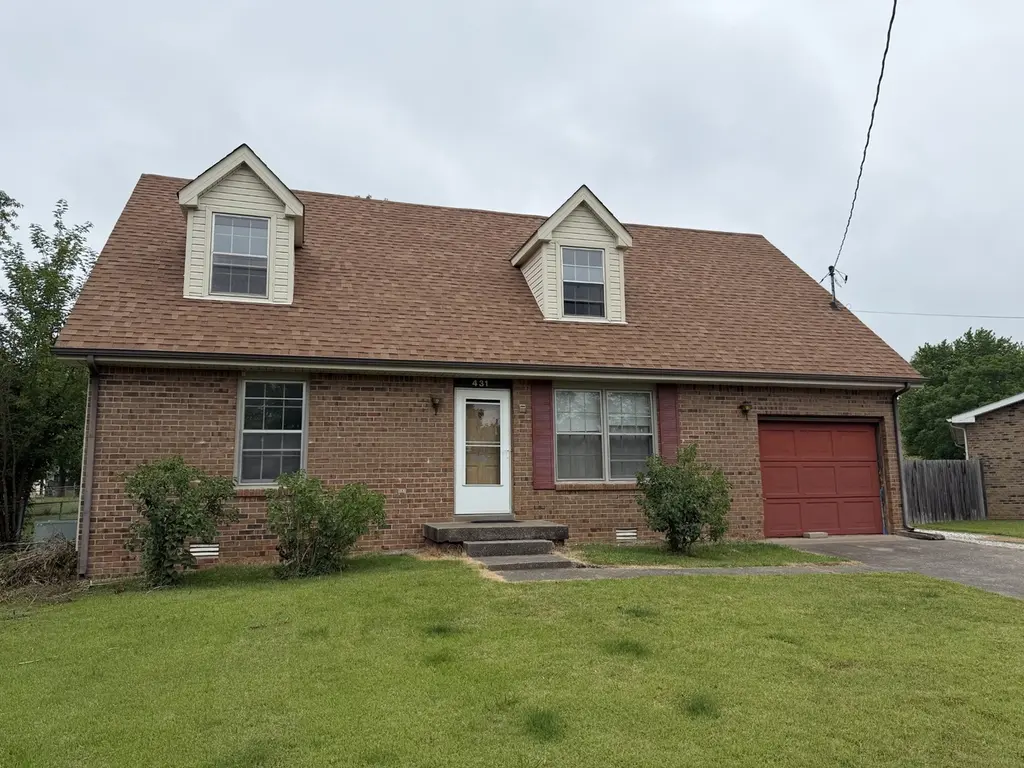
431 Helton Dr · Clarksville, TN
Flood risk 1/10 · Minimal
- FEMA flood zone
- X (unshaded)
- Chance of flooding over 30 yrs
- 0.0%
- Est. flood insurance / yr
- $507 – $1,088
Fire risk 1/10 · Minimal
- Est. fire insurance / yr
- $949 – $1,763
Heat risk 5/10 · Moderate
- Hot days now (above 108°F)
- 7 days/yr
- Hot days in 30 yrs
- 20 days/yr
Wind risk 4/10 · Minor
- Chance of severe wind over 30 yrs
- 10.0%
Air-quality risk 2/10 · Minimal
- Unhealthy air days now
- 1 days/yr
- Unhealthy air days in 30 yrs
- 1 days/yr
Risk factors via First Street. Map © Google.
Why this score? — see what drove the C+ grade
The composite is a weighted blend of 9 inputs, each scored 0–100. Each bar is that input's sub-score; the figure is the points it added to the 100-point composite (weight × sub-score).
- Cash flow +22.4/30.0
- ARV discount +15.0/15.0
- DSCR +7.2/10.0
- 1% rule +5.1/10.0
- Livability +4.2/5.0
- Rent growth +2.8/5.0
- Schools +2.5/10.0
- Condition / age +2.5/5.0
- Appreciation +0.0/10.0
$165,900
🖨 Deal sheet 📄 Offer letter ✓ Due diligence
Listing remarks
MULTIPLE OFFERS! Highest and best due 5/25/26 at 12pm! Looking for an investment opportunity? Maybe a flip? Well, look no further than 431 Helton Dr! This 4 bedroom 2 bath 1650sqft home is full of opportunity and priced accordingly! Roof is newer but the rest of the house will need some updating! Schedule your showing today! Interior pics to come later. SELLING AS IS
Key facts
- 9,147 sq ft lot
- Garage
- Built 1985
Property features AI
Finance
- HOA & community: Pets allowed
Exterior
- Parking: Attached garage (1 car); Garage faces front; 1 covered parking space; 1 total parking space
- Utilities: Public water; Public sewer; Electricity available; Water service available
- Home design: Single family residence; Residential property; Two levels; Entry level information not provided; Facing direction not provided
- Construction: Brick and vinyl siding exterior; Brick/mortar foundation; Year built: existing
- Exterior features: Sloped lot
Interior
- Kitchen: Range
- Bedrooms: 4 bedrooms total; 2 main-level bedrooms; Bedroom sizes: 19x13, 13x11, 13x10, 11x10
- Flooring: Carpet; Vinyl
- Bathrooms: 2 full bathrooms
- Heating & cooling: Central heating; Heat pump; Central air conditioning (electric)
- Interior features: Range; Carpet flooring; Vinyl flooring; Crawl space basement
Neighborhood map
What this means for you Summary
Snapshot
- This is a 4-bed/2.0-bath single-family listed at $166k.
Deal economics
- At list price, monthly cash flow is $275 ($3k/yr) — positive.
- The deal already cash-flows at list — no discount required.
- Meets the 1% rule at list price ($2k rent vs $166k).
- Cap rate 8.3% vs local median 3.5% in Clarksville — top-decile yield for the area; either an underpriced asset or a hidden risk that comps aren't pricing in. Stress-test before assuming the spread holds.
Location & tenants
- Location reads 84/100 on livability (#1 in TN, #798 nationally) — a professional / high-income tenant draw. Strengths: amenities A+, commute A+, cost of living A+; Watch: employment C-, crime D+.
- Montgomery County (urban): math 25% / reading 31% proficiency, ranked #65 of 139 in TN (top 47%) — low school quality limits family demand, transient renter base, plan for 1-2y turnover.
- Zoned schools: Kenwood Elementary (math 21% / reading 23%, grade F, #601 of 952 statewide, top 66%, 687 students, 0% FRL); Kenwood High (math 5% / reading 29%, grade F, #225 of 332 statewide, top 69%, 1,291 students, 0% FRL) — zoned schools average 0% FRL vs 40% district-wide (40 pts lower); this property's tenant base skews higher-income than the district average.
- Market conditions: Rents rising (+1.3%/yr); 893 active listings in the ZIP; 20 comparable units currently listed for rent nearby; rentals at typical pace (median 21d on market — plan ~3-4 weeks tenant-placement turnaround); 2,583 units permitted in Montgomery County in 2024 (617 in 5+ unit buildings).
Forward outlook
- Local home prices are declining (-3.0%/yr); year-one equity from $1k of loan paydown is wiped out by about $5k of value loss. Plan a longer hold.
- Montgomery County population projected at +49% by 2050 — long-run rental-demand tailwind backs the buy-and-hold thesis.
Negotiation context
- Only 4 days on market — expect competitive offers; lowballing is unlikely to land.
Risks & watch-outs
- Climate carrying-cost: extreme-heat days projected 7→20/yr by 2055 (HVAC capex compounding) — expect insurance premiums to compound above CPI over the hold.
Questions for the listing agent
- Is there a deadline driving the sale (1031 exchange, divorce, estate, relocation)? That informs how much negotiation room exists.
- Crime grade is D in this area — have there been break-ins, vandalism, or insurance claims at this property in the last 3 years? What carrier currently insures it and at what premium?
- What's the average days-on-market for RENTAL listings here right now (not sales)? A rising rental-DOM trend means longer vacancies and softer asking-rent achievability than the comps imply.
- What's the recent tenant-quality profile in this submarket — average credit score on applications, eviction rate, late-payment / NSF rate, and stable-employment percentage? A property-management company in the area should have these aggregated.
- How much new for-sale + rental construction is in the pipeline within 1–3 miles? Heavy new supply typically softens prices + rents 12–24 months out; constrained supply supports both.
Investment metrics
- 1% rule
- 1.01% ✓
- Cap rate
- 8.28%
- Cash-on-cash
- 7.11%
- DSCR
- 1.32
- GRM
- 8.3
CMA / ARV
- ARV (on-the-fly)
- $259,086
- Comps found
- 12
Show comp detail 12 sales within ~0.75 mi
| Address | Dist | Beds/Ba | Sqft | Sold | Price | $/sf | Match |
|---|---|---|---|---|---|---|---|
| 427 Helton Dr | 0.03mi | 4/2.0 | 1,344 (-10%) | 4mo | $195,000 | $145 | 79 |
| 1002 Roedeer Dr | 0.36mi | 3/2.0 (-1) | 1,401 (-6%) | 9mo | $220,000 | $157 | 61 |
| 503 Pollard Dr | 0.19mi | 3/2.5 (-1) | 1,650 (+11%) | 9mo | $250,000 | $152 | 58 |
| 152 Irish Hls | 0.38mi | 3/2.5 (-1) | 1,595 (+7%) | 6mo | $311,900 | $196 | 58 |
| 56 Hillsboro Rd | 0.51mi | 3/2.0 (-1) | 1,371 (-8%) | 0mo | $269,900 | $197 | 58 |
| 208 Dale Ter | 0.55mi | 3/1.5 (-1) | 1,430 (-4%) | 4mo | $254,900 | $178 | 58 |
| 154 Irish Hls | 0.55mi | 3/2.5 (-1) | 1,579 (+6%) | 8mo | $314,900 | $199 | 51 |
| 27 Binks Dr | 0.65mi | 3/1.5 (-1) | 1,400 (-6%) | 3mo | $177,500 | $127 | 50 |
| 221 Downer Dr | 0.58mi | 3/1.5 (-1) | 1,325 (-11%) | 0mo | $230,000 | $174 | 47 |
| 307 Southern Dr | 0.69mi | 3/1.0 (-1) | 1,350 (-9%) | 1mo | $199,000 | $147 | 42 |
| 427 Sarah Dr | 0.61mi | 3/2.0 (-1) | 1,285 (-14%) | 6mo | $275,000 | $214 | 39 |
| 103 Bo Ct | 0.69mi | 3/2.0 (-1) | 1,283 (-14%) | 2mo | $189,500 | $148 | 38 |
Match score weights: distance 35% · size 25% · config 20% · recency 20%. Top-matched comps best support the ARV.
Projected returns pro-forma
-3.0% appreciation · 1.27% rent growth · sell at horizon
- IRR
- -7.3%
- Equity multiple
- 0.74×
- Total profit
- $-12,253
- Equity at exit
- $24,736
- IRR
- 0.1%
- Equity multiple
- 1.01×
- Total profit
- $424
- Equity at exit
- $14,344
Cash invested: $46,452 (down + closing). Projections, not guarantees.
Landlord ↔ Tenant lean methodology
- Overall (STATE)
- 87 Strongly Landlord-Friendly
- State Tennessee
- 87 Strongly Landlord-Friendly · R+13
- County
- — inherits STATE
- City
- — inherits STATE
ZIP-level market 37042
- Home prices YoY
- -18.2%
- Rents YoY
- 1.3%
- Active inventory
- 893
- Price-to-rent
- 8.3×
Monthly cashflow live
- Estimated rent
- $1,668 high interval (Pro) →
- Mortgage (P&I)
- −$870
- Tax from tax record
- −$104 /mo · $1,244/yr
- Insurance
- −$69
- HOA
- −$0
- Vacancy / Maint / Mgmt
- −$350
- Net cashflow
- $275
Break-even live
UW: 25.0% down · 7.5% · 30yr · 1.5% tax · 5.0% vac · 8.0% maint · 8.0% mgmt
Financing live
Cash to close
- Down payment
- $41,475
- Closing costs
- $4,977
- Reserves months
- —
- Total cash needed
- —
Loan-product check · same deal, 3 products live
Conventional
25% down · 7.5% · 30yr
- Down + closing
- —
- Monthly P&I
- —
- Monthly cashflow
- —
- DSCR
- —
- Eligible?
- —
Personal DTI + credit; lowest rate.
DSCR
20% down · 8.5% · 30yr
- Down + closing
- —
- Monthly P&I
- —
- Monthly cashflow
- —
- DSCR
- —
- Eligible?
- —
No personal income docs; deal must DSCR.
Hard money
10% down · 12.0% · 12mo
- Down + closing
- —
- Monthly P&I
- —
- Monthly cashflow
- —
- DSCR
- —
- Eligible?
- —
Short-term bridge; refi at stabilization.
Rent comps 20 comps
| Address | Beds | Baths | Sqft | Rent | $/sqft | DOM | Units | Dist |
|---|---|---|---|---|---|---|---|---|
| 404 Carter Rd Clarksville, TN | 3.0 | 2.0 | 1600 | $1,550 | $0.97 | 13d | 1 | 0.17mi |
| 417 McMurry Rd Clarksville, TN | 3.0 | 2.0 | 1140 | $1,550 | $1.36 | 13d | 1 | 0.28mi |
| 808 Bedford Dr Clarksville, TN | 3.0 | 1.5 | 1186 | $1,350 | $1.14 | 13d | 1 | 0.39mi |
| 830 Peachers Mill Rd Clarksville, TN | 1.0–3.0 | 1.0–1.5 | 945 | $1,280 | $1.35 | 13d | 19 | 0.45mi |
| 735 Cayce Dr Clarksville, TN | 3.0 | 2.0 | 1390 | $1,600 | $1.15 | 21d | 1 | 0.85mi |
| 7 Dalewood Dr Clarksville, TN | 4.0 | 2.0 | 1726 | $1,450 | $0.84 | 21d | 1 | 0.85mi |
| 833 Lutz Ln Clarksville, TN | 3.0 | 2.0 | 1320 | $2,100 | $1.59 | 13d | 1 | 0.91mi |
| 500 Peachers Mill Rd Unit C2 Clarksville, TN | 3.0 | 2.5 | 1450 | $1,600 | $1.10 | 21d | 1 | 0.94mi |
| 500 Peachers Mill Rd Clarksville, TN | 3.0 | 2.5 | 1835 | $1,800 | $0.98 | 21d | 1 | 0.94mi |
| 124 Yorktown Rd Clarksville, TN | 3.0 | 1.0 | 1064 | $1,275 | $1.20 | 21d | 1 | 0.96mi |
| 4 Gettysburg St Clarksville, TN | 3.0 | 1.5 | 1358 | $1,500 | $1.10 | 13d | 1 | 1.06mi |
| 1080 Dublin Dr Clarksville, TN | 3.0 | 2.0 | 1300 | $1,639 | $1.26 | 13d | 1 | 1.06mi |
| 518 Bruce Jenner Dr Clarksville, TN | 3.0 | 2.0 | 1110 | $1,375 | $1.24 | 21d | 1 | 1.07mi |
| 2408 N Ford St Clarksville, TN | 3.0 | 2.0 | 1000 | $1,225 | $1.23 | 13d | 1 | 1.14mi |
| 1122 Rosebrook Dr Clarksville, TN | 3.0 | 2.5 | 1736 | $1,730 | $1.00 | 21d | 1 | 1.21mi |
| 226 Jim Thorpe Dr Clarksville, TN | 3.0 | 2.0 | 1488 | $1,545 | $1.04 | 21d | 1 | 1.27mi |
| 72 Seminole Trl Clarksville, TN | 3.0 | 2.0 | 980 | $1,300 | $1.33 | 21d | 1 | 1.30mi |
| 414A Oak St Clarksville, TN | 3.0 | 2.5 | 1472 | $1,900 | $1.29 | 21d | 1 | 1.30mi |
| 414 Oak St Clarksville, TN | 3.0 | 2.5 | 1472 | $2,000 | $1.36 | 21d | 1 | 1.30mi |
| 110 Rainbow St Clarksville, TN | 3.0 | 1.5 | 1845 | $1,750 | $0.95 | 13d | 1 | 1.45mi |
Listing history 2 events
-
2026-05-22$165,900 Active
-
2026-05-21historical $165,900
ⓘ Source: listings_history table (triggers on properties + properties_extension) + one-shot
backfill from property_details.listing_events for pre-trigger history.
Tax reassessment forecast TN · Resets to sale price
- Current annual tax
- $1,244 · $104/mo
- Projected year-2 tax
- $1,244 · $104/mo
- Expected delta
- $0/yr ($0/mo · 0.0%)
ⓘ Screening estimate from a state-policy table — verify with the county assessor before closing.
Climate risk First Street
- Flood 1/10 Low FEMA zone X (unshaded) · 0% chance over 30 yrs
- Wildfire 1/10 Low
- Heat 5/10 Major 7 d/yr ≥108°F today · 20 d/yr by 30 yrs out
- Wind 4/10 Moderate 10% chance of damaging wind over 30 yrs
- Air quality 2/10 Low 1 unhealthy d/yr today · 1 by 30 yrs out
Nearby sold comps map
Loading sold comps map…
Walkable amenities ~0.75 mi
Loading nearby amenities…
Taxation est. · year 1
- Rental income
- $20,019
- − Mortgage interest
- −$9,293
- − Property taxes
- −$1,244
- − Insurance
- −$830
- − Repairs & maintenance
- −$1,602
- − Management
- −$1,602
- − Depreciation
- −$4,826
- Taxable income
- $623
- Est. tax owed @ 24.0%
- −$150
- After-tax cash flow
- $3,152/yr
For passive investors: Depreciation is non-cash, so a rental often shows a tax loss while cash-flowing — sheltering income. Rental losses are passive: they offset passive income freely, and up to $25,000/yr can offset ordinary (W-2) income if you actively participate and your MAGI is under $100k (phasing out to $0 by $150k); unused losses carry forward. On sale, claimed depreciation is recaptured at up to 25%, and gains may owe capital-gains tax (a 1031 exchange can defer both). Figures are a year-1 estimate at your 24.0% rate — not tax advice; consult a CPA.
Schools (NCES district)
- District
- Montgomery County
- NCES district ID
- 4703030
- Math proficiency
- 25% ▼ -20.00%
- Reading proficiency
- 31% ▼ -10.00%
- Median HH income
- $50,423
- Composite
- 24.56/100
- National rank
- #7641
- State rank
- #65 of 139 in TN
Livability — Clarksville
- Score
- 84/100
- State rank
- #1
- US rank
- #798
Category grades
Schools grade is shown separately in the Schools card above.
Census & demographics
- Census place
- Clarksville, TN
- County
- Montgomery County · 211,371 people
- City population
- 211,371
- Metro
- Clarksville, TN-KY
- Population (ZIP)
- 87,652
- Household income
- $70,393
- Rent vs Own
- Severe rent burden
- 2093.0
Population outlook (Montgomery County) Hauer SSP2
- Today (2025)
- 236,633 people
- By 2030
- 258,978 · +9.4%
- By 2040
- 305,456 · +29.1%
- By 2050
- 353,147 · +49.2%
- By 2075
- 471,289 · +99.2%
- By 2100
- 564,122 · +138.4%
Race, ethnicity, and origin ACS 2023
- Neighborhood character
- Diverse neighborhood (Simpson 0.68)
- Race & ethnicity
- White 48% Black 26% Hispanic / Latino 15% Two or more races 13% Asian 3%
- Hispanic origin (detail)
- Mexican 6% Puerto Rican 4%
- Common ancestry
- Italian 4% Slovak 1% Lithuanian 1%
- Foreign-born
- 8% · Canada, South Korea, China
- Languages at home
- 88% English-only · Spanish 8% German/W. Germanic 1% Other Indo-European 1%
Political lean MEDSL · Montgomery
- 2024 margin
- R (+18.4) · D 40.0% · R 58.5% · Other 1.5%
- 2008→2024 swing
- -10.5pp toward R · 2008: -7.9pp · 2024: -18.4pp
- All cycles
- 2024: R+18.4 2020: R+12.7 2016: R+18.6 2012: R+10.5 2008: R+7.9
Not yet ingested
- Civics
- —
Market trends
- HPI YoY
- ▼ -58.81%
- Current HPI
- 264.4911
- Rent YoY
- ▲ 1.27%
- Metro
- Clarksville, TN-KY
- State GDP YoY
- ▲ 2.78%
- F500 in state
- 22
Industry mix (Fortune 500 HQ in TN)
| Industry | F500 HQs | Revenue |
|---|---|---|
| Healthcare | 3 | $91B |
|
||
| Retail | 3 | $72B |
|
||
| Transportation / Logistics | 1 | $88B |
|
||
| Paper / Packaging | 1 | $19B |
|
||
| Insurance | 1 | $13B |
|
||
| Energy | 1 | $12B |
|
||
Price history
+0.0% since first listed2 events — show timeline
- 2026-05-22 Listed $165,900 REALTRACS as Distributed by MLS Grid
- 2026-05-21 Coming Soon $165,900 REALTRACS as Distributed by MLS Grid
Property tax history
+3.4%/yrLatest (2025): $1,244 · +0.0% YoY. Source: county tax records.
Cash-flow waterfall
monthlySold comps — $/sqft
last 12 mo · ≤1 miLoading sold comps…