 Duplex
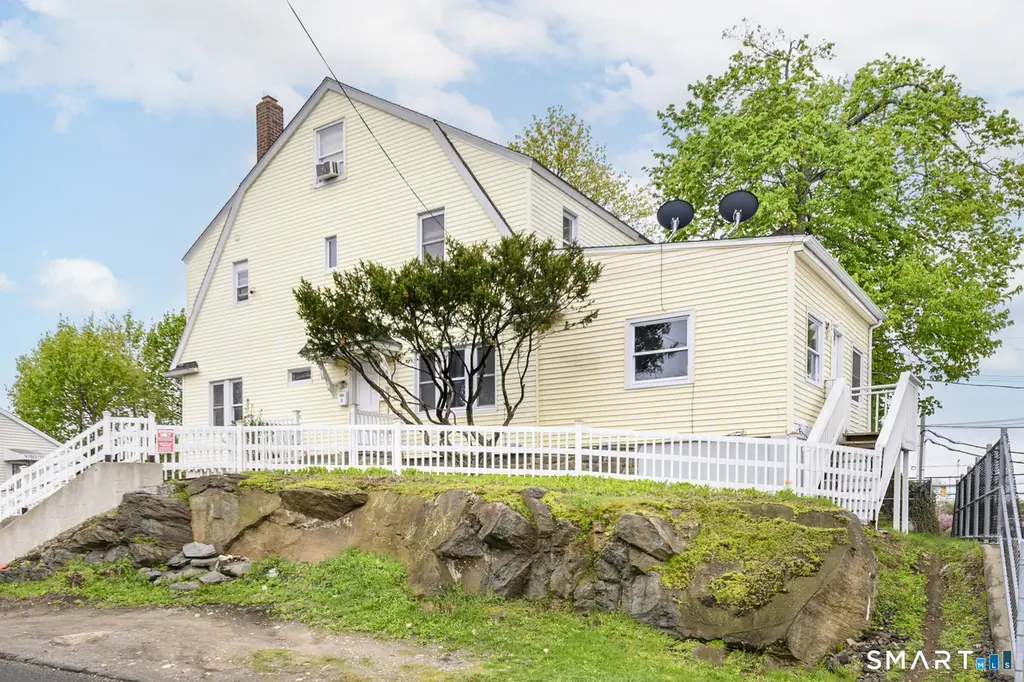
336 West Ave · Stamford, CT
Flood risk 1/10 · Minimal
- FEMA flood zone
- X (unshaded)
- Chance of flooding over 30 yrs
- 0.0%
- Est. flood insurance / yr
- $473 – $860
Fire risk 1/10 · Minimal
- Est. fire insurance / yr
- $829 – $1,539
Heat risk 6/10 · Moderate
- Hot days now (above 98°F)
- 7 days/yr
- Hot days in 30 yrs
- 16 days/yr
Wind risk 6/10 · Moderate
- Chance of severe wind over 30 yrs
- 69.0%
Air-quality risk 6/10 · Moderate
- Unhealthy air days now
- 9 days/yr
- Unhealthy air days in 30 yrs
- 13 days/yr
Risk factors via First Street. Map © Google.
Why this score? — see what drove the C grade
The composite is a weighted blend of 9 inputs, each scored 0–100. Each bar is that input's sub-score; the figure is the points it added to the 100-point composite (weight × sub-score).
- Cash flow +22.4/30.0
- ARV discount +9.2/15.0
- DSCR +7.2/10.0
- 1% rule +5.4/10.0
- Schools +3.5/10.0
- Livability +3.5/5.0
- Rent growth +3.0/5.0
- Condition / age +2.5/5.0
- Appreciation +0.0/10.0
$819,000
🖨 Deal sheet 📄 Offer letter ✓ Due diligence
Multi-family units
County records classify this as Multi-Family (2-4 Unit). Listing-text estimate: 2 units. confirmed
Listing remarks MLS
Wonderful Duplex on West Avenue! Home is located right in the center of town on a lovely level lot in a nice neighborhood. Wonderful floor plan features big & bright living rooms, fabulous formal dining rooms, spacious open kitchens, magnificent Master Bedrooms with huge closet space, additional enormous bedrooms, and gorgeous hallway baths. Exterior offers a one car attached garage and extra parking in expanded paved driveway. Call today and schedule a private showing before you miss out on making this your new home!
Key facts
- 4,791 sq ft lot
- Garage
- Built 1935
Property features AI
Finance
- Other:
- Financial info:
- HOA & community:
Exterior
- Parking: Attached under-house garage; Driveway parking; 2 total parking spaces; 1 garage (attached); Street parking available
- Security:
- Utilities: Public water connected; Public sewer connected; Domestic hot water
- Home design: Multi-family property (2-family)
- Construction: Frame construction; Stone foundation; Yellow exterior
- Exterior features: Corner lot; Aluminum siding; Asphalt shingle roof; Paved driveway; On-street parking
Interior
- Kitchen:
- Bedrooms: 4 bedrooms
- Flooring:
- Bathrooms: 2 full bathrooms
- Heating & cooling: Hot water heat; Natural gas fuel
- Interior features: 8 total rooms; Basement is full, partially finished, with garage access; Has a walk-up attic
- Laundry & utility: Laundry in the basement
Neighborhood map
What this means for you Summary
Snapshot
- This is a 2 × 2-bed/1.0-bath units multifamily listed at $819k.
Deal economics
- At list price, monthly cash flow is $1k ($16k/yr) — positive. Per door: $684/mo.
- The deal already cash-flows at list — no discount required.
- Meets the 1% rule at list price ($9k rent vs $819k).
- Recommended offer: $794k (3.0% below list) — sets the bar for market timing.
- Cap rate 8.3% vs local median 3.0% in Stamford — top-decile yield for the area; either an underpriced asset or a hidden risk that comps aren't pricing in. Stress-test before assuming the spread holds.
Location & tenants
- Location reads 70/100 on livability (#98 in CT) — a middle-class / working-renter tenant base. Strengths: employment A+, health & safety A+, crime A-; Watch: amenities F, commute F, cost of living F.
- Stamford School District (urban): math 32% / reading 43% proficiency, ranked #103 of 153 in CT (top 67%) — families likely to look elsewhere, expect single-tenant / working-renter base with shorter leases.
- Market conditions: Rents rising (+1.9%/yr); 188 active listings in the ZIP; 40 comparable units currently listed for rent nearby; rentals at typical pace (median 24d on market — plan ~3-4 weeks tenant-placement turnaround); solid renter incomes; 1,151 units permitted in Western Connecticut Planning Region in 2024 (714 in 5+ unit buildings).
- At $8,532/mo this rent would consume 108% of the median local household income ($95k/yr) (locally 4139% of renters already pay >50% of income on rent) — very limited rent-growth headroom before tenants either downsize or default.
Forward outlook
- Local home prices are declining (-3.0%/yr); year-one equity from $6k of loan paydown is wiped out by about $25k of value loss. Plan a longer hold.
Negotiation context
- It's been on market 51 days — a 3% lower offer ($794k) is reasonable based on typical stale-listing flexibility.
- 4 sale attempts since 20y ago with the ask held roughly flat each time — persistent listings suggest the price (not the market) is what's stuck; bring a comps-based counter.
- Current owner paid $342k; list at $819k implies a 139% gain — meaningful room to come down on a strong offer.
Risks & watch-outs
- Watch-outs: built in 1935 — expect roof / HVAC / electrical / plumbing capex.
- Climate carrying-cost: major wind risk, 69% chance of damaging wind over 30y; extreme-heat days projected 7→16/yr by 2055 (HVAC capex compounding) — expect insurance premiums to compound above CPI over the hold.
Questions for the listing agent
- It's been on market 51 days. Have you received any prior offers? Is the seller open to a 3% concession, seller financing, or rate buy-down credit?
- Can we see the unit-by-unit rent roll, current vacancy, and any below-market leases? What's the average tenancy length?
- What capital expenditures (roof, boiler, parking lot, exteriors) have been made in the last 5 years, and what's planned in the next 2?
- Built in 1935 — when were the roof, HVAC, electrical panel, plumbing, and water heater last replaced?
- Is there a deadline driving the sale (1031 exchange, divorce, estate, relocation)? That informs how much negotiation room exists.
- Schools are B-rated — typically a magnet for longer-tenancy family renters. What's the average tenant stay here, and is there a school-zone premium baked into asking?
- What's the average days-on-market for RENTAL listings here right now (not sales)? A rising rental-DOM trend means longer vacancies and softer asking-rent achievability than the comps imply.
- What's the recent tenant-quality profile in this submarket — average credit score on applications, eviction rate, late-payment / NSF rate, and stable-employment percentage? A property-management company in the area should have these aggregated.
- How much new apartment / multifamily construction is in the pipeline within 1–3 miles? Heavy new supply (>2% of stock underway) typically softens rents 12–24 months out; light construction supports rent growth.
Investment metrics
- 1% rule
- 1.04% ✓
- Cap rate
- 8.30%
- Cash-on-cash
- 7.16%
- DSCR
- 1.32
- GRM
- 8.0
CMA / ARV
- ARV (median comp)
- $851,659
- List price
- $819,000
- Delta
- -3.83%
- Verdict
- FAIR
- Comps
- 20 within 1.0 mi
Show comp detail 3 sales within ~0.75 mi
| Address | Dist | Beds/Ba | Sqft | Sold | Price | $/sf | Match |
|---|---|---|---|---|---|---|---|
| 29 Roosevelt Ave | 0.40mi | 3/3.0 (-1) | 2,658 (-6%) | 0mo | $805,000 | $303 | 62 |
| 94 Victory St | 0.26mi | 4/3.0 | 2,520 (-11%) | 11mo | $816,000 | $324 | 57 |
| 48 Congress St | 0.72mi | 4/2.0 | 2,530 (-10%) | 9mo | $848,000 | $335 | 42 |
Match score weights: distance 35% · size 25% · config 20% · recency 20%. Top-matched comps best support the ARV.
Projected returns pro-forma
-3.0% appreciation · 1.95% rent growth · sell at horizon
- IRR
- -6.5%
- Equity multiple
- 0.76×
- Total profit
- $-54,589
- Equity at exit
- $122,116
- IRR
- 1.8%
- Equity multiple
- 1.12×
- Total profit
- $28,577
- Equity at exit
- $70,812
Cash invested: $229,320 (down + closing). Projections, not guarantees.
Landlord ↔ Tenant lean methodology
- Overall (STATE)
- 27 Tenant-Leaning
- State Connecticut
- 27 Tenant-Leaning · D+7
- County
- — inherits STATE
- City
- — inherits STATE
ZIP-level market 06902
- Rents YoY
- 1.9%
- Active inventory
- 188
- Price-to-rent
- 16.0×
Monthly cashflow live
- Estimated rent
- $8,532 high interval (Pro) →
- Mortgage (P&I)
- −$4,295
- Tax from tax record
- −$737 /mo · $8,840/yr
- Insurance
- −$341
- HOA
- −$0
- Vacancy / Maint / Mgmt
- −$1,792
- Net cashflow
- $1,367
Break-even live
2-unit breakdown (identical units grouped — click to expand)
| Units | Beds | Baths | Est. rent |
|---|---|---|---|
| 2× units | 2 | 1 | $8,532 |
| #1 | 2 | 1 | $4,266 |
| #2 | 2 | 1 | $4,266 |
| Total (2 units) | $8,532 | ||
UW: 25.0% down · 7.5% · 30yr · 1.5% tax · 5.0% vac · 8.0% maint · 8.0% mgmt
Financing live
Cash to close
- Down payment
- $204,750
- Closing costs
- $24,570
- Reserves months
- —
- Total cash needed
- —
Loan-product check · same deal, 3 products live
Conventional
25% down · 7.5% · 30yr
- Down + closing
- —
- Monthly P&I
- —
- Monthly cashflow
- —
- DSCR
- —
- Eligible?
- —
Personal DTI + credit; lowest rate.
DSCR
20% down · 8.5% · 30yr
- Down + closing
- —
- Monthly P&I
- —
- Monthly cashflow
- —
- DSCR
- —
- Eligible?
- —
No personal income docs; deal must DSCR.
Hard money
10% down · 12.0% · 12mo
- Down + closing
- —
- Monthly P&I
- —
- Monthly cashflow
- —
- DSCR
- —
- Eligible?
- —
Short-term bridge; refi at stabilization.
Rent comps 40 comps
| Address | Beds | Baths | Sqft | Rent | $/sqft | DOM | Units | Dist |
|---|---|---|---|---|---|---|---|---|
| 510 W Main St Unit 2ND FL Stamford, CT | 3.0 | 1.0 | 2027 | $3,150 | $1.55 | 3d | 1 | 0.44mi |
| 51 Forest Ave Old Greenwich, CT | 3.0 | 3.0 | 1737 | $8,150 | $4.69 | 3d | 2 | 0.60mi |
| 51 Forest Ave #19 Old Greenwich, CT | 3.0 | 2.5 | 1946 | $8,500 | $4.37 | 43d | 1 | 0.60mi |
| 51 Forest Ave #26 Old Greenwich, CT | 3.0 | 3.0 | 2194 | $9,500 | $4.33 | 2d | 1 | 0.60mi |
| 16 Laddins Rock Rd Old Greenwich, CT | 5.0 | 4.5 | 4000 | $20,500 | $5.12 | 23d | 1 | 0.60mi |
| 36 Center Dr Old Greenwich, CT | 3.0 | 2.5 | 3328 | $11,300 | $3.40 | 43d | 1 | 0.65mi |
| 6 Halsey Dr Old Greenwich, CT | 4.0 | 3.0 | 2490 | $8,500 | $3.41 | 14d | 1 | 0.75mi |
| 34 Hassake Rd Old Greenwich, CT | 4.0 | 3.5 | 2943 | $16,000 | $5.44 | 43d | 1 | 0.77mi |
| 8 Potter Dr Old Greenwich, CT | 4.0 | 3.0 | 1979 | $10,500 | $5.31 | 44d | 1 | 0.78mi |
| 10 Durkin Pl Riverside, CT | 5.0 | 4.5 | 3245 | $17,500 | $5.39 | 43d | 1 | 0.83mi |
| 12 Westwood Dr Stamford, CT | 4.0 | 2.5 | 2734 | $6,500 | $2.38 | 23d | 1 | 0.84mi |
| 25 Arnold St Old Greenwich, CT | 4.0 | 3.0 | 2490 | $10,500 | $4.22 | 23d | 1 | 0.90mi |
| 60 Lockwood Ave Old Greenwich, CT | 5.0 | 3.5 | 2987 | $17,500 | $5.86 | 2d | 1 | 0.90mi |
| 1 Ernel Dr Riverside, CT | 5.0 | 3.5 | 2517 | $13,000 | $5.16 | 21d | 1 | 0.97mi |
| 8 Perry Pl Riverside, CT | 4.0 | 3.0 | 2556 | $11,500 | $4.50 | 21d | 1 | 1.03mi |
| 7 Joshua Slocum Dock Stamford, CT | 3.0 | 2.5 | 2858 | $14,000 | $4.90 | 3d | 1 | 1.03mi |
| 13 Lockwood Ave Old Greenwich, CT | 5.0 | 3.5 | 3275 | $22,000 | $6.72 | 43d | 1 | 1.05mi |
| 46 Cook Rd Stamford, CT | 5.0 | 4.5 | 3500 | $15,250 | $4.36 | 43d | 1 | 1.06mi |
| 314 Sound Beach Ave Old Greenwich, CT | 4.0 | 2.5 | 3007 | $15,500 | $5.15 | 43d | 1 | 1.06mi |
| 81 Dolphin Cove Quay Stamford, CT | 4.0 | 3.5 | 3273 | $16,000 | $4.89 | 23d | 1 | 1.10mi |
| 11 Roosevelt Ave Old Greenwich, CT | 5.0 | 2.5 | 3430 | $18,000 | $5.25 | 2d | 1 | 1.11mi |
| 11 Roosevelt Ave Old Greenwich, CT | 5.0 | 2.5 | 3430 | $21,000 | $6.12 | 43d | 1 | 1.11mi |
| 87 Dolphin Cove Quay Stamford, CT | 4.0 | 3.0 | 2115 | $14,000 | $6.62 | 14d | 1 | 1.11mi |
| 4 Wescott Ct Riverside, CT | 4.0 | 4.5 | 3950 | $15,000 | $3.80 | 23d | 1 | 1.13mi |
| 25 Weston Hill Rd Riverside, CT | 3.0 | 3.0 | 2531 | $10,950 | $4.33 | 3d | 1 | 1.14mi |
| 6 Irvine Rd Old Greenwich, CT | 3.0 | 3.0 | 2066 | $12,500 | $6.05 | 3d | 1 | 1.15mi |
| 1 Crawford Ter Riverside, CT | 4.0 | 4.0 | 2819 | $18,000 | $6.39 | 21d | 1 | 1.17mi |
| 15 Shorelands Pl Old Greenwich, CT | 4.0 | 3.5 | 3271 | $19,000 | $5.81 | 21d | 1 | 1.18mi |
| 15 Shorelands Pl Old Greenwich, CT | 4.0 | 3.5 | 3271 | $19,000 | $5.81 | 19d | 1 | 1.18mi |
| 71 S Park Ave Old Greenwich, CT | 4.0 | 2.5 | 3723 | $17,500 | $4.70 | 43d | 1 | 1.19mi |
| 175 Dolphin Cove Quay Stamford, CT | 5.0 | 3.5 | 3492 | $16,000 | $4.58 | 43d | 1 | 1.23mi |
| 14 Rainbow Dr Riverside, CT | 5.0 | 3.5 | 3510 | $16,000 | $4.56 | 23d | 1 | 1.24mi |
| 21 Spring St Riverside, CT | 5.0 | 4.0 | 2924 | $18,000 | $6.16 | 43d | 1 | 1.25mi |
| 187 Dolphin Cove Quay Stamford, CT | 4.0 | 3.5 | 2510 | $13,000 | $5.18 | 43d | 1 | 1.26mi |
| 38 Sheephill Rd Riverside, CT | 3.0 | 2.5 | 2600 | $8,200 | $3.15 | 43d | 1 | 1.27mi |
| 14 Shoalpoint Ln Riverside, CT | 4.0 | 2.5 | 2340 | $14,000 | $5.98 | 23d | 1 | 1.28mi |
| 26 Revere Rd Riverside, CT | 4.0 | 2.5 | 2383 | $13,900 | $5.83 | 11d | 1 | 1.29mi |
| 26 Revere Rd Riverside, CT | 4.0 | 2.5 | 2383 | $13,900 | $5.83 | 10d | 1 | 1.29mi |
| 15 Lancer Rd Riverside, CT | 4.0 | 2.5 | 3031 | $8,889 | $2.93 | 23d | 1 | 1.36mi |
| 9 Grimes Rd Old Greenwich, CT | 5.0 | 3.5 | 2799 | $22,500 | $8.04 | 43d | 1 | 1.39mi |
Listing history 25 events
-
2026-06-18days on market $819,000 Active 51 DOM
-
2026-06-17days on market $819,000 Active 50 DOM
-
2026-06-16days on market $819,000 Active 49 DOM
-
2026-06-15days on market $819,000 Active 48 DOM
-
2026-06-13days on market $819,000 Active 46 DOM
-
2026-06-13days on market $819,000 Active 45 DOM
-
2026-06-10days on market $819,000 Active 43 DOM
-
2026-06-09days on market $819,000 Active 42 DOM
-
2026-06-08days on market $819,000 Active 41 DOM
-
2026-06-07days on market $819,000 Active 40 DOM
-
2026-06-05days on market $819,000 Active 37 DOM
-
2026-06-03days on market $819,000 Active 36 DOM
-
2026-06-03days on market $819,000 Active 35 DOM
-
2026-06-01days on market $819,000 Active 34 DOM
-
2026-05-31days on market $819,000 Active 33 DOM
-
2026-05-13price $819,000 746-char remark
-
2026-04-28$845,000 Active 746-char remark
-
2016-05-31soldstatus $342,000 527-char remark
Show marketing remark (527 chars)
Wonderful Duplex on West Avenue! Home is located right in the center of town on a lovely level lot in a nice neighborhood. Wonderful floor plan features big & bright living rooms, fabulous formal dining rooms, spacious open kitchens, magnificent Master Bedrooms with huge closet space, additional enormous bedrooms, and gorgeous hallway baths. Exterior offers a one car attached garage and extra parking in expanded paved driveway. Call today and schedule a private showing before you miss out on making this your new home!
-
2016-05-08historical 527-char remark
Show marketing remark (527 chars)
Wonderful Duplex on West Avenue! Home is located right in the center of town on a lovely level lot in a nice neighborhood. Wonderful floor plan features big & bright living rooms, fabulous formal dining rooms, spacious open kitchens, magnificent Master Bedrooms with huge closet space, additional enormous bedrooms, and gorgeous hallway baths. Exterior offers a one car attached garage and extra parking in expanded paved driveway. Call today and schedule a private showing before you miss out on making this your new home!
-
2016-03-23$274,900 527-char remark
Show marketing remark (527 chars)
Wonderful Duplex on West Avenue! Home is located right in the center of town on a lovely level lot in a nice neighborhood. Wonderful floor plan features big & bright living rooms, fabulous formal dining rooms, spacious open kitchens, magnificent Master Bedrooms with huge closet space, additional enormous bedrooms, and gorgeous hallway baths. Exterior offers a one car attached garage and extra parking in expanded paved driveway. Call today and schedule a private showing before you miss out on making this your new home!
-
2012-02-18historical
-
2012-01-10$250,000
-
2007-02-26soldstatus $600,000
-
2007-02-16soldstatus $600,000
-
2006-12-08$609,000
ⓘ Source: listings_history table (triggers on properties + properties_extension) + one-shot
backfill from property_details.listing_events for pre-trigger history.
Tax reassessment forecast CT · Partial reset (capped growth)
- Current annual tax
- $8,840 · $737/mo
- Projected year-2 tax
- $13,183 · $1,099/mo
- Expected delta
- +$4,343/yr (+$362/mo · 49.1%)
ⓘ Screening estimate from a state-policy table — verify with the county assessor before closing.
Climate risk First Street
- Flood 1/10 Low FEMA zone X (unshaded) · 0% chance over 30 yrs
- Wildfire 1/10 Low
- Heat 6/10 Major 7 d/yr ≥98°F today · 16 d/yr by 30 yrs out
- Wind 6/10 Major 69% chance of damaging wind over 30 yrs
- Air quality 6/10 Major 9 unhealthy d/yr today · 13 by 30 yrs out
Nearby sold comps map
Loading sold comps map…
Walkable amenities ~0.75 mi
Loading nearby amenities…
Taxation est. · year 1
- Rental income
- $102,384
- − Mortgage interest
- −$45,877
- − Property taxes
- −$8,840
- − Insurance
- −$4,095
- − Repairs & maintenance
- −$8,191
- − Management
- −$8,191
- − Depreciation
- −$23,825
- Taxable income
- $3,365
- Est. tax owed @ 24.0%
- −$808
- After-tax cash flow
- $15,602/yr
For passive investors: Depreciation is non-cash, so a rental often shows a tax loss while cash-flowing — sheltering income. Rental losses are passive: they offset passive income freely, and up to $25,000/yr can offset ordinary (W-2) income if you actively participate and your MAGI is under $100k (phasing out to $0 by $150k); unused losses carry forward. On sale, claimed depreciation is recaptured at up to 25%, and gains may owe capital-gains tax (a 1031 exchange can defer both). Figures are a year-1 estimate at your 24.0% rate — not tax advice; consult a CPA.
Schools (NCES district)
- District
- Stamford School District
- NCES district ID
- 0904320
- Math proficiency
- 32% ▼ -10.00%
- Reading proficiency
- 43% ▼ -7.00%
- Median HH income
- $78,843
- Composite
- 35.14/100
- National rank
- #5010
- State rank
- #103 of 153 in CT
Livability — Stamford
- Score
- 70/100
- State rank
- #98
- US rank
- #7716
Category grades
Schools grade is shown separately in the Schools card above.
Census & demographics
- Census place
- Stamford, CT
- County
- Fairfield County · 765,532 people
- City population
- 123,058
- Metro
- Bridgeport-Stamford-Norwalk, CT
- Population (ZIP)
- 73,392
- Household income
- $94,843
- Rent vs Own
- Severe rent burden
- 4139.0
Population outlook (Western Connecticut County) Hauer SSP2
- By 2040
- 685,031
Race, ethnicity, and origin ACS 2023
- Neighborhood character
- Highly diverse neighborhood (Simpson 0.71)
- Race & ethnicity
- Hispanic / Latino 35% White 32% Black 23% Two or more races 13% Asian 7%
- Hispanic origin (detail)
- Mexican 3% Puerto Rican 4% Dominican 3%
- Common ancestry
- Hispanic 5% Romanian 3% Scotch-Irish 1%
- Foreign-born
- 36% · Canada, Jamaica, China
- Languages at home
- 51% English-only · Spanish 30% French/Haitian/Cajun 6% Other Indo-European 4%
Political lean MEDSL · Western Connecticut
- 2024 margin
- D (+19.1) · D 58.8% · R 39.7% · Other 1.6%
- All cycles
- 2024: D+19.1
Not yet ingested
- Civics
- —
Market trends
- HPI YoY
- ▼ -450.67%
- Current HPI
- 173.4108
- Rent YoY
- ▲ 1.95%
- Metro
- Bridgeport-Stamford-Norwalk, CT
- State GDP YoY
- ▲ 1.06%
- F500 in state
- 38
Industry mix (Fortune 500 HQ in CT)
| Industry | F500 HQs | Revenue |
|---|---|---|
| Industrial Machinery | 4 | $38B |
|
||
| Insurance | 3 | $71B |
|
||
| Financial Services | 2 | $25B |
|
||
| Transportation / Logistics | 2 | $18B |
|
||
| Healthcare | 1 | $247B |
|
||
| Telecommunications | 1 | $55B |
|
||
Price history
+34.5% since first listed10 events — show timeline
- 2026-05-13 Price Changed $819,000 Smart MLS
- 2026-04-28 Listed $845,000 Smart MLS
- 2016-05-31 Sold (MLS) $342,000 Smart MLS
- 2016-05-08 Listing Removed — Smart MLS
- 2016-03-23 Listed $274,900 Smart MLS
- 2012-02-18 Listing Removed — Smart MLS
- 2012-01-10 Listed $250,000 Smart MLS
- 2007-02-26 Sold (Public Records) $600,000 Public Records
- 2007-02-16 Sold (MLS) $600,000 Smart MLS
- 2006-12-08 Listed $609,000 Smart MLS
Property tax history
+4.7%/yrLatest (2022): $8,840 · +0.9% YoY. Source: county tax records.
Cash-flow waterfall
monthlySold comps — $/sqft
last 12 mo · ≤1 miLoading sold comps…