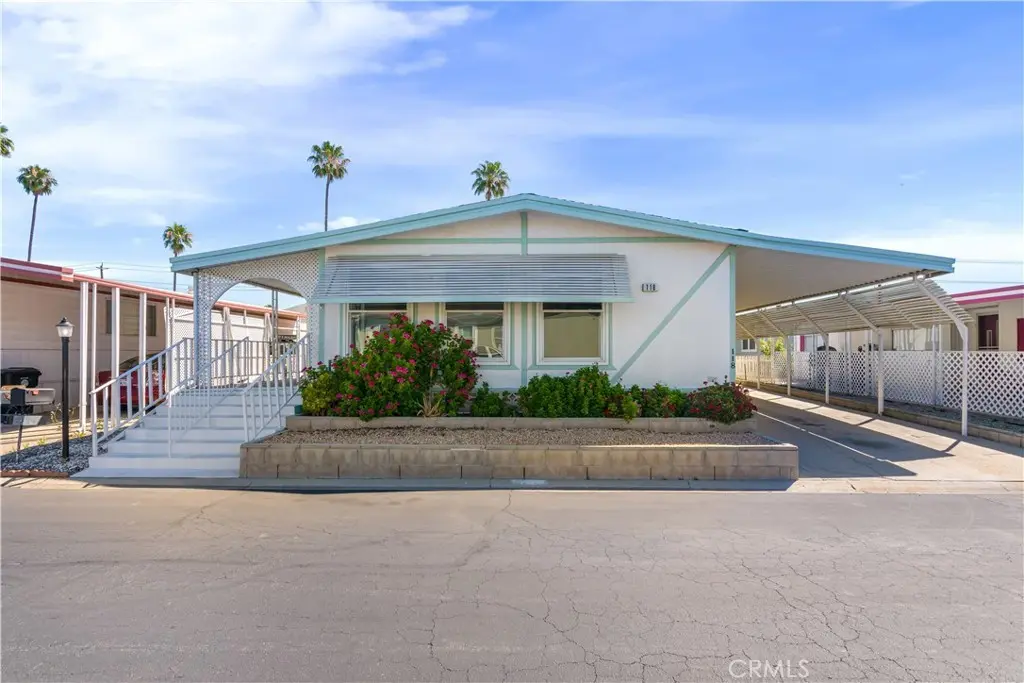
601 N Kirby St #118 · Hemet, CA
Flood risk 1/10 · Minimal
- FEMA flood zone
- X (unshaded)
- Chance of flooding over 30 yrs
- 0.0%
- Est. flood insurance / yr
- $507 – $1,088
Fire risk 6/10 · Moderate
- Est. fire insurance / yr
- $659 – $1,223
Heat risk 7/10 · Major
- Hot days now (above 104°F)
- 5 days/yr
- Hot days in 30 yrs
- 14 days/yr
Wind risk 1/10 · Minimal
- Chance of severe wind over 30 yrs
- —
Air-quality risk 6/10 · Moderate
- Unhealthy air days now
- 12 days/yr
- Unhealthy air days in 30 yrs
- 14 days/yr
Risk factors via First Street. Map © Google.
Why this score? — see what drove the C+ grade
The composite is a weighted blend of 9 inputs, each scored 0–100. Each bar is that input's sub-score; the figure is the points it added to the 100-point composite (weight × sub-score).
- Cash flow +30.0/30.0
- 1% rule +10.0/10.0
- DSCR +10.0/10.0
- Condition / age +3.8/5.0
- Rent growth +3.7/5.0
- Livability +2.6/5.0
- Schools +2.5/10.0
- ARV discount +0.0/15.0
- Appreciation +0.0/10.0
$72,000
🖨 Deal sheet 📄 Offer letter ✓ Due diligence
Listing remarks MLS
Your Next Chapter Starts Here — and It's a Good One! Welcome to the good life in Hemet's sought-after 55+ community! This darling 2BD/2BA gem is move-in ready — open, airy layout, bright kitchen, cozy dining nook, covered front porch, and a private outdoor area that's all yours. The seller genuinely wants you to feel at home from day one, and has thoughtfully arranged support toward your first month's costs so you can settle in with total peace of mind. Resort-style perks await — pool, golf course, dog park, and clubhouse — with shopping, dining, and medical services just minutes away. Downsizing never looked this good. Come see it — you'll want to stay.
Key facts
- Community pool
- Built 1977
- Listed 83 days
Neighborhood map
What this means for you Summary
Snapshot
- This is a 2-bed/2.0-bath manufactured listed at $72k. Condition is rated good.
Deal economics
- At list price, monthly cash flow is $1k ($14k/yr) — positive.
- The deal already cash-flows at list — no discount required.
- Meets the 1% rule at list price ($2k rent vs $72k).
- Recommended offer: $68k (6.0% below list) — sets the bar for market timing.
- Cap rate 25.3% vs local median 4.9% in Hemet — top-decile yield for the area; either an underpriced asset or a hidden risk that comps aren't pricing in. Stress-test before assuming the spread holds.
Location & tenants
- Location reads 51/100 on livability (#1,056 in CA) — a working-class tenant base; expect higher turnover. Strengths: housing A+; Watch: crime D+, schools F, amenities F.
- Hemet Unified (suburban): math 19% / reading 41% proficiency, ranked #360 of 517 in CA (top 70%) — families likely to look elsewhere, expect single-tenant / working-renter base with shorter leases; 66% free/reduced lunch — lower-income household profile, screen leases tightly.
- Market conditions: Rents rising fast (+4.9%/yr); 323 active listings in the ZIP; 38 comparable units currently listed for rent nearby; rentals at typical pace (median 25d on market — plan ~3-4 weeks tenant-placement turnaround); 9,195 units permitted in Riverside County in 2024 (1,512 in 5+ unit buildings).
- This rent runs 34% of the median local income ($74k/yr) — at the standard rent-burdened threshold; future hikes will face affordability resistance.
Forward outlook
- Local home prices are declining (-3.0%/yr); year-one equity from $498 of loan paydown is wiped out by about $2k of value loss. Plan a longer hold.
- Riverside County population projected at +22% by 2050 — long-run rental-demand tailwind backs the buy-and-hold thesis.
- At projected returns (-3.0% appreciation + 4.9% rent growth), your $20k cash investment doubles in ~2 years — after that, you're playing with house money.
Negotiation context
- It's been on market 83 days — a 6% lower offer ($68k) is reasonable based on typical stale-listing flexibility.
- 6 sale attempts since 2y ago; this cycle's ask has dropped $15k (18%) from the opening price — seller is motivated, your offer sets the floor, not the list.
Risks & watch-outs
- Climate carrying-cost: major wildfire risk; extreme-heat days projected 5→14/yr by 2055 (HVAC capex compounding) — expect insurance premiums to compound above CPI over the hold.
Questions for the listing agent
- It's been on market 83 days. Have you received any prior offers? Is the seller open to a 6% concession, seller financing, or rate buy-down credit?
- Built in 1977 — when were the roof, HVAC, electrical panel, plumbing, and water heater last replaced?
- Why hasn't it sold? Are there any deal-killer items the seller is aware of (foundation, flood, title, zoning, code violations)?
- Is there a deadline driving the sale (1031 exchange, divorce, estate, relocation)? That informs how much negotiation room exists.
- Schools are F-rated, which usually means shorter tenancies and higher turnover. Who's the typical renter profile here, and what's been the actual vacancy rate?
- Crime grade is D in this area — have there been break-ins, vandalism, or insurance claims at this property in the last 3 years? What carrier currently insures it and at what premium?
- What's the average days-on-market for RENTAL listings here right now (not sales)? A rising rental-DOM trend means longer vacancies and softer asking-rent achievability than the comps imply.
- What's the recent tenant-quality profile in this submarket — average credit score on applications, eviction rate, late-payment / NSF rate, and stable-employment percentage? A property-management company in the area should have these aggregated.
- How much new for-sale + rental construction is in the pipeline within 1–3 miles? Heavy new supply typically softens prices + rents 12–24 months out; constrained supply supports both.
Investment metrics
- 1% rule
- 2.88% ✓
- Cap rate
- 25.32%
- Cash-on-cash
- 67.96%
- DSCR
- 4.02
- GRM
- 2.9
CMA / ARV
- ARV (median comp)
- $51,674
- List price
- $72,000
- Delta
- 39.33%
- Verdict
- OVERPRICED
- Comps
- 20 within 1.0 mi
Show comp detail 12 sales within ~0.75 mi
| Address | Dist | Beds/Ba | Sqft | Sold | Price | $/sf | Match |
|---|---|---|---|---|---|---|---|
| 601 N Kirby St #501 | 0.24mi | 2/2.0 | 1,440 (0%) | 0mo | $49,000 | $34 | 89 |
| 601 Kirby St N #451 | 0.24mi | 2/2.0 | 1,440 (0%) | 0mo | $60,000 | $42 | 88 |
| 601 Kirby St N #235 | 0.24mi | 2/2.0 | 1,440 (0%) | 3mo | $84,000 | $58 | 87 |
| 601 N Kirby #177 | 0.42mi | 2/2.0 | 1,344 (-7%) | 1mo | $10,000 | $7 | 69 |
| 1525 W Oakland Ave #62 | 0.66mi | 2/2.0 | 1,440 (0%) | 2mo | $40,000 | $28 | 67 |
| 542 Castille | 0.56mi | 2/2.0 | 1,392 (-3%) | 2mo | $239,000 | $172 | 67 |
| 1420 Cabrillo Dr | 0.72mi | 2/2.0 | 1,440 (0%) | 1mo | $247,500 | $172 | 66 |
| 601 N Kirby St #267 | 0.24mi | 2/2.0 | 1,248 (-13%) | 3mo | $82,250 | $66 | 64 |
| 1895 W Devonshire #20 | 0.56mi | 2/2.0 | 1,344 (-7%) | 1mo | $44,000 | $33 | 62 |
| 1895 W Devonshire Ave #74 | 0.56mi | 3/2.0 (+1) | 1,344 (-7%) | 2mo | $80,000 | $60 | 56 |
| 1300 Menlo Ave #81 | 0.75mi | 3/2.0 (+1) | 1,612 (+12%) | 1mo | $155,000 | $96 | 39 |
| 1150 N Kirby #75 | 0.74mi | 3/2.0 (+1) | 1,248 (-13%) | 0mo | $107,000 | $86 | 38 |
Match score weights: distance 35% · size 25% · config 20% · recency 20%. Top-matched comps best support the ARV.
Projected returns pro-forma
-3.0% appreciation · 4.9% rent growth · sell at horizon
- IRR
- 69.5%
- Equity multiple
- 4.23×
- Total profit
- $65,120
- Equity at exit
- $10,735
- IRR
- 74.1%
- Equity multiple
- 9.32×
- Total profit
- $167,707
- Equity at exit
- $6,225
Cash invested: $20,160 (down + closing). Projections, not guarantees.
Landlord ↔ Tenant lean methodology
- Overall (STATE)
- 18 Strongly Tenant-Friendly
- State California
- 18 Strongly Tenant-Friendly · D+13
- County
- — inherits STATE
- City
- — inherits STATE
ZIP-level market 92544
- Rents YoY
- 4.9%
- Active inventory
- 323
- Price-to-rent
- 2.9×
Monthly cashflow live
- Estimated rent
- $2,075 high interval (Pro) →
- Mortgage (P&I)
- −$378
- Tax est. 1.5%
- −$90 /mo · $1,080/yr
- Insurance
- −$30
- HOA
- −$0
- Vacancy / Maint / Mgmt
- −$436
- Net cashflow
- $1,142
Break-even live
UW: 25.0% down · 7.5% · 30yr · 1.5% tax · 5.0% vac · 8.0% maint · 8.0% mgmt
Financing live
Cash to close
- Down payment
- $18,000
- Closing costs
- $2,160
- Reserves months
- —
- Total cash needed
- —
Loan-product check · same deal, 3 products live
Conventional
25% down · 7.5% · 30yr
- Down + closing
- —
- Monthly P&I
- —
- Monthly cashflow
- —
- DSCR
- —
- Eligible?
- —
Personal DTI + credit; lowest rate.
DSCR
20% down · 8.5% · 30yr
- Down + closing
- —
- Monthly P&I
- —
- Monthly cashflow
- —
- DSCR
- —
- Eligible?
- —
No personal income docs; deal must DSCR.
Hard money
10% down · 12.0% · 12mo
- Down + closing
- —
- Monthly P&I
- —
- Monthly cashflow
- —
- DSCR
- —
- Eligible?
- —
Short-term bridge; refi at stabilization.
Rent comps 38 comps
| Address | Beds | Baths | Sqft | Rent | $/sqft | DOM | Units | Dist |
|---|---|---|---|---|---|---|---|---|
| 2770 W Devonshire Ave Hemet, CA | 1.0–2.0 | 1.0–2.0 | 707 | $1,945 | $2.75 | 2d | 11 | 0.28mi |
| 811 Alondra Dr Hemet, CA | 2.0 | 2.0 | 1166 | $1,875 | $1.61 | 5d | 1 | 0.36mi |
| 1964 W Oakland Ave Hemet, CA | 2.0 | 2.0 | 977 | $1,695 | $1.73 | 18d | 1 | 0.36mi |
| 853 Ensenada Dr Hemet, CA | 2.0 | 2.0 | 1350 | $1,875 | $1.39 | 24d | 1 | 0.38mi |
| 853 Ensenada Dr Hemet, CA | 2.0 | 2.0 | 1350 | $1,875 | $1.39 | 12d | 1 | 0.38mi |
| 627 Solano Dr Hemet, CA | 2.0 | 2.0 | 882 | $1,800 | $2.04 | 18d | 1 | 0.41mi |
| 1862 Pueblo Dr Unit 1862 Hemet, CA | 2.0 | 2.0 | 977 | $1,750 | $1.79 | 24d | 1 | 0.42mi |
| 1862 Pueblo Dr Hemet, CA | 2.0 | 2.0 | 977 | $1,900 | $1.94 | 44d | 1 | 0.42mi |
| 743 Via Linda Dr Hemet, CA | 2.0 | 2.0 | 1206 | $1,995 | $1.65 | 5d | 1 | 0.43mi |
| 2014 Iris Way Hemet, CA | 3.0 | 2.0 | 1192 | $2,850 | $2.39 | 44d | 1 | 0.46mi |
| 1700 Walden Ln Hemet, CA | 3.0 | 2.0 | 1430 | $2,670 | $1.87 | 24d | 1 | 0.56mi |
| 543 La Cresta Dr Hemet, CA | 2.0 | 2.0 | 1544 | $1,595 | $1.03 | 44d | 1 | 0.57mi |
| 2208 El Grande St Hemet, CA | 2.0 | 2.0 | 1327 | $2,100 | $1.58 | 18d | 1 | 0.57mi |
| 3471 Dublin Ct Hemet, CA | 3.0 | 2.0 | 1276 | $2,895 | $2.27 | 4d | 1 | 0.60mi |
| 663 Mariposa Dr Hemet, CA | 2.0 | 2.0 | 1440 | $1,500 | $1.04 | 24d | 1 | 0.73mi |
| 446 N Elk St Unit D Hemet, CA | 2.0 | 1.0 | 980 | $1,675 | $1.71 | 24d | 1 | 0.78mi |
| 1270 Rosalia Ave Unit 1 Hemet, CA | 2.0 | 1.0 | 900 | $1,800 | $2.00 | 44d | 1 | 0.81mi |
| 3030 W Acacia Ave Hemet, CA | 1.0–3.0 | 1.0–2.0 | 892 | $1,895 | $2.12 | 2d | 10 | 0.84mi |
| 3800 W Devonshire Ave Hemet, CA | 3.0 | 1.0–2.0 | 816 | $2,055 | $2.52 | 2d | 8 | 0.85mi |
| 2098 W Acacia Ave Hemet, CA | 1.0–3.0 | 1.0–2.0 | 895 | $2,035 | $2.27 | 2d | 1 | 0.86mi |
| 2469 W Acacia Ave Hemet, CA | 2.0 | 2.0 | 910 | $1,750 | $1.92 | 24d | 1 | 0.86mi |
| 2403 W Acacia Ave Hemet, CA | 2.0 | 2.0 | 910 | $1,995 | $2.19 | 8d | 1 | 0.87mi |
| 250 N Elk St Hemet, CA | 2.0 | 1.0 | 900 | $1,625 | $1.81 | 14d | 1 | 0.87mi |
| 1245 Millie Dr Hemet, CA | 3.0 | 2.0 | 1392 | $2,850 | $2.05 | 8d | 1 | 0.90mi |
| 828 Coramdeo Ct Hemet, CA | 3.0 | 2.0 | 1543 | $3,000 | $1.94 | 44d | 1 | 0.90mi |
| 1315 W Latham Ave Hemet, CA | 3.0 | 2.5 | 1340 | $2,550 | $1.90 | 44d | 1 | 0.91mi |
| 1850 Amberwood Dr Hemet, CA | 2.0 | 2.0 | 1170 | $1,561 | $1.33 | 44d | 1 | 1.16mi |
| 471 Whitney Dr Hemet, CA | 2.0 | 2.0 | 1085 | $1,800 | $1.66 | 5d | 1 | 1.18mi |
| 1461 W Mayberry Ave Hemet, CA | 2.0 | 2.0 | 1044 | $1,750 | $1.68 | 44d | 1 | 1.28mi |
| 1967 Connor Ln San Jacinto, CA | 3.0 | 2.5 | 1708 | $2,950 | $1.73 | 8d | 1 | 1.28mi |
| 683 Jonquil St Hemet, CA | 3.0 | 2.0 | 1150 | $2,448 | $2.13 | 24d | 1 | 1.30mi |
| 1844 Paradise Way San Jacinto, CA | 3.0 | 2.0 | 1540 | $3,000 | $1.95 | 44d | 1 | 1.30mi |
| 4400 W Florida Ave Unit 86 Hemet, CA | 3.0 | 2.0 | 1310 | $1,800 | $1.37 | 44d | 1 | 1.35mi |
| 4400 W Florida Ave Spc 26 Hemet, CA | 3.0 | 2.0 | 1193 | $1,699 | $1.42 | 15d | 1 | 1.37mi |
| 1521 W Westmont Ave Hemet, CA | 2.0 | 2.0 | 1197 | $2,000 | $1.67 | 44d | 1 | 1.46mi |
| 415 S Tahquitz Ave Hemet, CA | 3.0 | 2.0 | 1766 | $2,900 | $1.64 | 18d | 1 | 1.48mi |
| 1241 Sandlewood Dr Hemet, CA | 2.0 | 1.5 | 1504 | $2,000 | $1.33 | 44d | 1 | 1.48mi |
| 471 S Simpson Ave Unit D Hemet, CA | 2.0 | 2.0 | 900 | $1,750 | $1.94 | 44d | 1 | 1.50mi |
Listing history 28 events
-
2026-06-18days on market $72,000 Active 83 DOM
-
2026-06-17days on market $72,000 Active 82 DOM
-
2026-06-16days on market $72,000 Active 81 DOM
-
2026-06-15days on market $72,000 Active 80 DOM
-
2026-06-13days on market $72,000 Active 78 DOM
-
2026-06-09days on market $72,000 Active 74 DOM
-
2026-06-08days on market $72,000 Active 73 DOM
-
2026-06-08price $72,000 Active 72 DOM
-
2026-06-07days on market $87,300 Active 72 DOM
-
2026-06-04days on market $87,300 Active 69 DOM
-
2026-06-03days on market $87,300 Active 68 DOM
-
2026-06-02days on market $87,300 Active 67 DOM
-
2026-06-01days on market $87,300 Active 66 DOM
-
2026-05-31days on market $87,300 Active 65 DOM
-
2026-03-27$87,300 Active 693-char remark
Show marketing remark (693 chars)
Your Next Chapter Starts Here — and It's a Good One! Welcome to the good life in Hemet's sought-after 55+ community! This darling 2BD/2BA gem is move-in ready — open, airy layout, bright kitchen, cozy dining nook, covered front porch, and a private outdoor area that's all yours. The seller genuinely wants you to feel at home from day one, and has thoughtfully arranged support toward your first month's costs so you can settle in with total peace of mind. Resort-style perks await — pool, golf course, dog park, and clubhouse — with shopping, dining, and medical services just minutes away. Downsizing never looked this good. Come see it — you'll want to stay.
-
2026-03-23historical $87,300 693-char remark
Show marketing remark (693 chars)
Your Next Chapter Starts Here — and It's a Good One! Welcome to the good life in Hemet's sought-after 55+ community! This darling 2BD/2BA gem is move-in ready — open, airy layout, bright kitchen, cozy dining nook, covered front porch, and a private outdoor area that's all yours. The seller genuinely wants you to feel at home from day one, and has thoughtfully arranged support toward your first month's costs so you can settle in with total peace of mind. Resort-style perks await — pool, golf course, dog park, and clubhouse — with shopping, dining, and medical services just minutes away. Downsizing never looked this good. Come see it — you'll want to stay.
-
2026-03-18historical
-
2026-03-05status Active
-
2026-02-27status Active
-
2025-09-26price $88,500
-
2025-07-17$112,988 Active
-
2025-07-02historical
-
2025-02-17historical
-
2024-09-25price $82,000
-
2024-08-19$88,000 Active
-
2024-07-21historical
-
2024-03-20price $94,900
-
2024-02-08$100,000 Active
ⓘ Source: listings_history table (triggers on properties + properties_extension) + one-shot
backfill from property_details.listing_events for pre-trigger history.
Climate risk First Street
- Flood 1/10 Low FEMA zone X (unshaded) · 0% chance over 30 yrs
- Wildfire 6/10 Major
- Heat 7/10 Severe 5 d/yr ≥104°F today · 14 d/yr by 30 yrs out
- Wind 1/10 Low
- Air quality 6/10 Major 12 unhealthy d/yr today · 14 by 30 yrs out
Nearby sold comps map
Loading sold comps map…
Walkable amenities ~0.75 mi
Loading nearby amenities…
Taxation est. · year 1
- Rental income
- $24,900
- − Mortgage interest
- −$4,033
- − Property taxes
- −$1,080
- − Insurance
- −$360
- − Repairs & maintenance
- −$1,992
- − Management
- −$1,992
- − Depreciation
- −$2,095
- Taxable income
- $13,348
- Est. tax owed @ 24.0%
- −$3,204
- After-tax cash flow
- $10,497/yr
For passive investors: Depreciation is non-cash, so a rental often shows a tax loss while cash-flowing — sheltering income. Rental losses are passive: they offset passive income freely, and up to $25,000/yr can offset ordinary (W-2) income if you actively participate and your MAGI is under $100k (phasing out to $0 by $150k); unused losses carry forward. On sale, claimed depreciation is recaptured at up to 25%, and gains may owe capital-gains tax (a 1031 exchange can defer both). Figures are a year-1 estimate at your 24.0% rate — not tax advice; consult a CPA.
Condition & rehab AI · 2 photos
This mobile home is move-in ready with a good exterior and interior condition, and minimal maintenance required.
Value-add opportunities
- Both Paint the exterior — Enhances curb appeal and resale value.
- Both Trim the landscaping — Improves curb appeal and rental value by making the property look more maintained.
Renovation cost estimate screening
Value-add ROI direction
- Both Paint the exterior — Enhances curb appeal and resale value. ↑
- Both Trim the landscaping — Improves curb appeal and rental value by making the property look more maintained. ↑
ⓘ Cost ranges are severity-bucket heuristics (US national rule-of-thumb). Get contractor quotes + a written scope before underwriting a rehab budget.
Schools (NCES district)
- District
- Hemet Unified
- NCES district ID
- 0616920
- Math proficiency
- 19% ▼ -3.00%
- Reading proficiency
- 41% ▲ 4.00%
- Median HH income
- $39,962
- Composite
- 25.16/100
- National rank
- #7517
- State rank
- #360 of 517 in CA
Livability — Hemet
- Score
- 51/100
- State rank
- #1056
- US rank
- #25208
Category grades
Schools grade is shown separately in the Schools card above.
Census & demographics
- Census place
- Hemet, CA
- County
- Riverside County · 2,287,001 people
- City population
- 137,670
- Metro
- Riverside-San Bernardino-Ontario, CA
- Population (ZIP)
- 51,751
- Household income
- $73,596
- Rent vs Own
- Severe rent burden
- 1518.0
Population outlook (Riverside County) Hauer SSP2
- Today (2025)
- 2,664,475 people
- By 2030
- 2,802,692 · +5.2%
- By 2040
- 3,050,904 · +14.5%
- By 2050
- 3,256,783 · +22.2%
- By 2075
- 3,655,058 · +37.2%
- By 2100
- 3,766,594 · +41.4%
Race, ethnicity, and origin ACS 2023
- Neighborhood character
- Diverse neighborhood (Simpson 0.59)
- Race & ethnicity
- Hispanic / Latino 49% White 40% Two or more races 18% Black 5% Asian 3% Native American 2%
- Hispanic origin (detail)
- Mexican 43% Puerto Rican 1%
- Common ancestry
- Slovak 2% Italian 2% Portuguese 2%
- Foreign-born
- 15% · Canada, China
- Languages at home
- 70% English-only · Spanish 27% Other Asian/Pacific 1% Other Indo-European 1%
Political lean MEDSL · Riverside
- 2024 margin
- Toss-up / Even · D 48.0% · R 49.3% · Other 2.6%
- 2008→2024 swing
- -3.6pp toward R · 2008: 2.3pp · 2024: -1.3pp
- All cycles
- 2024: R+1.3 2020: D+8.0 2016: D+4.3 2012: R+0.4 2008: D+2.3
Not yet ingested
- Civics
- —
Market trends
- HPI YoY
- ▼ -219.06%
- Current HPI
- 391.972
- Rent YoY
- ▲ 4.90%
- Metro
- Riverside-San Bernardino-Ontario, CA
- State GDP YoY
- ▲ 3.21%
- F500 in state
- 116
Industry mix (Fortune 500 HQ in CA)
| Industry | F500 HQs | Revenue |
|---|---|---|
| Technology | 27 | $1,492B |
|
||
| Financial Services | 3 | $174B |
|
||
| Retail | 3 | $44B |
|
||
| Insurance | 3 | $26B |
|
||
| Media / Entertainment | 2 | $115B |
|
||
| Pharmaceuticals / Biotech | 2 | $62B |
|
||
Price history
-12.7% since first listed14 events — show timeline
- 2026-03-27 Listed $87,300 CRMLS
- 2026-03-23 Coming Soon $87,300 CRMLS
- 2026-03-18 Listing Removed — CRMLS
- 2026-03-05 Relisted — CRMLS
- 2026-02-27 Relisted — CRMLS
- 2025-09-26 Price Changed $88,500 CRMLS
- 2025-07-17 Listed $112,988 CRMLS
- 2025-07-02 Coming Soon — CRMLS
- 2025-02-17 Listing Removed — CRMLS
- 2024-09-25 Price Changed $82,000 CRMLS
- 2024-08-19 Listed $88,000 CRMLS
- 2024-07-21 Listing Removed — CRMLS
- 2024-03-20 Price Changed $94,900 CRMLS
- 2024-02-08 Listed $100,000 CRMLS
Cash-flow waterfall
monthlySold comps — $/sqft
last 12 mo · ≤1 miLoading sold comps…