11 Vista Palm Ln #201 · Florida Ridge, FL
Flood risk 8/10 · Major
- FEMA flood zone
- X (unshaded)
- Chance of flooding over 30 yrs
- 0.99%
- Est. flood insurance / yr
- $507 – $1,088
Fire risk 4/10 · Minor
- Est. fire insurance / yr
- $947 – $1,759
Heat risk 10/10 · Severe
- Hot days now (above 106°F)
- 7 days/yr
- Hot days in 30 yrs
- 24 days/yr
Wind risk 10/10 · Severe
- Chance of severe wind over 30 yrs
- 99.0%
Air-quality risk 1/10 · Minimal
- Unhealthy air days now
- 0 days/yr
- Unhealthy air days in 30 yrs
- 0 days/yr
Risk factors via First Street. Map © Google.
Why this score? — see what drove the C- grade
The composite is a weighted blend of 9 inputs, each scored 0–100. Each bar is that input's sub-score; the figure is the points it added to the 100-point composite (weight × sub-score).
- ARV discount +15.0/15.0
- Cash flow +11.5/30.0
- 1% rule +10.0/10.0
- Schools +4.2/10.0
- Livability +3.6/5.0
- Rent growth +3.5/5.0
- DSCR +3.4/10.0
- Condition / age +2.5/5.0
- Appreciation +0.0/10.0
$105,000
🖨 Deal sheet 📄 Offer letter ✓ Due diligence
Listing remarks
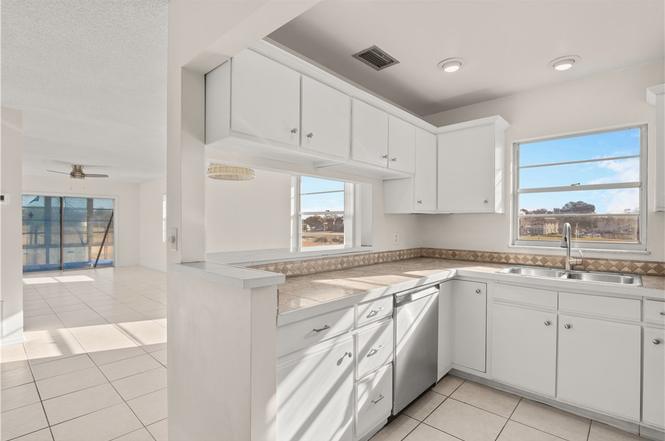
Location, location, location! This desirable sun-filled corner unit is just a short walk to the community pool, clubhouse, tennis courts, and shuffleboard. Enjoy peaceful golf course views and new flooring/deck in the screened-in porch—perfect for relaxing or entertaining. Bring your imagination and make it your own in this very active and welcoming 55+ community, with a short drive to the beautiful local beaches, restaurants and shopping. Washer and dryer hookups in unit!! Make an offer!!
Key facts
- Clubhouse
- Community pool
- Tennis courts
Tags
Property features AI
Finance
- Financial info: Pets not allowed
- HOA & community: Association (Campbell) with monthly fee of $627; Association fee includes common areas, cable TV, insurance, maintenance of structure, recreation facilities, reserve fund, sewer, trash, and water; Community amenities: billiard room, clubhouse, fitness center, library, on-site property manager, shuffleboard, tennis courts, pool; Senior community
Exterior
- Parking: Assigned, uncovered parking
- Utilities: Public water; County sewer
- Home design: 2-story building
- Construction: Block and concrete construction
- Exterior features: Patio; Screened patio; Community pool; Corner lot; Less than quarter acre; Has view; Faces west; Property attached
Interior
- Kitchen: Microwave; Range; Refrigerator; Electric water heater
- Bedrooms: Bedroom (13 x 11); Bedroom (13 x 13)
- Flooring: Carpet; Tile
- Bathrooms: 2 full bathrooms
- Heating & cooling: Central heating; Central air conditioning
- Interior features: Sliding doors; Walk-in closet(s); Unfurnished
- Laundry & utility: Common area laundry
Neighborhood map
What this means for you Summary
Snapshot
- This is a 2-bed/2.0-bath townhouse listed at $105k.
Deal economics
- At list price, monthly cash flow is $-102 ($-1k/yr) — negative.
- To cash-flow at today's rent, offer at most $87k (17.1% below list).
- Meets the 1% rule at list price ($2k rent vs $105k).
- Recommended offer: $87k (17.1% below list) — sets the bar for cash-flow.
- Cap rate 5.9% vs local median 4.5% in Florida Ridge — top-decile yield for the area; either an underpriced asset or a hidden risk that comps aren't pricing in. Stress-test before assuming the spread holds.
Location & tenants
- Location reads 72/100 on livability (#353 in FL) — a middle-class / working-renter tenant base. Strengths: commute A+, cost of living A+, housing A+; Watch: schools D, employment D, amenities F.
- Indian River (other): math 48% / reading 52% proficiency, ranked #35 of 73 in FL (top 48%) — acceptable for families but not a draw, mixed tenant base, ~2y average lease.
- Market conditions: Rents rising fast (+4.2%/yr); 348 active listings in the ZIP; 35 comparable units currently listed for rent nearby; rentals at typical pace (median 21d on market — plan ~3-4 weeks tenant-placement turnaround); 564 units permitted in Indian River County in 2024 (281 in 5+ unit buildings).
- This rent runs 31% of the median local income ($67k/yr) — at the standard rent-burdened threshold; future hikes will face affordability resistance.
Forward outlook
- Local home prices are declining (-3.0%/yr); year-one equity from $726 of loan paydown is wiped out by about $3k of value loss. Plan a longer hold.
- Indian River County population projected at +18% by 2050 — long-run rental-demand tailwind backs the buy-and-hold thesis.
Negotiation context
- It's been on market 95 days — a 9% lower offer ($96k) is reasonable based on typical stale-listing flexibility.
- 2 sale attempts since 3y ago; this cycle's ask has dropped $10k (9%) from the opening price — seller is motivated, your offer sets the floor, not the list.
- Current owner paid $63k; list at $105k implies a 67% gain — meaningful room to come down on a strong offer.
Risks & watch-outs
- Watch-outs: flood insurance adds $66/mo; HOA is 37% of rent.
- Climate carrying-cost: severe flood risk; severe wind risk, 99% chance of damaging wind over 30y; extreme-heat days projected 7→24/yr by 2055 (HVAC capex compounding) — expect insurance premiums to compound above CPI over the hold.
Questions for the listing agent
- What do current leases actually rent for vs. the listed asking? Can we see a recent rent roll and the last 12 months of T-12 income?
- It's been on market 95 days. Have you received any prior offers? Is the seller open to a 17% concession, seller financing, or rate buy-down credit?
- Built in 1974 — when were the roof, HVAC, electrical panel, plumbing, and water heater last replaced?
- What's the actual annual flood-insurance premium (NFIP or private), and is the property in a SFHA with mandatory coverage?
- What does the HOA fee cover, when was the last increase, and are there any pending special assessments or reserve-fund shortfalls?
- Why hasn't it sold? Are there any deal-killer items the seller is aware of (foundation, flood, title, zoning, code violations)?
- Is there a deadline driving the sale (1031 exchange, divorce, estate, relocation)? That informs how much negotiation room exists.
- Schools are D-rated, which usually means shorter tenancies and higher turnover. Who's the typical renter profile here, and what's been the actual vacancy rate?
- What's the average days-on-market for RENTAL listings here right now (not sales)? A rising rental-DOM trend means longer vacancies and softer asking-rent achievability than the comps imply.
- What's the recent tenant-quality profile in this submarket — average credit score on applications, eviction rate, late-payment / NSF rate, and stable-employment percentage? A property-management company in the area should have these aggregated.
- How much new for-sale + rental construction is in the pipeline within 1–3 miles? Heavy new supply typically softens prices + rents 12–24 months out; constrained supply supports both.
Investment metrics
- 1% rule
- 1.62% ✓
- Cap rate
- 5.89%
- Cash-on-cash
- -1.44%
- DSCR
- 0.94
- GRM
- 5.2
CMA / ARV
- ARV (on-the-fly)
- $135,000
- Comps found
- 12
Show comp detail 12 sales within ~0.75 mi
| Address | Dist | Beds/Ba | Sqft | Sold | Price | $/sf | Match |
|---|---|---|---|---|---|---|---|
| 11 Vista Palm Ln #201 | 0.00mi | 2/2.0 | 1,000 (0%) | 0mo | $95,000 | $95 | 100 |
| 11 S Vista Palm Ln #102 | 0.00mi | 2/2.0 | 1,000 (0%) | 2mo | $120,000 | $120 | 98 |
| 9 Vista Palm Ln #201 | 0.06mi | 2/2.0 | 1,000 (0%) | 2mo | $60,000 | $60 | 95 |
| 5 Vista Palm Ln #207 | 0.14mi | 2/2.0 | 1,000 (0%) | 1mo | $135,000 | $135 | 92 |
| 5 Vista Palm Ln #101 | 0.14mi | 2/2.0 | 1,000 (0%) | 1mo | $145,000 | $145 | 92 |
| 36 Pine Arbor Ln #102 | 0.25mi | 2/2.0 | 1,000 (0%) | 1mo | $122,000 | $122 | 87 |
| 56 Woodland Dr #201 | 0.40mi | 2/2.0 | 1,000 (0%) | 2mo | $165,000 | $165 | 79 |
| 89 Crooked Tree Ln #106 | 0.51mi | 2/2.0 | 1,000 (0%) | 2mo | $89,000 | $89 | 74 |
| 68 Royal Oak Ct #201 | 0.59mi | 2/2.0 | 1,000 (0%) | 1mo | $162,000 | $162 | 72 |
| 81 Crooked Tree Ln #107 | 0.59mi | 2/2.0 | 1,000 (0%) | 2mo | $178,000 | $178 | 70 |
| 94 Spring Lake Dr #106 | 0.65mi | 2/2.0 | 1,000 (0%) | 2mo | $176,000 | $176 | 68 |
| 73 Royal Oak Ct #206 | 0.67mi | 2/2.0 | 1,000 (0%) | 1mo | $110,000 | $110 | 68 |
Match score weights: distance 35% · size 25% · config 20% · recency 20%. Top-matched comps best support the ARV.
Projected returns pro-forma
-3.0% appreciation · 4.18% rent growth · sell at horizon
- IRR
- -20.0%
- Equity multiple
- 0.29×
- Total profit
- $-20,981
- Equity at exit
- $15,656
- IRR
- -7.8%
- Equity multiple
- 0.45×
- Total profit
- $-16,138
- Equity at exit
- $9,078
Cash invested: $29,400 (down + closing). Projections, not guarantees.
Landlord ↔ Tenant lean methodology
- Overall (STATE)
- 87 Strongly Landlord-Friendly
- State Florida
- 87 Strongly Landlord-Friendly · R+3
- County
- — inherits STATE
- City
- — inherits STATE
ZIP-level market 32962
- Rents YoY
- 4.2%
- Active inventory
- 348
- Price-to-rent
- 5.2×
Monthly cashflow live
- Estimated rent
- $1,698 high interval (Pro) →
- Mortgage (P&I)
- −$551
- Tax from tax record
- −$155 /mo · $1,860/yr
- Insurance
- −$44
- Flood insurance flood zone
- −$66 /mo · $798/yr
- HOA
- −$627
- Vacancy / Maint / Mgmt
- −$357
- Net cashflow
- $-102
Break-even live
UW: 25.0% down · 7.5% · 30yr · 1.5% tax · 5.0% vac · 8.0% maint · 8.0% mgmt
Financing live
Cash to close
- Down payment
- $26,250
- Closing costs
- $3,150
- Reserves months
- —
- Total cash needed
- —
Loan-product check · same deal, 3 products live
Conventional
25% down · 7.5% · 30yr
- Down + closing
- —
- Monthly P&I
- —
- Monthly cashflow
- —
- DSCR
- —
- Eligible?
- —
Personal DTI + credit; lowest rate.
DSCR
20% down · 8.5% · 30yr
- Down + closing
- —
- Monthly P&I
- —
- Monthly cashflow
- —
- DSCR
- —
- Eligible?
- —
No personal income docs; deal must DSCR.
Hard money
10% down · 12.0% · 12mo
- Down + closing
- —
- Monthly P&I
- —
- Monthly cashflow
- —
- DSCR
- —
- Eligible?
- —
Short-term bridge; refi at stabilization.
Rent comps 35 comps
| Address | Beds | Baths | Sqft | Rent | $/sqft | DOM | Units | Dist |
|---|---|---|---|---|---|---|---|---|
| 19 Pine Arbor Ln #105 Vero Beach, FL | 1.0 | 1.5 | 750 | $1,800 | $2.40 | 21d | 1 | 0.11mi |
| 28 Pine Arbor Ln #103 Vero Beach, FL | 1.0 | 1.5 | 750 | $1,200 | $1.60 | 21d | 1 | 0.14mi |
| 16 Vista Palm Ln Vero Beach, FL | 1.0–2.0 | 1.5–2.0 | 800 | $1,700 | $2.12 | 21d | 2 | 0.14mi |
| 5 Vista Palm Ln #203 Vero Beach, FL | 1.0 | 1.5 | 750 | $1,500 | $2.00 | 13d | 1 | 0.14mi |
| 37 Pine Arbor Ln #101 Vero Beach, FL | 2.0 | 2.0 | 1000 | $1,600 | $1.60 | 13d | 1 | 0.19mi |
| 36 Pine Arbor Ln Vero Beach, FL | 2.0 | 2.0 | 1000 | $1,550 | $1.55 | 21d | 2 | 0.22mi |
| 58 Woodland Dr #206 Vero Beach, FL | 2.0 | 2.0 | 1000 | $1,800 | $1.80 | 13d | 1 | 0.39mi |
| 50 Woodland Dr #203 Vero Beach, FL | 1.0 | 1.5 | 750 | $1,350 | $1.80 | 13d | 1 | 0.44mi |
| 65 Woodland Dr #207 Vero Beach, FL | 2.0 | 2.0 | 1000 | $1,600 | $1.60 | 21d | 1 | 0.47mi |
| 86 Crooked Tree Ln #102 Vero Beach, FL | 2.0 | 2.0 | 1000 | $2,000 | $2.00 | 13d | 1 | 0.54mi |
| 85 Crooked Tree Ln #203 Vero Beach, FL | 1.0 | 1.5 | 750 | $1,450 | $1.93 | 21d | 1 | 0.57mi |
| 80 Crooked Tree Ln #106 Vero Beach, FL | 2.0 | 2.0 | 1000 | $1,900 | $1.90 | 13d | 1 | 0.59mi |
| 355 6th Rd SW Vero Beach, FL | 3.0 | 1.0 | 880 | $1,800 | $2.05 | 21d | 1 | 0.61mi |
| 710 Timber Ridge Trl SW Vero Beach, FL | 3.0 | 2.0 | 1498 | $2,500 | $1.67 | 21d | 1 | 0.67mi |
| 650 N Center Ct SW Unit 102 Vero Beach, FL | 3.0 | 2.0 | 1440 | $2,100 | $1.46 | 21d | 1 | 0.68mi |
| 103 Royal Oak Dr #106 Vero Beach, FL | 2.0 | 2.0 | 1000 | $1,800 | $1.80 | 13d | 1 | 0.69mi |
| 95 Spring Lake Dr #103 Vero Beach, FL | 1.0 | 1.5 | 750 | $1,600 | $2.13 | 21d | 1 | 0.70mi |
| 734 5th Pl SW Vero Beach, FL | 3.0 | 1.0 | 1402 | $1,800 | $1.28 | 21d | 1 | 0.70mi |
| 161 6th Ct SW Vero Beach, FL | 2.0 | 1.0 | 1298 | $1,590 | $1.22 | 13d | 1 | 0.70mi |
| 102 Royal Oak Dr #105 Vero Beach, FL | 1.0 | 1.5 | 750 | $1,550 | $2.07 | 21d | 1 | 0.74mi |
| 721 Timber Ridge Trl SW Unit D Vero Beach, FL | 2.0 | 2.0 | 1368 | $2,300 | $1.68 | 21d | 1 | 0.82mi |
| 43 Vista Gardens Trl #205 Vero Beach, FL | 1.0 | 1.5 | 750 | $1,450 | $1.93 | 21d | 1 | 1.13mi |
| 23 Vista Gardens Trl #203 Vero Beach, FL | 1.0 | 1.5 | 750 | $1,500 | $2.00 | 21d | 1 | 1.17mi |
| 26 Vista Gardens Trl #203 Vero Beach, FL | 1.0 | 1.5 | 750 | $1,350 | $1.80 | 21d | 1 | 1.26mi |
| 36 Vista Gardens Trl #201 Vero Beach, FL | 2.0 | 2.0 | 1000 | $1,390 | $1.39 | 21d | 1 | 1.28mi |
| 34 Vista Gardens Trl #107 Vero Beach, FL | 2.0 | 2.0 | 1000 | $1,350 | $1.35 | 21d | 1 | 1.28mi |
| 35 Vista Gardens Trl #205 Vero Beach, FL | 1.0 | 1.5 | 934 | $1,400 | $1.50 | 21d | 1 | 1.30mi |
| 28 Vista Gardens Trl #102 Vero Beach, FL | 2.0 | 2.0 | 1000 | $1,550 | $1.55 | 21d | 1 | 1.30mi |
| 670 E Lake Jasmine Cir #106 Vero Beach, FL | 2.0 | 2.0 | 1414 | $2,750 | $1.94 | 21d | 1 | 1.30mi |
| 4 Vista Gardens Trl #207 Vero Beach, FL | 2.0 | 2.0 | 1000 | $1,550 | $1.55 | 13d | 1 | 1.32mi |
| 11 Vista Gardens Trl #106 Vero Beach, FL | 2.0 | 2.0 | 1000 | $1,600 | $1.60 | 21d | 1 | 1.32mi |
| 655 W Lake Jasmine Cir #207 Vero Beach, FL | 2.0 | 2.0 | 1213 | $1,850 | $1.53 | 13d | 1 | 1.33mi |
| 740 Lake Orchid Cir #109 Vero Beach, FL | 2.0 | 2.0 | 1200 | $2,000 | $1.67 | 21d | 1 | 1.35mi |
| 720 Lake Orchid Cir #203 Vero Beach, FL | 2.0 | 2.0 | 1414 | $1,500 | $1.06 | 21d | 1 | 1.35mi |
| 528 7th Sq #102 Vero Beach, FL | 2.0 | 2.0 | 1095 | $3,000 | $2.74 | 21d | 1 | 1.41mi |
HOA detail
- Monthly dues
- $627 · $7,524/yr
- Likely covers
- pool
Listing history 8 events
-
2026-05-30statusdays on market $105,000 Pending 95 DOM
-
2026-05-18historical Active Under Contract
-
2026-04-22price $105,000
-
2026-02-04$115,000 Active
-
2023-12-08historical $1,700
-
2023-11-10$1,700
-
2002-05-31soldstatus $63,000
-
1983-11-01soldstatus $63,000
ⓘ Source: listings_history table (triggers on properties + properties_extension) + one-shot
backfill from property_details.listing_events for pre-trigger history.
Tax reassessment forecast FL · Resets to sale price
- Current annual tax
- $1,860 · $155/mo
- Projected year-2 tax
- $1,860 · $155/mo
- Expected delta
- $0/yr ($0/mo · 0.0%)
ⓘ Screening estimate from a state-policy table — verify with the county assessor before closing.
Climate risk First Street
- Flood 8/10 Severe FEMA zone X (unshaded) · 99% chance over 30 yrs
- Wildfire 4/10 Moderate
- Heat 10/10 Extreme 7 d/yr ≥106°F today · 24 d/yr by 30 yrs out
- Wind 10/10 Extreme 99% chance of damaging wind over 30 yrs
- Air quality 1/10 Low 0 unhealthy d/yr today · 0 by 30 yrs out
Nearby sold comps map
Loading sold comps map…
Walkable amenities ~0.75 mi
Loading nearby amenities…
Taxation est. · year 1
- Rental income
- $20,373
- − Mortgage interest
- −$5,882
- − Property taxes
- −$1,860
- − Insurance
- −$1,322
- − Repairs & maintenance
- −$1,630
- − Management
- −$1,630
- − HOA
- −$7,524
- − Depreciation
- −$3,055
- Taxable loss
- −$2,529
- Est. tax savings @ 24.0%
- +$607
- After-tax cash flow
- $-612/yr
For passive investors: Depreciation is non-cash, so a rental often shows a tax loss while cash-flowing — sheltering income. Rental losses are passive: they offset passive income freely, and up to $25,000/yr can offset ordinary (W-2) income if you actively participate and your MAGI is under $100k (phasing out to $0 by $150k); unused losses carry forward. On sale, claimed depreciation is recaptured at up to 25%, and gains may owe capital-gains tax (a 1031 exchange can defer both). Figures are a year-1 estimate at your 24.0% rate — not tax advice; consult a CPA.
Schools (NCES district)
- District
- Indian River
- NCES district ID
- 1200930
- Math proficiency
- 48% ▼ -9.00%
- Reading proficiency
- 52% ▼ -3.00%
- Median HH income
- $46,597
- Composite
- 42.45/100
- National rank
- #3218
- State rank
- #35 of 73 in FL
Livability — Florida Ridge
- Score
- 72/100
- State rank
- #353
- US rank
- #6129
Category grades
Schools grade is shown separately in the Schools card above.
Census & demographics
- Census place
- Florida Ridge, FL
- County
- Indian River County · 143,738 people
- City population
- 25,629
- Metro
- Sebastian-Vero Beach, FL
- Population (ZIP)
- 25,522
- Household income
- $66,664
- Rent vs Own
- Severe rent burden
- 425.0
Population outlook (Indian River County) Hauer SSP2
- Today (2025)
- 165,104 people
- By 2030
- 172,869 · +4.7%
- By 2040
- 185,640 · +12.4%
- By 2050
- 194,465 · +17.8%
- By 2075
- 211,115 · +27.9%
- By 2100
- 211,781 · +28.3%
Race, ethnicity, and origin ACS 2023
- Neighborhood character
- Predominantly White (70%)
- Race & ethnicity
- White 70% Black 13% Hispanic / Latino 12% Two or more races 5% Native American 1%
- Hispanic origin (detail)
- Mexican 1% Puerto Rican 2% Cuban 1%
- Common ancestry
- Romanian 4% Lithuanian 4% Italian 3%
- Foreign-born
- 12% · Canada, Jamaica, Dominican Republic
- Languages at home
- 85% English-only · Spanish 9% Other Indo-European 2% French/Haitian/Cajun 1%
Political lean MEDSL · Indian River
- 2024 margin
- Strong R (+27.4) · D 36.0% · R 63.4%
- 2008→2024 swing
- -12.5pp toward R · 2008: -14.8pp · 2024: -27.4pp
- All cycles
- 2024: R+27.4 2020: R+21.6 2016: R+24.5 2012: R+22.3 2008: R+14.8
Not yet ingested
- Civics
- —
Market trends
- HPI YoY
- ▼ -182.13%
- Current HPI
- 333.3274
- Rent YoY
- ▲ 4.18%
- Metro
- Sebastian-Vero Beach, FL
- State GDP YoY
- ▲ 3.28%
- F500 in state
- 36
Industry mix (Fortune 500 HQ in FL)
| Industry | F500 HQs | Revenue |
|---|---|---|
| Industrial Technology | 2 | $29B |
|
||
| Insurance | 2 | $17B |
|
||
| Retail | 1 | $60B |
|
||
| Technology Distribution | 1 | $58B |
|
||
| Homebuilding | 1 | $35B |
|
||
| Technology Manufacturing | 1 | $35B |
|
||
Price history
+66.7% since first listed7 events — show timeline
- 2026-05-18 Contingent — RAIRCMLS
- 2026-04-22 Price Changed $105,000 RAIRCMLS
- 2026-02-04 Listed $115,000 RAIRCMLS
- 2023-12-08 Rental Removed $1,700 RAIRCMLS
- 2023-11-10 Listed for Rent $1,700 RAIRCMLS
- 2002-05-31 Sold (Public Records) $63,000 Public Records
- 1983-11-01 Sold (Public Records) $63,000 Public Records
Property tax history
+8.6%/yrLatest (2025): $1,860 · +5.6% YoY. Source: county tax records.
Cash-flow waterfall
monthlySold comps — $/sqft
last 12 mo · ≤1 miLoading sold comps…