1400 S Ocean Dr #304 · Hollywood, FL
Flood risk 8/10 · Major
- FEMA flood zone
- AE
- Chance of flooding over 30 yrs
- 0.97%
- Est. flood insurance / yr
- $1,737 – $8,500
Fire risk 1/10 · Minimal
- Est. fire insurance / yr
- $947 – $1,759
Heat risk 10/10 · Severe
- Hot days now (above 104°F)
- 7 days/yr
- Hot days in 30 yrs
- 26 days/yr
Wind risk 10/10 · Severe
- Chance of severe wind over 30 yrs
- 99.0%
Air-quality risk 2/10 · Minimal
- Unhealthy air days now
- 1 days/yr
- Unhealthy air days in 30 yrs
- 2 days/yr
Risk factors via First Street. Map © Google.
Why this score? — see what drove the C- grade
The composite is a weighted blend of 9 inputs, each scored 0–100. Each bar is that input's sub-score; the figure is the points it added to the 100-point composite (weight × sub-score).
- Cash flow +17.6/30.0
- ARV discount +7.5/15.0
- 1% rule +7.0/10.0
- DSCR +5.5/10.0
- Schools +4.1/10.0
- Livability +3.8/5.0
- Rent growth +3.2/5.0
- Condition / age +2.5/5.0
- Appreciation +0.0/10.0
$375,000
🖨 Deal sheet (PDF) 📄 Offer letter ✓ Due diligence
Listing remarks
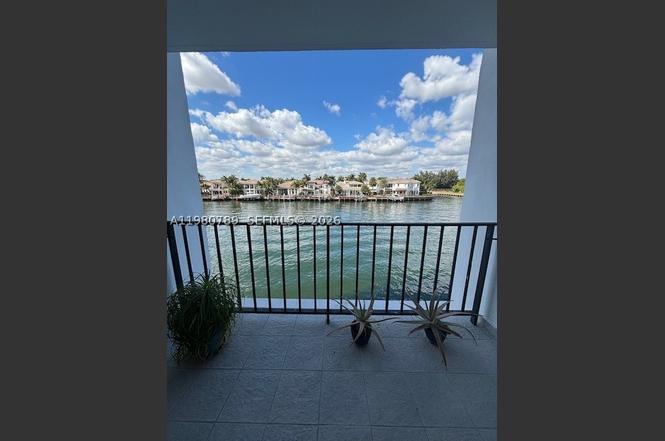
Spacious 2-bedroom, 2-bathroom apartment located in Hollywood Beach, offering fantastic views of the Intracoastal. This boutique building features only 8 units per floor, providing a more private and exclusive living experience. The unit includes accordion shutters for added storm protection. Amenities include a swimming pool, gym, and sauna. Ideally located just steps from the beach, and close to everything Hollywood Beach has to offer, including restaurants, shops, and the famous Hollywood Broad-walk.
Key facts
- Accordion shutters
- Sauna
- Swimming pool
Tags
Property features AI
Finance
- Other: Waterfront with Intracoastal access
- Financial info: Pets are not allowed
- HOA & community: Monthly association fee of $944; HOA covers common areas, insurance, structural maintenance, trash, and water; Community amenities include a pool and elevators
Exterior
- Parking: 1 covered garage space; 1 open parking space
- Security: Closed-circuit cameras; Key card entry; Phone entry
- Utilities: Association pool
- Home design: Condo/Apartment (attached property); Entry on level 3; 17-story building
- Construction: Block construction; Resale property
- Exterior features: Balcony; Open balcony/patio
Interior
- Kitchen: Electric range; Dishwasher; Garbage disposal; Refrigerator
- Bedrooms: Bedroom located on the main level
- Flooring: Tile
- Bathrooms: 2 full bathrooms
- Heating & cooling: Central heating; Central air conditioning
- Interior features: Walk-in closet(s); Bedroom on main level; Other interior features
- Laundry & utility: Washer; Dryer
Neighborhood map
What this means for you Summary
Snapshot
- This is a 2-bed/2.0-bath condo listed at $375k.
Deal economics
- At list price, monthly cash flow is $-129 ($-2k/yr) — negative.
- To cash-flow at today's rent, offer at most $352k (6.1% below list).
- Meets the 1% rule at list price ($5k rent vs $375k).
- Recommended offer: $341k (9.0% below list) — sets the bar for market timing.
- Cap rate 7.2% vs local median 3.2% in Hollywood — top-decile yield for the area; either an underpriced asset or a hidden risk that comps aren't pricing in. Stress-test before assuming the spread holds.
Location & tenants
- Location reads 76/100 on livability (#232 in FL, #3,548 nationally) — a middle-class / working-renter tenant base. Strengths: commute A+, housing A+, crime B+; Watch: amenities D.
- Broward (suburban): math 42% / reading 53% proficiency, ranked #46 of 73 in FL (top 63%) — families likely to look elsewhere, expect single-tenant / working-renter base with shorter leases.
- Zoned schools: Nova Blanche Forman Elementary (math 35% / reading 55%, grade D-, #1,271 of 2,144 statewide, top 60%, 769 students, 72% FRL); Nova Middle School (math 44% / reading 53%, grade C-, #274 of 571 statewide, top 50%, 1,284 students, 68% FRL); South Broward High School (math 24% / reading 49%, grade F, #351 of 667 statewide, top 54%, 2,397 students, 59% FRL).
- Market conditions: Rents rising (+2.9%/yr); 839 active listings in the ZIP; 40 comparable units currently listed for rent nearby; rentals at typical pace (median 22d on market — plan ~3-4 weeks tenant-placement turnaround); solid renter incomes; 2,111 units permitted in Broward County in 2024 (1,265 in 5+ unit buildings).
- At $4,516/mo this rent would consume 56% of the median local household income ($96k/yr) (locally 563% of renters already pay >50% of income on rent) — very limited rent-growth headroom before tenants either downsize or default.
Forward outlook
- Local home prices are declining (-3.0%/yr); year-one equity from $3k of loan paydown is wiped out by about $11k of value loss. Plan a longer hold.
- Broward County population projected at +34% by 2050 — long-run rental-demand tailwind backs the buy-and-hold thesis.
Negotiation context
- It's been on market 102 days — a 9% lower offer ($341k) is reasonable based on typical stale-listing flexibility.
- 2 sale attempts since 7y ago; this cycle's ask has dropped $24k (6%) from the opening price — seller is motivated, your offer sets the floor, not the list.
- Current owner paid $240k; list at $375k implies a 56% gain — meaningful room to come down on a strong offer.
Risks & watch-outs
- Watch-outs: flood insurance adds $427/mo; HOA is 21% of rent.
- Climate carrying-cost: in FEMA flood zone AE (mandatory federal flood insurance); severe wind risk, 99% chance of damaging wind over 30y; extreme-heat days projected 7→26/yr by 2055 (HVAC capex compounding) — expect insurance premiums to compound above CPI over the hold.
Questions for the listing agent
- What do current leases actually rent for vs. the listed asking? Can we see a recent rent roll and the last 12 months of T-12 income?
- It's been on market 102 days. Have you received any prior offers? Is the seller open to a 9% concession, seller financing, or rate buy-down credit?
- Built in 1969 — when were the roof, HVAC, electrical panel, plumbing, and water heater last replaced?
- What's the actual annual flood-insurance premium (NFIP or private), and is the property in a SFHA with mandatory coverage?
- What does the HOA fee cover, when was the last increase, and are there any pending special assessments or reserve-fund shortfalls?
- Any open or pending special assessments — roof, HVAC, plumbing, elevator, façade? What's the per-unit balance and payoff schedule, and is the seller paying it off at close or rolling it to the buyer?
- Why hasn't it sold? Are there any deal-killer items the seller is aware of (foundation, flood, title, zoning, code violations)?
- Is there a deadline driving the sale (1031 exchange, divorce, estate, relocation)? That informs how much negotiation room exists.
- What's the average days-on-market for RENTAL listings here right now (not sales)? A rising rental-DOM trend means longer vacancies and softer asking-rent achievability than the comps imply.
- What's the recent tenant-quality profile in this submarket — average credit score on applications, eviction rate, late-payment / NSF rate, and stable-employment percentage? A property-management company in the area should have these aggregated.
- How much new apartment / multifamily construction is in the pipeline within 1–3 miles? Heavy new supply (>2% of stock underway) typically softens rents 12–24 months out; light construction supports rent growth.
Investment metrics
- 1% rule
- 1.20% ✓
- Cap rate
- 7.24%
- Cash-on-cash
- 3.40%
- DSCR
- 1.15
- GRM
- 6.9
CMA / ARV
No comps found within radius.
Projected returns pro-forma
-3.0% appreciation · 2.92% rent growth · sell at horizon
- IRR
- -18.6%
- Equity multiple
- 0.35×
- Total profit
- $-68,608
- Equity at exit
- $55,914
- IRR
- -10.8%
- Equity multiple
- 0.34×
- Total profit
- $-68,787
- Equity at exit
- $32,423
Cash invested: $105,000 (down + closing). Projections, not guarantees.
Landlord ↔ Tenant lean methodology
- Overall (STATE)
- 87 Strongly Landlord-Friendly
- State Florida
- 87 Strongly Landlord-Friendly · R+3
- County
- — inherits STATE
- City
- — inherits STATE
ZIP-level market 33019
- Rents YoY
- 2.9%
- Active inventory
- 839
- Price-to-rent
- 6.9×
Monthly cashflow live
- Estimated rent
- $4,516 high interval (Pro) →
- Mortgage (P&I)
- −$1,967
- Tax from tax record
- −$204 /mo · $2,443/yr
- Insurance
- −$156
- Flood insurance flood zone
- −$427 /mo · $5,118/yr
- HOA
- −$944
- Vacancy / Maint / Mgmt
- −$948
- Net cashflow
- $-129
Break-even live
Sensitivity live
| Price | -10% $83 | -5% $-23 | +0% $-129 | +5% $-235 | +10% $-341 |
|---|---|---|---|---|---|
| Rent | -10% $-486 | -5% $-308 | +0% $-129 | +5% $49 | +10% $228 |
| Rate | -1.0pp $60 | -0.5pp $-34 | base $-129 | +0.5pp $-226 | +1.0pp $-325 |
UW: 25.0% down · 7.5% · 30yr · 1.5% tax · 5.0% vac · 8.0% maint · 8.0% mgmt
Financing live
Cash to close
- Down payment
- $93,750
- Closing costs
- $11,250
- Reserves months
- —
- Total cash needed
- —
Loan-product check · same deal, 3 products live
Conventional
25% down · 7.5% · 30yr
- Down + closing
- —
- Monthly P&I
- —
- Monthly cashflow
- —
- DSCR
- —
- Eligible?
- —
Personal DTI + credit; lowest rate.
DSCR
20% down · 8.5% · 30yr
- Down + closing
- —
- Monthly P&I
- —
- Monthly cashflow
- —
- DSCR
- —
- Eligible?
- —
No personal income docs; deal must DSCR.
Hard money
10% down · 12.0% · 12mo
- Down + closing
- —
- Monthly P&I
- —
- Monthly cashflow
- —
- DSCR
- —
- Eligible?
- —
Short-term bridge; refi at stabilization.
Rent comps 40 comps
| Address | Beds | Baths | Sqft | Rent | $/sqft | DOM | Units | Dist |
|---|---|---|---|---|---|---|---|---|
| 1201 S Ocean Dr Unit 1903S Hollywood, FL | 2.0 | 2.0 | 1570 | $5,000 | $3.18 | 26d | 1 | 0.15mi |
| 2101 S Ocean Dr #1201 Hollywood, FL | 2.0 | 2.0 | 1270 | $4,200 | $3.31 | 26d | 1 | 0.25mi |
| 2101 S Ocean Dr #1201 Hollywood, FL | 2.0 | 2.0 | 1270 | $4,150 | $3.27 | 1d | 1 | 0.25mi |
| 2201 S Ocean Dr #1507 Hollywood, FL | 2.0 | 2.0 | 1350 | $5,000 | $3.70 | 26d | 1 | 0.25mi |
| 2201 S Ocean Dr #2001 Hollywood, FL | 2.0 | 2.0 | 1400 | $3,800 | $2.71 | 16d | 1 | 0.25mi |
| 809 S Ocean Dr Unit 1227349P Hollywood, FL | 2.0 | 1.0 | 990 | $3,768 | $3.81 | 16d | 1 | 0.30mi |
| 330 Madison St Hollywood, FL | 2.0 | 2.0 | 1200 | $3,500 | $2.92 | 26d | 1 | 0.32mi |
| 2401 S Ocean Dr #1405 Hollywood, FL | 2.0 | 2.0 | 1250 | $4,250 | $3.40 | 26d | 1 | 0.32mi |
| 2301 S Ocean Dr #2003 Hollywood, FL | 2.0 | 2.0 | 1400 | $5,500 | $3.93 | 26d | 1 | 0.34mi |
| 2301 S Ocean Dr #607 Hollywood, FL | 2.0 | 2.0 | 1240 | $4,000 | $3.23 | 26d | 1 | 0.34mi |
| 2301 S Ocean Dr #2507 Hollywood, FL | 2.0 | 2.0 | 1240 | $4,300 | $3.47 | 26d | 1 | 0.34mi |
| 322 Oregon St Unit 1077064P Hollywood, FL | 1.0–3.0 | 1.0–2.0 | 780 | $4,996 | $6.41 | 0d | 2 | 0.40mi |
| 2501 S Ocean Dr Hollywood, FL | 1.0–2.0 | 1.0–2.0 | 971 | $5,800 | $5.97 | 16d | 7 | 0.40mi |
| 2501 S Ocean Dr Hollywood, FL | 1.0–2.0 | 1.0–2.0 | 971 | $5,400 | $5.56 | 9d | 7 | 0.40mi |
| 2501 S Ocean Dr Hollywood, FL | 1.0–2.0 | 1.0–2.0 | 971 | $5,800 | $5.97 | 21d | 8 | 0.40mi |
| 2501 S Ocean Dr Hollywood, FL | 1.0–2.0 | 1.0–2.0 | 971 | $5,800 | $5.97 | 12d | 6 | 0.40mi |
| 300 Oregon St #601 Hollywood, FL | 2.0 | 2.0 | 1050 | $4,000 | $3.81 | 26d | 1 | 0.40mi |
| 349 Virginia St #349 Hollywood, FL | 3.0 | 2.5 | 1815 | $3,950 | $2.18 | 26d | 1 | 0.49mi |
| 2751 S Ocean Dr Unit 1706S Hollywood, FL | 2.0 | 2.0 | 1360 | $5,000 | $3.68 | 26d | 1 | 0.51mi |
| 2751 S Ocean Dr Unit 508S Hollywood, FL | 3.0 | 2.5 | 1868 | $5,300 | $2.84 | 9d | 1 | 0.51mi |
| 2751 S Ocean Dr Unit 508S Hollywood, FL | 3.0 | 2.5 | 1868 | $5,300 | $2.84 | 19d | 1 | 0.51mi |
| 2751 S Ocean Dr Unit 1705 Hollywood, FL | 2.0 | 2.0 | 1360 | $5,000 | $3.68 | 9d | 1 | 0.51mi |
| 3001 S Ocean Dr #1211 Hollywood, FL | 2.0 | 2.0 | 1208 | $4,750 | $3.93 | 26d | 1 | 0.57mi |
| 3001 S Ocean Dr #1211 Hollywood, FL | 2.0 | 2.0 | 1208 | $4,750 | $3.93 | 9d | 1 | 0.57mi |
| 1041 Washington St Hollywood, FL | 3.0 | 2.0 | 1699 | $4,000 | $2.35 | 26d | 1 | 0.57mi |
| 825 NE 26th Ave Hallandale Beach, FL | 3.0 | 2.0 | 1844 | $4,200 | $2.28 | 26d | 1 | 0.62mi |
| 3101 S Ocean Dr #1504 Hollywood, FL | 2.0 | 2.5 | 1733 | $7,500 | $4.33 | 26d | 1 | 0.63mi |
| 3101 S Ocean Dr #1904 Hollywood, FL | 2.0 | 2.5 | 1733 | $5,500 | $3.17 | 24d | 1 | 0.63mi |
| 101 N Ocean Dr Unit 1227219P Hollywood, FL | 2.0 | 2.0 | 990 | $4,444 | $4.49 | 9d | 1 | 0.66mi |
| 3505 S Ocean Dr Hollywood, FL | 1.0–2.0 | 1.5–2.0 | 1085 | $6,500 | $5.99 | 14d | 17 | 0.67mi |
| 3505 S Ocean Dr Hollywood, FL | 1.0–2.0 | 1.5–2.0 | 1085 | $6,500 | $5.99 | 12d | 18 | 0.67mi |
| 1529 Shoreline Way #1529 Hollywood, FL | 3.0 | 2.5 | 1784 | $7,750 | $4.34 | 14d | 1 | 0.73mi |
| 1529 Shoreline Way #1529 Hollywood, FL | 3.0 | 2.0 | 1784 | $7,500 | $4.20 | 3d | 1 | 0.73mi |
| 1529 Shoreline Way Hollywood, FL | 3.0 | 2.5 | 1784 | $7,500 | $4.20 | 9d | 1 | 0.73mi |
| 1001 Three Islands Blvd #331 Hallandale Beach, FL | 3.0 | 2.5 | 1750 | $3,780 | $2.16 | 1d | 1 | 0.74mi |
| 1016 Harrison St Hollywood, FL | 3.0 | 2.0 | 1667 | $5,500 | $3.30 | 26d | 1 | 0.74mi |
| 523 Leslie Dr Hallandale Beach, FL | 3.0 | 2.0 | 1624 | $4,950 | $3.05 | 26d | 1 | 0.79mi |
| 2753 S Parkview Dr Hallandale Beach, FL | 2.0 | 2.0 | 1680 | $3,699 | $2.20 | 19d | 1 | 0.81mi |
| 2500 Parkview Dr #2518 Hallandale Beach, FL | 2.0 | 2.0 | 1280 | $4,000 | $3.12 | 16d | 1 | 0.81mi |
| 2500 Parkview Dr #1112 Hallandale Beach, FL | 2.0 | 2.0 | 1580 | $3,800 | $2.41 | 26d | 1 | 0.81mi |
HOA detail condo
- Monthly dues
- $944 · $11,328/yr
- Likely covers
- poolgym
- Assessments
- None detected in remarks — confirm with the listing agent.
Listing history 20 events
-
2026-06-21days on market $375,000 Active 102 DOM
-
2026-06-18days on market $375,000 Active 99 DOM
-
2026-06-17days on market $375,000 Active 98 DOM
-
2026-06-16days on market $375,000 Active 97 DOM
-
2026-06-15days on market $375,000 Active 96 DOM
-
2026-06-13days on market $375,000 Active 94 DOM
-
2026-06-09days on market $375,000 Active 90 DOM
-
2026-06-08days on market $375,000 Active 89 DOM
-
2026-06-07days on market $375,000 Active 88 DOM
-
2026-06-04days on market $375,000 Active 85 DOM
-
2026-06-03days on market $375,000 Active 84 DOM
-
2026-06-02days on market $375,000 Active 83 DOM
-
2026-06-01days on market $375,000 Active 82 DOM
-
2026-05-31days on market $375,000 Active 81 DOM
-
2026-04-27price $375,000
-
2026-03-05$399,000 Active
-
2020-04-21historical
-
2019-10-21$359,000 Active
-
2004-06-30soldstatus $240,000
-
1971-06-01soldstatus $33,500
ⓘ Source: listings_history table (triggers on properties + properties_extension) + one-shot
backfill from property_details.listing_events for pre-trigger history.
Tax reassessment forecast FL · Resets to sale price
- Current annual tax
- $2,443 · $204/mo
- Projected year-2 tax
- $3,112 · $259/mo
- Expected delta
- +$669/yr (+$56/mo · 27.4%)
ⓘ Screening estimate from a state-policy table — verify with the county assessor before closing.
Climate risk First Street
- Flood 8/10 Severe FEMA zone AE · 97% chance over 30 yrs
- Wildfire 1/10 Low
- Heat 10/10 Extreme 7 d/yr ≥104°F today · 26 d/yr by 30 yrs out
- Wind 10/10 Extreme 99% chance of damaging wind over 30 yrs
- Air quality 2/10 Low 1 unhealthy d/yr today · 2 by 30 yrs out
Nearby sold comps map
Loading sold comps map…
Walkable amenities ~0.75 mi
Loading nearby amenities…
Taxation est. · year 1
- Rental income
- $54,194
- − Mortgage interest
- −$21,006
- − Property taxes
- −$2,443
- − Insurance
- −$6,994
- − Repairs & maintenance
- −$4,336
- − Management
- −$4,336
- − HOA
- −$11,328
- − Depreciation
- −$10,909
- Taxable loss
- −$7,157
- Est. tax savings @ 24.0%
- +$1,718
- After-tax cash flow
- $168/yr
For passive investors: Depreciation is non-cash, so a rental often shows a tax loss while cash-flowing — sheltering income. Rental losses are passive: they offset passive income freely, and up to $25,000/yr can offset ordinary (W-2) income if you actively participate and your MAGI is under $100k (phasing out to $0 by $150k); unused losses carry forward. On sale, claimed depreciation is recaptured at up to 25%, and gains may owe capital-gains tax (a 1031 exchange can defer both). Figures are a year-1 estimate at your 24.0% rate — not tax advice; consult a CPA.
Schools (NCES district)
- District
- Broward
- NCES district ID
- 1200180
- Math proficiency
- 42% ▼ -18.00%
- Reading proficiency
- 53% ▼ -5.00%
- Median HH income
- $52,139
- Composite
- 40.88/100
- National rank
- #3621
- State rank
- #46 of 73 in FL
Livability — Hollywood
- Score
- 76/100
- State rank
- #232
- US rank
- #3548
Category grades
Schools grade is shown separately in the Schools card above.
Census & demographics
- Census place
- Hollywood, FL
- County
- Broward County · 1,963,430 people
- City population
- 109,079
- Metro
- Miami-Fort Lauderdale-Pompano Beach, FL
- Population (ZIP)
- 14,293
- Household income
- $96,497
- Rent vs Own
- Severe rent burden
- 563.0
Population outlook (Broward County) Hauer SSP2
- Today (2025)
- 2,207,033 people
- By 2030
- 2,360,704 · +7.0%
- By 2040
- 2,661,208 · +20.6%
- By 2050
- 2,946,698 · +33.5%
- By 2075
- 3,602,273 · +63.2%
- By 2100
- 3,970,984 · +79.9%
Race, ethnicity, and origin ACS 2023
- Neighborhood character
- Majority White (61%)
- Race & ethnicity
- White 61% Hispanic / Latino 32% Two or more races 25% Black 2%
- Hispanic origin (detail)
- Puerto Rican 2% Cuban 6% Salvadoran 2%
- Common ancestry
- Scotch-Irish 7% Romanian 4% Lithuanian 4%
- Foreign-born
- 43% · Canada, Jamaica, Dominican Republic
- Languages at home
- 53% English-only · Spanish 30% Russian/Polish/Slavic 6% Other Indo-European 4%
Political lean MEDSL · Broward
- 2024 margin
- D (+17.0) · D 58.0% · R 41.0%
- 2008→2024 swing
- -17.8pp toward R · 2008: 34.7pp · 2024: 17.0pp
- All cycles
- 2024: D+17.0 2020: D+29.8 2016: D+35.0 2012: D+34.9 2008: D+34.7
Not yet ingested
- Civics
- —
Market trends
- HPI YoY
- ▼ -434.82%
- Current HPI
- 307.2922
- Rent YoY
- ▲ 2.92%
- Metro
- Miami-Fort Lauderdale-Pompano Beach, FL
- State GDP YoY
- ▲ 3.28%
- F500 in state
- 36
Industry mix (Fortune 500 HQ in FL)
| Industry | F500 HQs | Revenue |
|---|---|---|
| Industrial Technology | 2 | $29B |
|
||
| Insurance | 2 | $17B |
|
||
| Retail | 1 | $60B |
|
||
| Technology Distribution | 1 | $58B |
|
||
| Homebuilding | 1 | $35B |
|
||
| Technology Manufacturing | 1 | $35B |
|
||
Price history
+1019.4% since first listed6 events — show timeline
- 2026-04-27 Price Changed $375,000 MARMLS
- 2026-03-05 Listed $399,000 MARMLS
- 2020-04-21 Listing Removed — Beaches MLS
- 2019-10-21 Listed $359,000 Beaches MLS
- 2004-06-30 Sold (Public Records) $240,000 Public Records
- 1971-06-01 Sold (Public Records) $33,500 Public Records
Property tax history
+0.7%/yrLatest (2025): $2,443 · -13.7% YoY. Source: county tax records.
Cash-flow waterfall
monthlySold comps — $/sqft
last 12 mo · ≤1 miLoading sold comps…