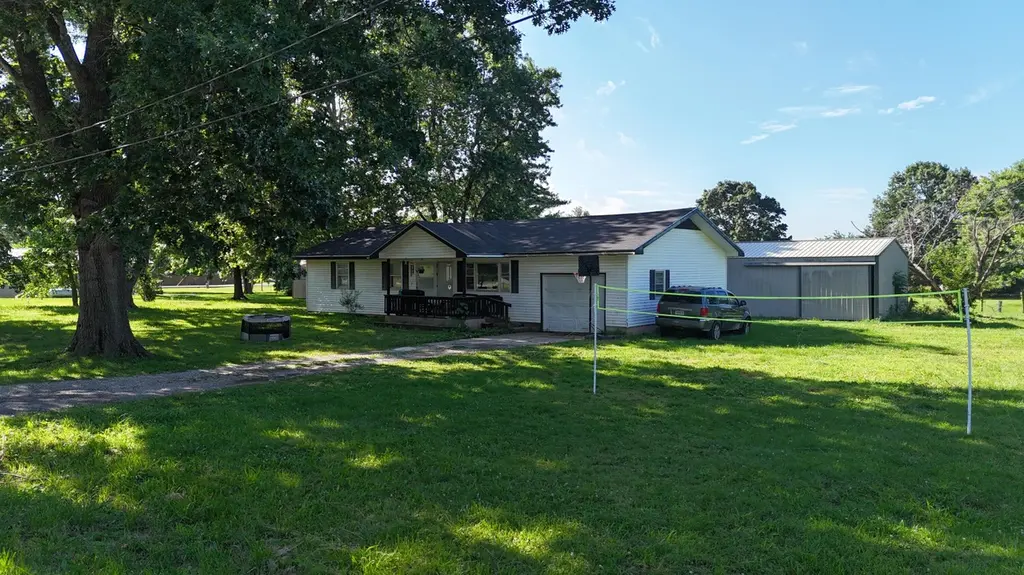
506 E Van Every St · Seymour, MO
Flood risk 1/10 · Minimal
- FEMA flood zone
- X (unshaded)
- Chance of flooding over 30 yrs
- 0.0%
- Est. flood insurance / yr
- $507 – $1,088
Fire risk 4/10 · Minor
- Est. fire insurance / yr
- $1,054 – $1,958
Heat risk 4/10 · Minor
- Hot days now (above 105°F)
- 7 days/yr
- Hot days in 30 yrs
- 19 days/yr
Wind risk 2/10 · Minimal
- Chance of severe wind over 30 yrs
- 0.0%
Air-quality risk 2/10 · Minimal
- Unhealthy air days now
- 0 days/yr
- Unhealthy air days in 30 yrs
- 1 days/yr
Risk factors via First Street. Map © Google.
Why this score? — see what drove the D- grade
The composite is a weighted blend of 9 inputs, each scored 0–100. Each bar is that input's sub-score; the figure is the points it added to the 100-point composite (weight × sub-score).
- Appreciation +9.8/10.0
- Cash flow +7.7/30.0
- ARV discount +7.5/15.0
- Livability +3.1/5.0
- Schools +3.0/10.0
- Rent growth +2.5/5.0
- Condition / age +2.5/5.0
- DSCR +1.8/10.0
- 1% rule +1.2/10.0
$159,995
🖨 Deal sheet 📄 Offer letter ✓ Due diligence
Listing remarks MLS
Reduced!!! Seller wants this house sold, bring offers!! Cute 4 bedroom house at the edge of town with an open field behind the house. Lot has mature trees and an outbuilding. Inside has hardwood floors, eat in kitchen, and four bedrooms. Home is currently a rental and could easily remain as such, or would make a great family home.
Key facts
- Updated cabinets
- Private back yard
- Shop for storage
Tags
Property features AI
Exterior
- Parking: 2-car garage (garage faces front)
- Utilities: Public water; Public sewer; Propane service
- Home design: Single family residence; One level
- Construction: Vinyl siding; Asphalt roof
- Exterior features: Front porch; Asphalt and gravel road access; Public maintained road; City street frontage; Lot approximately 0.41 acre (120 x 143)
Interior
- Kitchen: Gas oven; Free-standing gas oven; Refrigerator
- Flooring: Hardwood; Vinyl
- Bathrooms: 1 full bathroom
- Heating & cooling: Propane forced air heating; Central air conditioning
- Interior features: Walk-in closet(s)
- Laundry & utility: Laundry on main level
Neighborhood map
What this means for you Summary
Snapshot
- This is a 4-bed/1.0-bath other listed at $160k.
Deal economics
- At list price, monthly cash flow is $-182 ($-2k/yr) — negative.
- To cash-flow at today's rent, offer at most $128k (20.1% below list).
- To meet the 1% rule (rent ≥ 1% of price), the offer needs to be $99k (38.4% below list).
- Recommended offer: $99k (38.4% below list) — sets the bar for 1% rule.
- Cap rate 4.9% vs local median 2.0% in Seymour — top-decile yield for the area; either an underpriced asset or a hidden risk that comps aren't pricing in. Stress-test before assuming the spread holds.
Location & tenants
- Location reads 62/100 on livability (#374 in MO) — a middle-class / working-renter tenant base. Strengths: crime A+, cost of living A+, housing A+; Watch: amenities F, commute F, employment F.
- Seymour R-II (rural): math 28% / reading 43% proficiency, ranked #218 of 324 in MO (top 67%) — families likely to look elsewhere, expect single-tenant / working-renter base with shorter leases.
- Zoned schools: Seymour Elem. (math 22% / reading 47%, grade F, #676 of 1,115 statewide, top 66%, 309 students, 40% FRL); Seymour Middle (math 22% / reading 42%, grade F, #272 of 391 statewide, top 70%, 166 students, 35% FRL); Seymour High (math 57% / reading 34%, grade D-, #174 of 521 statewide, top 33%, 240 students, 38% FRL) — zoned schools average 37% FRL vs 58% district-wide (20 pts lower); this property's tenant base skews higher-income than the district average.
- Market conditions: 58 active listings in the ZIP; 168 units permitted in Webster County in 2024 (24 in 5+ unit buildings).
Forward outlook
- In year one you build about $16k of equity ($1k loan paydown + $15k appreciation (9.5% local appreciation)).
- Webster County population projected at +5% by 2050 — modest demand growth; plan on rents tracking national, not racing it.
- By year 3, paydown + projected appreciation supports a ~$41k cash-out refi (75% LTV) — recoverable capital for the next deal without selling this one.
Negotiation context
- Only 6 days on market — expect competitive offers; lowballing is unlikely to land.
- 2 sale attempts since 11y ago with the ask held roughly flat each time — persistent listings suggest the price (not the market) is what's stuck; bring a comps-based counter.
Questions for the listing agent
- What do current leases actually rent for vs. the listed asking? Can we see a recent rent roll and the last 12 months of T-12 income?
- Built in 1972 — when were the roof, HVAC, electrical panel, plumbing, and water heater last replaced?
- Is there a deadline driving the sale (1031 exchange, divorce, estate, relocation)? That informs how much negotiation room exists.
- Schools are D-rated, which usually means shorter tenancies and higher turnover. Who's the typical renter profile here, and what's been the actual vacancy rate?
- The area grade is low — what's the realistic commute time and amenity access for the typical tenant pool here? Any planned neighborhood developments (good or bad) we should know about?
- What's the average days-on-market for RENTAL listings here right now (not sales)? A rising rental-DOM trend means longer vacancies and softer asking-rent achievability than the comps imply.
- What's the recent tenant-quality profile in this submarket — average credit score on applications, eviction rate, late-payment / NSF rate, and stable-employment percentage? A property-management company in the area should have these aggregated.
- How much new for-sale + rental construction is in the pipeline within 1–3 miles? Heavy new supply typically softens prices + rents 12–24 months out; constrained supply supports both.
Investment metrics
- 1% rule
- 0.62% ✗
- Cap rate
- 4.93%
- Cash-on-cash
- -4.89%
- DSCR
- 0.78
- GRM
- 13.5
CMA / ARV
No comps found within radius.
Projected returns pro-forma
9.54% appreciation · 3.0% rent growth · sell at horizon
- IRR
- 19.8%
- Equity multiple
- 2.57×
- Total profit
- $70,392
- Equity at exit
- $138,758
- IRR
- 18.2%
- Equity multiple
- 5.80×
- Total profit
- $215,054
- Equity at exit
- $293,691
Cash invested: $44,799 (down + closing). Projections, not guarantees.
Landlord ↔ Tenant lean methodology
- Overall (STATE)
- 81 Strongly Landlord-Friendly
- State Missouri
- 81 Strongly Landlord-Friendly · R+10
- County
- — inherits STATE
- City
- — inherits STATE
ZIP-level market 65746
- Home prices YoY
- 3.6%
- Active inventory
- 58
- Price-to-rent
- 13.5×
Monthly cashflow live
- Estimated rent
- $986 medium interval (Pro) →
- Mortgage (P&I)
- −$839
- Tax from tax record
- −$55 /mo · $665/yr
- Insurance
- −$67
- HOA
- −$0
- Vacancy / Maint / Mgmt
- −$207
- Net cashflow
- $-182
Break-even live
UW: 25.0% down · 7.5% · 30yr · 1.5% tax · 5.0% vac · 8.0% maint · 8.0% mgmt
Financing live
Cash to close
- Down payment
- $39,999
- Closing costs
- $4,800
- Reserves months
- —
- Total cash needed
- —
Loan-product check · same deal, 3 products live
Conventional
25% down · 7.5% · 30yr
- Down + closing
- —
- Monthly P&I
- —
- Monthly cashflow
- —
- DSCR
- —
- Eligible?
- —
Personal DTI + credit; lowest rate.
DSCR
20% down · 8.5% · 30yr
- Down + closing
- —
- Monthly P&I
- —
- Monthly cashflow
- —
- DSCR
- —
- Eligible?
- —
No personal income docs; deal must DSCR.
Hard money
10% down · 12.0% · 12mo
- Down + closing
- —
- Monthly P&I
- —
- Monthly cashflow
- —
- DSCR
- —
- Eligible?
- —
Short-term bridge; refi at stabilization.
Listing history 6 events
-
2026-06-18days on market $159,995 Active 6 DOM
-
2026-06-17days on market $159,995 Active 5 DOM
-
2026-06-16days on market $159,995 Active 4 DOM
-
2026-06-15days on market $159,995 Active 3 DOM
-
2026-06-12remarks 404-char remark
-
2026-06-12$159,995 Active 1 DOM
ⓘ Source: listings_history table (triggers on properties + properties_extension) + one-shot
backfill from property_details.listing_events for pre-trigger history.
Tax reassessment forecast MO · Resets to sale price
- Current annual tax
- $665 · $55/mo
- Projected year-2 tax
- $1,552 · $129/mo
- Expected delta
- +$887/yr (+$74/mo · 133.4%)
ⓘ Screening estimate from a state-policy table — verify with the county assessor before closing.
Climate risk First Street
- Flood 1/10 Low FEMA zone X (unshaded) · 0% chance over 30 yrs
- Wildfire 4/10 Moderate
- Heat 4/10 Moderate 7 d/yr ≥105°F today · 19 d/yr by 30 yrs out
- Wind 2/10 Low 0% chance of damaging wind over 30 yrs
- Air quality 2/10 Low 0 unhealthy d/yr today · 1 by 30 yrs out
Nearby sold comps map
Loading sold comps map…
Walkable amenities ~0.75 mi
Loading nearby amenities…
Taxation est. · year 1
- Rental income
- $11,829
- − Mortgage interest
- −$8,962
- − Property taxes
- −$665
- − Insurance
- −$800
- − Repairs & maintenance
- −$946
- − Management
- −$946
- − Depreciation
- −$4,654
- Taxable loss
- −$5,145
- Est. tax savings @ 24.0%
- +$1,235
- After-tax cash flow
- $-954/yr
For passive investors: Depreciation is non-cash, so a rental often shows a tax loss while cash-flowing — sheltering income. Rental losses are passive: they offset passive income freely, and up to $25,000/yr can offset ordinary (W-2) income if you actively participate and your MAGI is under $100k (phasing out to $0 by $150k); unused losses carry forward. On sale, claimed depreciation is recaptured at up to 25%, and gains may owe capital-gains tax (a 1031 exchange can defer both). Figures are a year-1 estimate at your 24.0% rate — not tax advice; consult a CPA.
Schools (NCES district)
- District
- Seymour R-II
- NCES district ID
- 2927930
- Math proficiency
- 28% ▲ 3.00%
- Reading proficiency
- 43% ▼ -1.00%
- Median HH income
- $38,134
- Composite
- 29.57/100
- National rank
- #6485
- State rank
- #218 of 324 in MO
Livability — Seymour
- Score
- 62/100
- State rank
- #374
- US rank
- #16499
Category grades
Schools grade is shown separately in the Schools card above.
Census & demographics
- Census place
- Seymour, MO
- Population (ZIP)
- 8,302
Population outlook (Webster County) Hauer SSP2
- Today (2025)
- 39,400 people
- By 2030
- 40,125 · +1.8%
- By 2040
- 41,169 · +4.5%
- By 2050
- 41,286 · +4.8%
- By 2075
- 40,104 · +1.8%
- By 2100
- 33,683 · -14.5%
Race, ethnicity, and origin ACS 2023
- Neighborhood character
- Predominantly White (92%)
- Race & ethnicity
- White 92% Hispanic / Latino 3% Two or more races 2%
- Common ancestry
- Slovak 2% Portuguese 2% Iranian 2%
- Foreign-born
- 1% · Canada
- Languages at home
- 76% English-only · German/W. Germanic 23% Other Asian/Pacific 1% Spanish 1%
Political lean MEDSL · Webster
- 2024 margin
- Solid R (+62.2) · D 18.4% · R 80.7%
- 2008→2024 swing
- -33.2pp toward R · 2008: -29.0pp · 2024: -62.2pp
- All cycles
- 2024: R+62.2 2020: R+60.2 2016: R+57.9 2012: R+40.8 2008: R+29.0
Not yet ingested
- Civics
- —
Market trends
- HPI YoY
- ▲ 9.54%
- Current HPI
- 272.7643
- Rent YoY
- —
- Metro
- —
- State GDP YoY
- ▲ 1.84%
- F500 in state
- 20
Industry mix (Fortune 500 HQ in MO)
| Industry | F500 HQs | Revenue |
|---|---|---|
| Healthcare | 1 | $163B |
|
||
| Insurance | 1 | $21B |
|
||
| Industrial Technology | 1 | $17B |
|
||
| Retail | 1 | $16B |
|
||
| Industrial Distribution | 1 | $10B |
|
||
| Utilities | 1 | $9B |
|
||
Price history
+180.7% since first listed3 events — show timeline
- 2026-06-11 Listed $159,995 SOMO
- 2016-03-24 Sold (MLS) — SOMO
- 2015-06-28 Listed $57,000 SOMO
Property tax history
+5.2%/yrLatest (2025): $665 · +7.0% YoY. Source: county tax records.
Cash-flow waterfall
monthlySold comps — $/sqft
last 12 mo · ≤1 miLoading sold comps…