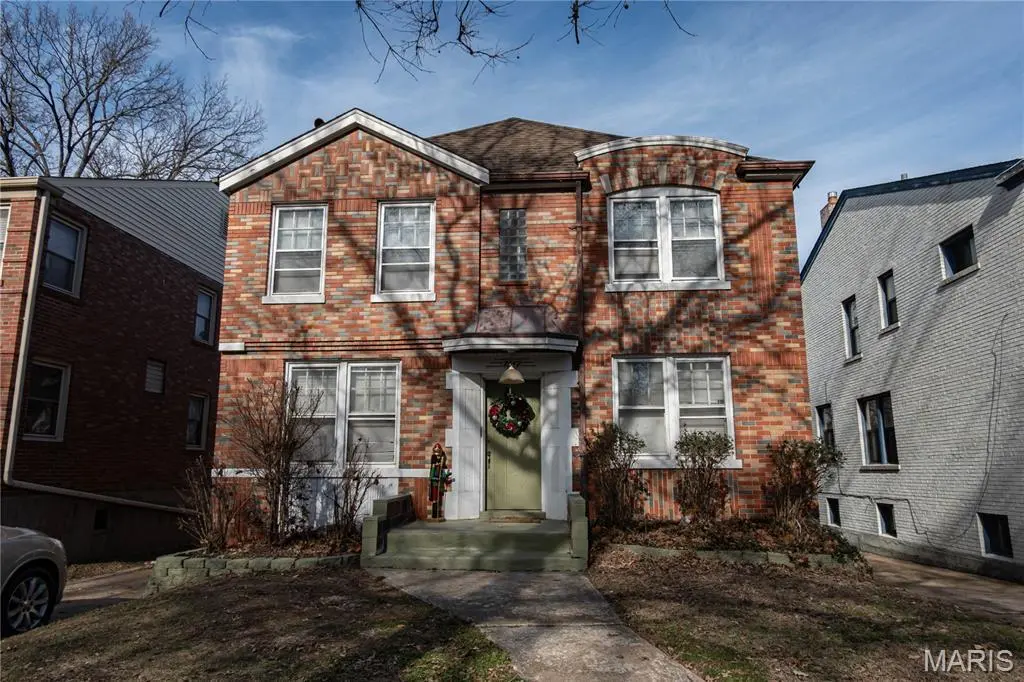
 Duplex
7347 Delmar Blvd · University City, MO
Flood risk 1/10 · Minimal
- FEMA flood zone
- X (unshaded)
- Chance of flooding over 30 yrs
- 0.0%
- Est. flood insurance / yr
- $473 – $860
Fire risk 1/10 · Minimal
- Est. fire insurance / yr
- $1,054 – $1,958
Heat risk 5/10 · Moderate
- Hot days now (above 107°F)
- 7 days/yr
- Hot days in 30 yrs
- 21 days/yr
Wind risk 2/10 · Minimal
- Chance of severe wind over 30 yrs
- 1.0%
Air-quality risk 4/10 · Minor
- Unhealthy air days now
- 4 days/yr
- Unhealthy air days in 30 yrs
- 5 days/yr
Risk factors via First Street. Map © Google.
Why this score? — see what drove the C+ grade
The composite is a weighted blend of 9 inputs, each scored 0–100. Each bar is that input's sub-score; the figure is the points it added to the 100-point composite (weight × sub-score).
- Cash flow +24.2/30.0
- ARV discount +11.2/15.0
- DSCR +7.8/10.0
- 1% rule +5.7/10.0
- Livability +3.7/5.0
- Rent growth +3.4/5.0
- Condition / age +2.5/5.0
- Schools +1.9/10.0
- Appreciation +0.0/10.0
$379,500
🖨 Deal sheet 📄 Offer letter ✓ Due diligence
Multi-family units
County records classify this as Multi-Family (5+ Unit). Listing-text estimate: 2 units. estimate disagrees with records
5+ unit building — per-unit beds/baths from public records are typically unavailable; the breakdown below (if shown) is an estimate from the listing text.
Listing remarks MLS
A wonderful spacious 2 family on Delmar Blvd close to Clayton near all the major arteries. Close to the Delmar loop, the development near Highway 170, grocery stores, and lots of the great items University City has to offer. Great for Owner Occupant or Investor. Beautiful hardwood floors, great architecture, central air conditioning, among many other items which make it a great investment.
Key facts
- Delmar loop
- Grocery stores
- 2 family
Tags
Neighborhood map
What this means for you Summary
Snapshot
- This is a 2 × 4-bed/2.0-bath units multifamily listed at $380k.
Deal economics
- At list price, monthly cash flow is $756 ($9k/yr) — positive. Per door: $378/mo.
- The deal already cash-flows at list — no discount required.
- Meets the 1% rule at list price ($4k rent vs $380k).
- Recommended offer: $334k (12.0% below list) — sets the bar for market timing.
- Cap rate 8.7% vs local median 4.9% in University City — top-decile yield for the area; either an underpriced asset or a hidden risk that comps aren't pricing in. Stress-test before assuming the spread holds.
Location & tenants
- Location reads 73/100 on livability (#84 in MO) — a middle-class / working-renter tenant base. Strengths: employment A+, housing A+, cost of living B; Watch: amenities D-, commute D-, health & safety F.
- University City (suburban): math 15% / reading 26% proficiency, ranked #297 of 324 in MO (top 92%) — low school quality limits family demand, transient renter base, plan for 1-2y turnover; 67% free/reduced lunch — lower-income household profile, screen leases tightly.
- Market conditions: Rents rising (+3.6%/yr); 162 active listings in the ZIP; 14 comparable units currently listed for rent nearby; rentals leasing fast (median 12d on market — plan ~1-2 weeks tenant-placement turnaround); solid renter incomes; 920 units permitted in St. Louis County in 2024 (250 in 5+ unit buildings).
- At $4,078/mo this rent would consume 57% of the median local household income ($86k/yr) (locally 893% of renters already pay >50% of income on rent) — very limited rent-growth headroom before tenants either downsize or default.
Forward outlook
- Local home prices are declining (-3.0%/yr); year-one equity from $3k of loan paydown is wiped out by about $11k of value loss. Plan a longer hold.
Negotiation context
- It's been on market 134 days — a 12% lower offer ($334k) is reasonable based on typical stale-listing flexibility.
- Current owner paid $215k; list at $380k implies a 77% gain — meaningful room to come down on a strong offer.
Risks & watch-outs
- Watch-outs: built in 1941 — expect roof / HVAC / electrical / plumbing capex.
- Climate carrying-cost: extreme-heat days projected 7→21/yr by 2055 (HVAC capex compounding) — expect insurance premiums to compound above CPI over the hold.
Questions for the listing agent
- It's been on market 134 days. Have you received any prior offers? Is the seller open to a 12% concession, seller financing, or rate buy-down credit?
- Can we see the unit-by-unit rent roll, current vacancy, and any below-market leases? What's the average tenancy length?
- What capital expenditures (roof, boiler, parking lot, exteriors) have been made in the last 5 years, and what's planned in the next 2?
- Built in 1941 — when were the roof, HVAC, electrical panel, plumbing, and water heater last replaced?
- Why hasn't it sold? Are there any deal-killer items the seller is aware of (foundation, flood, title, zoning, code violations)?
- Is there a deadline driving the sale (1031 exchange, divorce, estate, relocation)? That informs how much negotiation room exists.
- Schools are B-rated — typically a magnet for longer-tenancy family renters. What's the average tenant stay here, and is there a school-zone premium baked into asking?
- What's the average days-on-market for RENTAL listings here right now (not sales)? A rising rental-DOM trend means longer vacancies and softer asking-rent achievability than the comps imply.
- What's the recent tenant-quality profile in this submarket — average credit score on applications, eviction rate, late-payment / NSF rate, and stable-employment percentage? A property-management company in the area should have these aggregated.
- How much new apartment / multifamily construction is in the pipeline within 1–3 miles? Heavy new supply (>2% of stock underway) typically softens rents 12–24 months out; light construction supports rent growth.
Investment metrics
- 1% rule
- 1.07% ✓
- Cap rate
- 8.68%
- Cash-on-cash
- 8.54%
- DSCR
- 1.38
- GRM
- 7.8
CMA / ARV
- ARV (median comp)
- $413,042
- List price
- $379,500
- Delta
- -8.12%
- Verdict
- FAIR
- Comps
- 20 within 1.0 mi
Show comp detail 12 sales within ~0.75 mi
| Address | Dist | Beds/Ba | Sqft | Sold | Price | $/sf | Match |
|---|---|---|---|---|---|---|---|
| 7273 Dartmouth Ave | 0.36mi | 4/2.0 | 2,484 (+0%) | 12mo | $325,000 | $131 | 73 |
| 7126 Dartmouth Ave | 0.48mi | 4/2.0 | 2,484 (+0%) | 16mo | $320,000 | $129 | 64 |
| 7049 Amherst Unit A & B | 0.52mi | 4/2.0 | 2,538 (+2%) | 10mo | $389,000 | $153 | 63 |
| 7155 Tulane Ave | 0.42mi | 4/2.0 | 2,582 (+4%) | 12mo | $375,000 | $145 | 63 |
| 7037 Dartmouth Ave | 0.59mi | 4/2.0 | 2,340 (-6%) | 1mo | $325,000 | $139 | 62 |
| 7333 Lindell Blvd | 0.62mi | 4/2.0 | 2,500 (+1%) | 10mo | $495,000 | $198 | 61 |
| 7332 Dartmouth Ave | 0.32mi | 4/2.0 | 2,250 (-9%) | 14mo | $325,000 | $144 | 58 |
| 7044 Amherst Ave | 0.52mi | 4/2.0 | 2,150 (-13%) | 16mo | $210,000 | $98 | 40 |
| 7033 Amherst Ave | 0.56mi | 4/2.5 | 2,184 (-12%) | 15mo | $350,000 | $160 | 40 |
| 7720 Delmar Blvd | 0.62mi | 4/2.0 | 2,758 (+11%) | 15mo | $450,000 | $163 | 40 |
| 7056 Dartmouth Ave | 0.54mi | 4/2.0 | 2,150 (-13%) | 16mo | $325,000 | $151 | 39 |
| 7714 Delmar Blvd | 0.61mi | 4/2.0 | 2,144 (-14%) | 14mo | $350,000 | $163 | 37 |
Match score weights: distance 35% · size 25% · config 20% · recency 20%. Top-matched comps best support the ARV.
Projected returns pro-forma
-3.0% appreciation · 3.61% rent growth · sell at horizon
- IRR
- -2.7%
- Equity multiple
- 0.90×
- Total profit
- $-10,845
- Equity at exit
- $56,585
- IRR
- 7.6%
- Equity multiple
- 1.59×
- Total profit
- $62,898
- Equity at exit
- $32,812
Cash invested: $106,260 (down + closing). Projections, not guarantees.
Landlord ↔ Tenant lean methodology
- Overall (STATE)
- 81 Strongly Landlord-Friendly
- State Missouri
- 81 Strongly Landlord-Friendly · R+10
- County
- — inherits STATE
- City
- — inherits STATE
ZIP-level market 63130
- Rents YoY
- 3.6%
- Active inventory
- 162
- Price-to-rent
- 15.5×
Monthly cashflow live
- Estimated rent
- $4,078 high interval (Pro) →
- Mortgage (P&I)
- −$1,990
- Tax from tax record
- −$317 /mo · $3,805/yr
- Insurance
- −$158
- HOA
- −$0
- Vacancy / Maint / Mgmt
- −$856
- Net cashflow
- $756
Break-even live
2-unit breakdown (identical units grouped — click to expand)
| Units | Beds | Baths | Est. rent |
|---|---|---|---|
| 2× units | 4 | 2 | $4,078 |
| #1 | 4 | 2 | $2,039 |
| #2 | 4 | 2 | $2,039 |
| Total (2 units) | $4,078 | ||
UW: 25.0% down · 7.5% · 30yr · 1.5% tax · 5.0% vac · 8.0% maint · 8.0% mgmt
Financing live
Cash to close
- Down payment
- $94,875
- Closing costs
- $11,385
- Reserves months
- —
- Total cash needed
- —
Loan-product check · same deal, 3 products live
Conventional
25% down · 7.5% · 30yr
- Down + closing
- —
- Monthly P&I
- —
- Monthly cashflow
- —
- DSCR
- —
- Eligible?
- —
Personal DTI + credit; lowest rate.
DSCR
20% down · 8.5% · 30yr
- Down + closing
- —
- Monthly P&I
- —
- Monthly cashflow
- —
- DSCR
- —
- Eligible?
- —
No personal income docs; deal must DSCR.
Hard money
10% down · 12.0% · 12mo
- Down + closing
- —
- Monthly P&I
- —
- Monthly cashflow
- —
- DSCR
- —
- Eligible?
- —
Short-term bridge; refi at stabilization.
Rent comps 14 comps
| Address | Beds | Baths | Sqft | Rent | $/sqft | DOM | Units | Dist |
|---|---|---|---|---|---|---|---|---|
| 7333 Amherst Ave Unit 1W University City, MO | 3.0 | 1.0 | 1600 | $2,350 | $1.47 | 43d | 1 | 0.28mi |
| 7379 Pershing Ave Unit 1E Saint Louis, MO | 3.0 | 2.0 | 1700 | $2,295 | $1.35 | 1d | 1 | 0.30mi |
| 7260 Dartmouth Ave Unit 1-West University City, MO | 3.0 | 2.0 | 1650 | $1,795 | $1.09 | 43d | 1 | 0.36mi |
| 7256 Pershing Ave Unit A University City, MO | 3.0 | 2.0 | 2178 | $3,795 | $1.74 | 17d | 1 | 0.40mi |
| 7250 Pershing Ave Unit 1 University City, MO | 3.0 | 2.5 | 2016 | $3,700 | $1.84 | 23d | 1 | 0.41mi |
| 7541 Delmar Blvd Saint Louis, MO | 4.0 | 3.0 | 1940 | $3,295 | $1.70 | 1d | 1 | 0.41mi |
| 7227 Balson Ave Saint Louis, MO | 3.0 | 2.0 | 1682 | $1,650 | $0.98 | 7d | 1 | 0.46mi |
| 7205 Dorset Ave Saint Louis, MO | 3.0 | 3.0 | 2337 | $2,650 | $1.13 | 43d | 1 | 0.52mi |
| 7045 Pershing Ave Saint Louis, MO | 4.0 | 1.5 | 2080 | $3,900 | $1.88 | 1d | 1 | 0.67mi |
| 7330 Ahern Ave Saint Louis, MO | 3.0 | 1.5 | 1872 | $2,450 | $1.31 | 43d | 1 | 0.68mi |
| 1108 N Hanley Rd St. Louis, MO | 3.0 | 2.0 | 1800 | $1,795 | $1.00 | 12d | 1 | 0.89mi |
| 8500 Maryland Ave Saint Louis, MO | 1.0–3.0 | 1.0–2.0 | 1156 | $4,579 | $3.96 | 1d | 20 | 1.24mi |
| 7574 York Dr Clayton, MO | 3.0 | 2.0 | 1900 | $2,975 | $1.57 | 7d | 1 | 1.40mi |
| 937 S Bemiston Ave Clayton, MO | 3.0 | 2.5 | 2706 | $6,250 | $2.31 | 1d | 1 | 1.47mi |
Listing history 19 events
-
2026-06-18days on market $379,500 Active 134 DOM
-
2026-06-17days on market $379,500 Active 133 DOM
-
2026-06-16days on market $379,500 Active 132 DOM
-
2026-06-15days on market $379,500 Active 131 DOM
-
2026-06-13days on market $379,500 Active 129 DOM
-
2026-06-13days on market $379,500 Active 128 DOM
-
2026-06-09days on market $379,500 Active 125 DOM
-
2026-06-08days on market $379,500 Active 124 DOM
-
2026-06-07days on market $379,500 Active 123 DOM
-
2026-06-05days on market $379,500 Active 120 DOM
-
2026-06-03days on market $379,500 Active 119 DOM
-
2026-06-02days on market $379,500 Active 118 DOM
-
2026-06-01days on market $379,500 Active 117 DOM
-
2026-05-31days on market $379,500 Active 116 DOM
-
2026-05-11price $379,500 392-char remark
Show marketing remark (392 chars)
A wonderful spacious 2 family on Delmar Blvd close to Clayton near all the major arteries. Close to the Delmar loop, the development near Highway 170, grocery stores, and lots of the great items University City has to offer. Great for Owner Occupant or Investor. Beautiful hardwood floors, great architecture, central air conditioning, among many other items which make it a great investment.
-
2026-02-05$388,500 Active 392-char remark
Show marketing remark (392 chars)
A wonderful spacious 2 family on Delmar Blvd close to Clayton near all the major arteries. Close to the Delmar loop, the development near Highway 170, grocery stores, and lots of the great items University City has to offer. Great for Owner Occupant or Investor. Beautiful hardwood floors, great architecture, central air conditioning, among many other items which make it a great investment.
-
2026-02-05historical $388,500 392-char remark
Show marketing remark (392 chars)
A wonderful spacious 2 family on Delmar Blvd close to Clayton near all the major arteries. Close to the Delmar loop, the development near Highway 170, grocery stores, and lots of the great items University City has to offer. Great for Owner Occupant or Investor. Beautiful hardwood floors, great architecture, central air conditioning, among many other items which make it a great investment.
-
2002-07-08soldstatus $215,000
-
1993-12-01soldstatus
ⓘ Source: listings_history table (triggers on properties + properties_extension) + one-shot
backfill from property_details.listing_events for pre-trigger history.
Tax reassessment forecast MO · Resets to sale price
- Current annual tax
- $3,805 · $317/mo
- Projected year-2 tax
- $3,805 · $317/mo
- Expected delta
- $0/yr ($0/mo · 0.0%)
ⓘ Screening estimate from a state-policy table — verify with the county assessor before closing.
Climate risk First Street
- Flood 1/10 Low FEMA zone X (unshaded) · 0% chance over 30 yrs
- Wildfire 1/10 Low
- Heat 5/10 Major 7 d/yr ≥107°F today · 21 d/yr by 30 yrs out
- Wind 2/10 Low 100% chance of damaging wind over 30 yrs
- Air quality 4/10 Moderate 4 unhealthy d/yr today · 5 by 30 yrs out
Nearby sold comps map
Loading sold comps map…
Walkable amenities ~0.75 mi
Loading nearby amenities…
Taxation est. · year 1
- Rental income
- $48,936
- − Mortgage interest
- −$21,258
- − Property taxes
- −$3,805
- − Insurance
- −$1,898
- − Repairs & maintenance
- −$3,915
- − Management
- −$3,915
- − Depreciation
- −$11,040
- Taxable income
- $3,106
- Est. tax owed @ 24.0%
- −$745
- After-tax cash flow
- $8,330/yr
For passive investors: Depreciation is non-cash, so a rental often shows a tax loss while cash-flowing — sheltering income. Rental losses are passive: they offset passive income freely, and up to $25,000/yr can offset ordinary (W-2) income if you actively participate and your MAGI is under $100k (phasing out to $0 by $150k); unused losses carry forward. On sale, claimed depreciation is recaptured at up to 25%, and gains may owe capital-gains tax (a 1031 exchange can defer both). Figures are a year-1 estimate at your 24.0% rate — not tax advice; consult a CPA.
Schools (NCES district)
- District
- University City
- NCES district ID
- 2930660
- Math proficiency
- 15% ▼ -10.00%
- Reading proficiency
- 26% ▼ -7.00%
- Median HH income
- $52,927
- Composite
- 18.57/100
- National rank
- #8910
- State rank
- #297 of 324 in MO
Livability — University City
- Score
- 73/100
- State rank
- #84
- US rank
- #5618
Category grades
Schools grade is shown separately in the Schools card above.
Census & demographics
- Census place
- University City, MO
- County
- Saint Louis County · 888,823 people
- City population
- 28,910
- Metro
- St. Louis, MO-IL
- Population (ZIP)
- 28,910
- Household income
- $85,823
- Rent vs Own
- Severe rent burden
- 893.0
Population outlook (St. Louis County) Hauer SSP2
- Today (2025)
- 1,025,227 people
- By 2030
- 1,028,023 · +0.3%
- By 2040
- 1,020,940 · -0.4%
- By 2050
- 1,007,280 · -1.8%
- By 2075
- 987,277 · -3.7%
- By 2100
- 921,984 · -10.1%
Race, ethnicity, and origin ACS 2023
- Neighborhood character
- Diverse neighborhood (Simpson 0.61)
- Race & ethnicity
- White 54% Black 31% Asian 6% Two or more races 6% Hispanic / Latino 4%
- Common ancestry
- Italian 3% Romanian 3% Lithuanian 2%
- Foreign-born
- 11% · China, Canada, Vietnam
- Languages at home
- 89% English-only · Chinese 4% Spanish 2% French/Haitian/Cajun 1%
Political lean MEDSL · St. Louis
- 2024 margin
- Strong D (+23.4) · D 60.8% · R 37.4% · Other 1.7%
- 2008→2024 swing
- +3.5pp toward D · 2008: 19.9pp · 2024: 23.4pp
- All cycles
- 2024: D+23.4 2020: D+24.0 2016: D+16.2 2012: D+13.7 2008: D+19.9
Not yet ingested
- Civics
- —
Market trends
- HPI YoY
- ▼ -436.88%
- Current HPI
- 185.599
- Rent YoY
- ▲ 3.61%
- Metro
- St. Louis, MO-IL
- State GDP YoY
- ▲ 1.84%
- F500 in state
- 20
Industry mix (Fortune 500 HQ in MO)
| Industry | F500 HQs | Revenue |
|---|---|---|
| Healthcare | 1 | $163B |
|
||
| Insurance | 1 | $21B |
|
||
| Industrial Technology | 1 | $17B |
|
||
| Retail | 1 | $16B |
|
||
| Industrial Distribution | 1 | $10B |
|
||
| Utilities | 1 | $9B |
|
||
Price history
+76.5% since first listed5 events — show timeline
- 2026-05-11 Price Changed $379,500 MARIS as Distributed by MLS Grid
- 2026-02-05 Listed $388,500 MARIS as Distributed by MLS Grid
- 2026-02-05 Coming Soon $388,500 MARIS as Distributed by MLS Grid
- 2002-07-08 Sold (Public Records) $215,000 Public Records
- 1993-12-01 Sold (Public Records) — Public Records
Property tax history
+2.5%/yrLatest (2022): $3,805 · +1.0% YoY. Source: county tax records.
Cash-flow waterfall
monthlySold comps — $/sqft
last 12 mo · ≤1 miLoading sold comps…