909 W 29th St · Indianapolis city (balance), IN
Flood risk 1/10 · Minimal
- FEMA flood zone
- X (unshaded)
- Chance of flooding over 30 yrs
- 0.0%
- Est. flood insurance / yr
- $473 – $860
Fire risk 1/10 · Minimal
- Est. fire insurance / yr
- $717 – $1,331
Heat risk 3/10 · Minor
- Hot days now (above 101°F)
- 7 days/yr
- Hot days in 30 yrs
- 19 days/yr
Wind risk 2/10 · Minimal
- Chance of severe wind over 30 yrs
- 0.0%
Air-quality risk 4/10 · Minor
- Unhealthy air days now
- 5 days/yr
- Unhealthy air days in 30 yrs
- 7 days/yr
Risk factors via First Street. Map © Google.
Why this score? — see what drove the C grade
The composite is a weighted blend of 9 inputs, each scored 0–100. Each bar is that input's sub-score; the figure is the points it added to the 100-point composite (weight × sub-score).
- Cash flow +19.8/30.0
- ARV discount +14.2/15.0
- DSCR +6.3/10.0
- 1% rule +5.1/10.0
- Rent growth +4.1/5.0
- Livability +2.5/5.0
- Condition / age +2.5/5.0
- Schools +1.4/10.0
- Appreciation +0.0/10.0
$144,500
🖨 Deal sheet 📄 Offer letter ✓ Due diligence
Listing remarks MLS
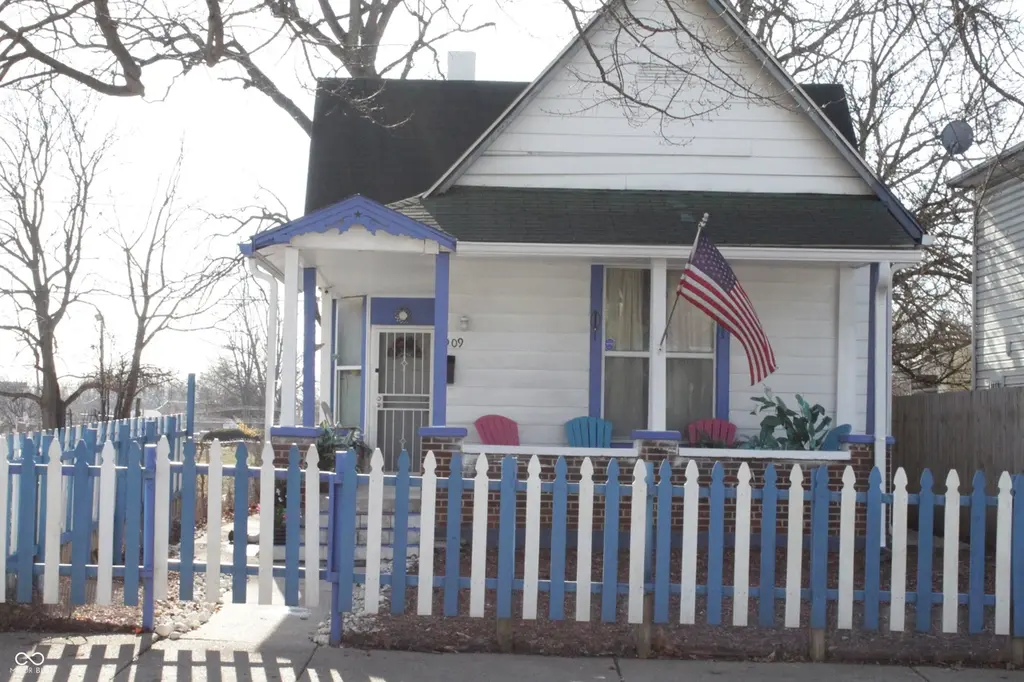
Discover the potential within 909 W 29th ST NW, Indianapolis, IN, a property presenting a great investment opportunity. This single-family residence awaits your vision and expertise. Within this residence, you will find three bedrooms, offering ample space for comfortable living. Imagine creating personalized retreats within each of these rooms, designed to suit your individual style and needs. This is a fantastic opportunity to put your own personal touch on this home. A single full bathroom provides essential convenience. Envision transforming this space into a personal oasis, a tranquil retreat to begin and end each day. The porch offers a delightful space to enjoy the outdoors. Picture yourself relaxing here, savoring the fresh air and creating lasting memories. This 1222 square foot living area is brimming with potential. The 3790 square foot lot offers even more scope. With its 1920s charm, this one-story home is calling all handy homeowners and investors.
Key facts
- 3,790 sq ft lot
- Garage
- Built 1920
Neighborhood map
What this means for you Summary
Snapshot
- This is a 3-bed/1.0-bath single-family listed at $144k.
Deal economics
- At list price, monthly cash flow is $173 ($2k/yr) — positive.
- The deal already cash-flows at list — no discount required.
- Meets the 1% rule at list price ($1k rent vs $144k).
- Recommended offer: $127k (12.0% below list) — sets the bar for market timing.
- Cap rate 7.7% vs local median 4.4% in Indianapolis city (balance) — top-decile yield for the area; either an underpriced asset or a hidden risk that comps aren't pricing in. Stress-test before assuming the spread holds.
Location & tenants
- Location reads: area grade C — affects rentability + tenant quality, not the cash-flow math above.
- Indianapolis Public Schools (urban): math 14% / reading 20% proficiency, ranked #286 of 301 in IN (top 95%) — low school quality limits family demand, transient renter base, plan for 1-2y turnover; 77% free/reduced lunch — lower-income household profile, screen leases tightly.
- Market conditions: Rents rising fast (+6.4%/yr); 279 active listings in the ZIP; 40 comparable units currently listed for rent nearby; rentals at typical pace (median 24d on market — plan ~3-4 weeks tenant-placement turnaround); 40% of comp listings sitting > 30 days — soft ceiling on asking rent; 1,906 units permitted in Marion County in 2024 (621 in 5+ unit buildings).
Forward outlook
- Local home prices are declining (-3.0%/yr); year-one equity from $999 of loan paydown is wiped out by about $4k of value loss. Plan a longer hold.
- Marion County population projected at +18% by 2050 — long-run rental-demand tailwind backs the buy-and-hold thesis.
- At projected returns (-3.0% appreciation + 6.4% rent growth), your $40k cash investment doubles in ~10 years — after that, you're playing with house money.
Negotiation context
- It's been on market 162 days — a 12% lower offer ($127k) is reasonable based on typical stale-listing flexibility.
- 13 sale attempts since 22y ago with the ask held roughly flat each time — persistent listings suggest the price (not the market) is what's stuck; bring a comps-based counter.
- Current owner paid $31k; list at $144k implies a 366% gain — meaningful room to come down on a strong offer.
Risks & watch-outs
- Watch-outs: built in 1920 — expect roof / HVAC / electrical / plumbing capex.
Questions for the listing agent
- It's been on market 162 days. Have you received any prior offers? Is the seller open to a 12% concession, seller financing, or rate buy-down credit?
- Built in 1920 — when were the roof, HVAC, electrical panel, plumbing, and water heater last replaced?
- Why hasn't it sold? Are there any deal-killer items the seller is aware of (foundation, flood, title, zoning, code violations)?
- Is there a deadline driving the sale (1031 exchange, divorce, estate, relocation)? That informs how much negotiation room exists.
- What's the average days-on-market for RENTAL listings here right now (not sales)? A rising rental-DOM trend means longer vacancies and softer asking-rent achievability than the comps imply.
- What's the recent tenant-quality profile in this submarket — average credit score on applications, eviction rate, late-payment / NSF rate, and stable-employment percentage? A property-management company in the area should have these aggregated.
- How much new for-sale + rental construction is in the pipeline within 1–3 miles? Heavy new supply typically softens prices + rents 12–24 months out; constrained supply supports both.
Investment metrics
- 1% rule
- 1.01% ✓
- Cap rate
- 7.73%
- Cash-on-cash
- 5.13%
- DSCR
- 1.23
- GRM
- 8.3
CMA / ARV
- ARV (median comp)
- $169,563
- List price
- $144,500
- Delta
- -14.78%
- Verdict
- UNDERPRICED
- Comps
- 20 within 1.0 mi
Show comp detail 12 sales within ~0.75 mi
| Address | Dist | Beds/Ba | Sqft | Sold | Price | $/sf | Match |
|---|---|---|---|---|---|---|---|
| 953 W 25th St | 0.38mi | 3/2.0 | 1,180 (-3%) | 4mo | $160,000 | $136 | 69 |
| 2442 Ethel Ave | 0.54mi | 2/1.0 (-1) | 1,214 (-1%) | 3mo | $150,000 | $124 | 66 |
| 851 W 25th St | 0.38mi | 3/1.5 | 1,334 (+9%) | 4mo | $90,000 | $67 | 62 |
| 721 W 32nd St | 0.37mi | 3/2.0 | 1,108 (-9%) | 3mo | $174,900 | $158 | 61 |
| 837 W 25th St | 0.39mi | 3/1.0 | 1,080 (-12%) | 4mo | $160,000 | $148 | 59 |
| 1303 W 25th St | 0.63mi | 3/2.0 | 1,156 (-5%) | 2mo | $211,000 | $183 | 56 |
| 3042 Graceland Ave | 0.74mi | 3/2.0 | 1,200 (-2%) | 3mo | $163,700 | $136 | 56 |
| 451 W 26th St | 0.55mi | 3/2.0 | 1,320 (+8%) | 4mo | $85,000 | $64 | 54 |
| 330 Congress Ave | 0.67mi | 3/2.0 | 1,156 (-5%) | 3mo | $210,000 | $182 | 53 |
| 2949 Shriver Ave | 0.59mi | 3/1.0 | 1,080 (-12%) | 2mo | $138,000 | $128 | 51 |
| 1215 W 25th St | 0.54mi | 2/1.0 (-1) | 1,344 (+10%) | 2mo | $139,000 | $103 | 51 |
| 1309 W 26th St | 0.58mi | 3/2.0 | 1,050 (-14%) | 1mo | $210,000 | $200 | 45 |
Match score weights: distance 35% · size 25% · config 20% · recency 20%. Top-matched comps best support the ARV.
Projected returns pro-forma
-3.0% appreciation · 6.43% rent growth · sell at horizon
- IRR
- -4.6%
- Equity multiple
- 0.82×
- Total profit
- $-7,186
- Equity at exit
- $21,545
- IRR
- 8.7%
- Equity multiple
- 1.76×
- Total profit
- $30,891
- Equity at exit
- $12,494
Cash invested: $40,460 (down + closing). Projections, not guarantees.
Landlord ↔ Tenant lean methodology
- Overall (STATE)
- 90 Strongly Landlord-Friendly
- State Indiana
- 90 Strongly Landlord-Friendly · R+11
- County
- — inherits STATE
- City
- — inherits STATE
ZIP-level market 46208
- Rents YoY
- 6.4%
- Active inventory
- 279
- Price-to-rent
- 8.3×
Monthly cashflow live
- Estimated rent
- $1,458 high interval (Pro) →
- Mortgage (P&I)
- −$758
- Tax from tax record
- −$161 /mo · $1,934/yr
- Insurance
- −$60
- HOA
- −$0
- Vacancy / Maint / Mgmt
- −$306
- Net cashflow
- $173
Break-even live
UW: 25.0% down · 7.5% · 30yr · 1.5% tax · 5.0% vac · 8.0% maint · 8.0% mgmt
Financing live
Cash to close
- Down payment
- $36,125
- Closing costs
- $4,335
- Reserves months
- —
- Total cash needed
- —
Loan-product check · same deal, 3 products live
Conventional
25% down · 7.5% · 30yr
- Down + closing
- —
- Monthly P&I
- —
- Monthly cashflow
- —
- DSCR
- —
- Eligible?
- —
Personal DTI + credit; lowest rate.
DSCR
20% down · 8.5% · 30yr
- Down + closing
- —
- Monthly P&I
- —
- Monthly cashflow
- —
- DSCR
- —
- Eligible?
- —
No personal income docs; deal must DSCR.
Hard money
10% down · 12.0% · 12mo
- Down + closing
- —
- Monthly P&I
- —
- Monthly cashflow
- —
- DSCR
- —
- Eligible?
- —
Short-term bridge; refi at stabilization.
Rent comps 40 comps
| Address | Beds | Baths | Sqft | Rent | $/sqft | DOM | Units | Dist |
|---|---|---|---|---|---|---|---|---|
| 826 W 29th St Indianapolis, IN | 3.0 | 2.0 | 1200 | $1,595 | $1.33 | 43d | 1 | 0.11mi |
| 824 W 29th St Indianapolis, IN | 3.0 | 2.0 | 1200 | $1,595 | $1.33 | 43d | 1 | 0.11mi |
| 648 W 30th St Indianapolis, IN | 3.0 | 2.0 | 1300 | $1,500 | $1.15 | 23d | 1 | 0.26mi |
| 1054 W 31st St Unit A Indianapolis, IN | 2.0 | 1.0 | 1200 | $1,500 | $1.25 | 43d | 1 | 0.31mi |
| 560 Udell St Indianapolis, IN | 3.0 | 1.5 | 1176 | $1,190 | $1.01 | 23d | 1 | 0.31mi |
| 538 W 29th St Indianapolis, IN | 3.0 | 1.0 | 1132 | $1,349 | $1.19 | 23d | 1 | 0.35mi |
| 926 W 32nd St Indianapolis, IN | 3.0 | 2.0 | 1050 | $1,295 | $1.23 | 7d | 1 | 0.37mi |
| 516 W 28th St Indianapolis, IN | 2.0 | 1.0 | 1005 | $1,100 | $1.09 | 23d | 1 | 0.40mi |
| 1227 W 29th St Indianapolis, IN | 3.0 | 1.5 | 1056 | $1,250 | $1.18 | 23d | 1 | 0.41mi |
| 3217 Rader St Indianapolis, IN | 3.0 | 1.0 | 1200 | $1,299 | $1.08 | 43d | 1 | 0.41mi |
| 970 Edgemont Ave Indianapolis, IN | 2.0 | 1.0 | 740 | $845 | $1.14 | 4d | 1 | 0.42mi |
| 3017 Ethel Ave Indianapolis, IN | 3.0 | 1.5 | 1079 | $1,400 | $1.30 | 23d | 1 | 0.43mi |
| 906 Burdsal Pkwy Indianapolis, IN | 2.0 | 1.0 | 936 | $1,295 | $1.38 | 23d | 1 | 0.47mi |
| 908 Burdsal Pkwy Marion, IN | 2.0 | 1.0 | 936 | $1,300 | $1.39 | 23d | 1 | 0.47mi |
| 1261 W 32nd St Indianapolis, IN | 2.0 | 1.0 | 832 | $975 | $1.17 | 43d | 1 | 0.58mi |
| 445 W 25th St Indianapolis, IN | 4.0 | 2.0 | 1500 | $1,900 | $1.27 | 43d | 1 | 0.59mi |
| 1244 Edgemont Ave Indianapolis, IN | 2.0 | 1.0 | 1092 | $1,275 | $1.17 | 43d | 1 | 0.61mi |
| 1039 W 36th St Indianapolis, IN | 2.0 | 1.0 | 864 | $995 | $1.15 | 43d | 1 | 0.66mi |
| 3031 Boulevard Pl Indianapolis, IN | 3.0 | 1.5 | 1395 | $1,450 | $1.04 | 17d | 1 | 0.69mi |
| 2235 Doctor Martin Luther King Junior St Indianapolis, IN | 3.0 | 1.5 | 948 | $1,700 | $1.79 | 43d | 1 | 0.75mi |
| 1519 W 28th St Indianapolis, IN | 2.0 | 1.0 | 816 | $895 | $1.10 | 43d | 1 | 0.76mi |
| 2808 N Capitol Ave Indianapolis, IN | 2.0 | 1.0 | 900 | $975 | $1.08 | 23d | 1 | 0.77mi |
| 1470 W 32nd St Indianapolis, IN | 2.0 | 1.0 | 700 | $1,000 | $1.43 | 43d | 1 | 0.80mi |
| 3440 N Harding St Indianapolis, IN | 2.0 | 1.0 | 754 | $1,275 | $1.69 | 20d | 1 | 0.81mi |
| 3440 N Harding St Indianapolis, IN | 2.0 | 1.0 | 754 | $1,325 | $1.76 | 43d | 1 | 0.81mi |
| 1367 W Pruitt St Indianapolis, IN | 3.0 | 1.0 | 1088 | $1,450 | $1.33 | 43d | 1 | 0.88mi |
| 2248 N Harding St Indianapolis, IN | 2.0 | 1.0 | 1100 | $899 | $0.82 | 23d | 1 | 0.89mi |
| 1415 W Pruitt St Indianapolis, IN | 3.0 | 1.0 | 1001 | $1,249 | $1.25 | 23d | 1 | 0.94mi |
| 1133 W 21st St Indianapolis, IN | 3.0 | 2.0 | 1296 | $1,495 | $1.15 | 23d | 1 | 0.94mi |
| 1135 W 21st St Indianapolis, IN | 3.0 | 2.0 | 1296 | $1,495 | $1.15 | 23d | 1 | 0.94mi |
| 2318 N Capitol Ave Indianapolis, IN | 3.0 | 1.0 | 1440 | $1,050 | $0.73 | 43d | 1 | 0.96mi |
| 55 W Fall Creek Parkway South Dr Unit C Indianapolis, IN | 2.0 | 1.0 | 1000 | $1,035 | $1.03 | 43d | 1 | 1.01mi |
| 3413 N Capitol Ave Indianapolis, IN | 3.0 | 1.0 | 1176 | $1,249 | $1.06 | 10d | 1 | 1.03mi |
| 3415 N Capitol Ave Indianapolis, IN | 3.0 | 1.0 | 1176 | $1,249 | $1.06 | 23d | 1 | 1.03mi |
| 118 W 23rd St Indianapolis, IN | 3.0 | 1.5 | 1456 | $1,300 | $0.89 | 10d | 1 | 1.06mi |
| 3469 Graceland Ave Indianapolis, IN | 2.0 | 1.0 | 1000 | $1,200 | $1.20 | 43d | 1 | 1.06mi |
| 3103 N Meridian St Indianapolis, IN | 3.0 | 2.0 | 1280 | $1,775 | $1.39 | 23d | 1 | 1.10mi |
| 2625 N Meridian St Indianapolis, IN | 1.0–2.0 | 1.0–2.0 | 850 | $2,150 | $2.53 | 7d | 8 | 1.10mi |
| 1920 Sugar Grove Ave Indianapolis, IN | 3.0 | 1.5 | 1378 | $1,175 | $0.85 | 3d | 1 | 1.10mi |
| 143 W 35th St Indianapolis, IN | 3.0 | 1.0 | 1235 | $1,175 | $0.95 | 7d | 1 | 1.11mi |
Listing history 41 events
-
2026-06-18days on market $144,500 Active 162 DOM
-
2026-06-17days on market $144,500 Active 161 DOM
-
2026-06-16days on market $144,500 Active 160 DOM
-
2026-06-15days on market $144,500 Active 159 DOM
-
2026-06-13days on market $144,500 Active 157 DOM
-
2026-06-13days on market $144,500 Active 156 DOM
-
2026-06-09days on market $144,500 Active 153 DOM
-
2026-06-08days on market $144,500 Active 152 DOM
-
2026-06-07days on market $144,500 Active 151 DOM
-
2026-06-03days on market $144,500 Active 147 DOM
-
2026-06-02days on market $144,500 Active 146 DOM
-
2026-06-01days on market $144,500 Active 145 DOM
-
2026-05-31days on market $144,500 Active 144 DOM
-
2026-02-18price $144,500 981-char remark
Show marketing remark (981 chars)
Discover the potential within 909 W 29th ST NW, Indianapolis, IN, a property presenting a great investment opportunity. This single-family residence awaits your vision and expertise. Within this residence, you will find three bedrooms, offering ample space for comfortable living. Imagine creating personalized retreats within each of these rooms, designed to suit your individual style and needs. This is a fantastic opportunity to put your own personal touch on this home. A single full bathroom provides essential convenience. Envision transforming this space into a personal oasis, a tranquil retreat to begin and end each day. The porch offers a delightful space to enjoy the outdoors. Picture yourself relaxing here, savoring the fresh air and creating lasting memories. This 1222 square foot living area is brimming with potential. The 3790 square foot lot offers even more scope. With its 1920s charm, this one-story home is calling all handy homeowners and investors.
-
2026-01-09status Active 981-char remark
Show marketing remark (981 chars)
Discover the potential within 909 W 29th ST NW, Indianapolis, IN, a property presenting a great investment opportunity. This single-family residence awaits your vision and expertise. Within this residence, you will find three bedrooms, offering ample space for comfortable living. Imagine creating personalized retreats within each of these rooms, designed to suit your individual style and needs. This is a fantastic opportunity to put your own personal touch on this home. A single full bathroom provides essential convenience. Envision transforming this space into a personal oasis, a tranquil retreat to begin and end each day. The porch offers a delightful space to enjoy the outdoors. Picture yourself relaxing here, savoring the fresh air and creating lasting memories. This 1222 square foot living area is brimming with potential. The 3790 square foot lot offers even more scope. With its 1920s charm, this one-story home is calling all handy homeowners and investors.
-
2026-01-04$150,000 Active 981-char remark
Show marketing remark (981 chars)
Discover the potential within 909 W 29th ST NW, Indianapolis, IN, a property presenting a great investment opportunity. This single-family residence awaits your vision and expertise. Within this residence, you will find three bedrooms, offering ample space for comfortable living. Imagine creating personalized retreats within each of these rooms, designed to suit your individual style and needs. This is a fantastic opportunity to put your own personal touch on this home. A single full bathroom provides essential convenience. Envision transforming this space into a personal oasis, a tranquil retreat to begin and end each day. The porch offers a delightful space to enjoy the outdoors. Picture yourself relaxing here, savoring the fresh air and creating lasting memories. This 1222 square foot living area is brimming with potential. The 3790 square foot lot offers even more scope. With its 1920s charm, this one-story home is calling all handy homeowners and investors.
-
2020-09-11status Pending 194-char remark
Show marketing remark (194 chars)
Great investment/owner occupied opportunity. Currently vacant. This property can be purchased by itself or as a package of up to 11 properties. See supplements of listed properties attached.
-
2020-09-10soldstatus $31,000 Sold 194-char remark
Show marketing remark (194 chars)
Great investment/owner occupied opportunity. Currently vacant. This property can be purchased by itself or as a package of up to 11 properties. See supplements of listed properties attached.
-
2020-08-31status Pending 194-char remark
Show marketing remark (194 chars)
Great investment/owner occupied opportunity. Currently vacant. This property can be purchased by itself or as a package of up to 11 properties. See supplements of listed properties attached.
-
2020-04-22$44,000 Active 194-char remark
Show marketing remark (194 chars)
Great investment/owner occupied opportunity. Currently vacant. This property can be purchased by itself or as a package of up to 11 properties. See supplements of listed properties attached.
-
2019-10-31historical
-
2019-08-05status Active
-
2019-07-31historical
-
2019-05-14$47,000 Active
-
2019-04-30historical
-
2019-02-01status Active
-
2019-01-31historical
-
2018-11-01status Active
-
2018-10-31historical
-
2018-10-02$47,000 Active
-
2014-02-07historical
-
2014-02-05soldstatus $22,270
-
2014-01-13$29,900
-
2008-01-19historical
-
2007-10-22$9,900
-
2007-10-05historical
-
2007-04-21$65,000
-
2005-05-24historical
-
2004-11-29$37,000
-
2004-10-23historical
-
2004-04-24$30,000
ⓘ Source: listings_history table (triggers on properties + properties_extension) + one-shot
backfill from property_details.listing_events for pre-trigger history.
Tax reassessment forecast IN · Partial reset (capped growth)
- Current annual tax
- $1,934 · $161/mo
- Projected year-2 tax
- $1,934 · $161/mo
- Expected delta
- $0/yr ($0/mo · 0.0%)
ⓘ Screening estimate from a state-policy table — verify with the county assessor before closing.
Climate risk First Street
- Flood 1/10 Low FEMA zone X (unshaded) · 0% chance over 30 yrs
- Wildfire 1/10 Low
- Heat 3/10 Moderate 7 d/yr ≥101°F today · 19 d/yr by 30 yrs out
- Wind 2/10 Low 0% chance of damaging wind over 30 yrs
- Air quality 4/10 Moderate 5 unhealthy d/yr today · 7 by 30 yrs out
Nearby sold comps map
Loading sold comps map…
Walkable amenities ~0.75 mi
Loading nearby amenities…
Taxation est. · year 1
- Rental income
- $17,500
- − Mortgage interest
- −$8,094
- − Property taxes
- −$1,934
- − Insurance
- −$722
- − Repairs & maintenance
- −$1,400
- − Management
- −$1,400
- − Depreciation
- −$4,204
- Taxable loss
- −$255
- Est. tax savings @ 24.0%
- +$61
- After-tax cash flow
- $2,136/yr
For passive investors: Depreciation is non-cash, so a rental often shows a tax loss while cash-flowing — sheltering income. Rental losses are passive: they offset passive income freely, and up to $25,000/yr can offset ordinary (W-2) income if you actively participate and your MAGI is under $100k (phasing out to $0 by $150k); unused losses carry forward. On sale, claimed depreciation is recaptured at up to 25%, and gains may owe capital-gains tax (a 1031 exchange can defer both). Figures are a year-1 estimate at your 24.0% rate — not tax advice; consult a CPA.
Schools (NCES district)
- District
- Indianapolis Public Schools
- NCES district ID
- 1804770
- Math proficiency
- 14% ▼ -7.00%
- Reading proficiency
- 20% ▼ -3.00%
- Median HH income
- $32,034
- Composite
- 13.69/100
- National rank
- #9499
- State rank
- #286 of 301 in IN
Livability — Indianapolis city (balance)
No livability data for this city. (Only ~50 U.S. cities are tracked.)
Census & demographics
- Census place
- Indianapolis city (balance), IN
- County
- Marion County · 998,460 people
- City population
- 881,119
- Metro
- Indianapolis-Carmel-Anderson, IN
- Population (ZIP)
- 22,379
- Household income
- $60,062
- Rent vs Own
- Severe rent burden
- 978.0
Population outlook (Marion County) Hauer SSP2
- Today (2025)
- 1,025,572 people
- By 2030
- 1,065,727 · +3.9%
- By 2040
- 1,141,577 · +11.3%
- By 2050
- 1,208,920 · +17.9%
- By 2075
- 1,367,288 · +33.3%
- By 2100
- 1,438,201 · +40.2%
Race, ethnicity, and origin ACS 2023
- Neighborhood character
- Diverse neighborhood (Simpson 0.62)
- Race & ethnicity
- White 46% Black 40% Hispanic / Latino 8% Two or more races 6% Asian 2%
- Hispanic origin (detail)
- Mexican 4%
- Common ancestry
- Romanian 2% Slovak 2% Italian 1%
- Foreign-born
- 4% · Canada
- Languages at home
- 93% English-only · Spanish 5% French/Haitian/Cajun 1% Other Indo-European 1%
Political lean MEDSL · Marion
- 2024 margin
- Strong D (+27.7) · D 63.0% · R 35.3% · Other 1.7%
- 2008→2024 swing
- -0.7pp no change · 2008: 28.4pp · 2024: 27.7pp
- All cycles
- 2024: D+27.7 2020: D+29.1 2016: D+22.8 2012: D+22.2 2008: D+28.4
Not yet ingested
- Civics
- —
Market trends
- HPI YoY
- ▼ -324.63%
- Current HPI
- 319.7725
- Rent YoY
- ▲ 6.43%
- Metro
- Indianapolis-Carmel-Anderson, IN
- State GDP YoY
- ▲ 2.90%
- F500 in state
- 18
Industry mix (Fortune 500 HQ in IN)
| Industry | F500 HQs | Revenue |
|---|---|---|
| Industrial Machinery | 2 | $37B |
|
||
| Healthcare | 1 | $177B |
|
||
| Pharmaceuticals | 1 | $45B |
|
||
| Metals / Steel | 1 | $18B |
|
||
| Agriculture | 1 | $17B |
|
||
| Packaging | 1 | $12B |
|
||
Price history
+381.7% since first listed28 events — show timeline
- 2026-02-18 Price Changed $144,500 MIBOR as Distributed by MLS Grid
- 2026-01-09 Relisted — MIBOR as Distributed by MLS Grid
- 2026-01-04 Listed $150,000 MIBOR as Distributed by MLS Grid
- 2020-09-11 Pending — MIBOR as Distributed by MLS Grid
- 2020-09-10 Sold (MLS) $31,000 MIBOR as Distributed by MLS Grid
- 2020-08-31 Pending — MIBOR as Distributed by MLS Grid
- 2020-04-22 Listed $44,000 MIBOR as Distributed by MLS Grid
- 2019-10-31 Listing Removed — MIBOR as Distributed by MLS Grid
- 2019-08-05 Relisted — MIBOR as Distributed by MLS Grid
- 2019-07-31 Listing Removed — MIBOR as Distributed by MLS Grid
- 2019-05-14 Listed $47,000 MIBOR as Distributed by MLS Grid
- 2019-04-30 Listing Removed — MIBOR as Distributed by MLS Grid
- 2019-02-01 Relisted — MIBOR as Distributed by MLS Grid
- 2019-01-31 Listing Removed — MIBOR as Distributed by MLS Grid
- 2018-11-01 Relisted — MIBOR as Distributed by MLS Grid
- 2018-10-31 Listing Removed — MIBOR as Distributed by MLS Grid
- 2018-10-02 Listed $47,000 MIBOR as Distributed by MLS Grid
- 2014-02-07 Listing Removed — MIBOR as Distributed by MLS Grid
- 2014-02-05 Sold (MLS) $22,270 MIBOR as Distributed by MLS Grid
- 2014-01-13 Listed $29,900 MIBOR as Distributed by MLS Grid
- 2008-01-19 Listing Removed — MIBOR as Distributed by MLS Grid
- 2007-10-22 Listed $9,900 MIBOR as Distributed by MLS Grid
- 2007-10-05 Listing Removed — MIBOR as Distributed by MLS Grid
- 2007-04-21 Listed $65,000 MIBOR as Distributed by MLS Grid
- 2005-05-24 Listing Removed — MIBOR as Distributed by MLS Grid
- 2004-11-29 Listed $37,000 MIBOR as Distributed by MLS Grid
- 2004-10-23 Listing Removed — MIBOR as Distributed by MLS Grid
- 2004-04-24 Listed $30,000 MIBOR as Distributed by MLS Grid
Property tax history
+10.0%/yrLatest (2025): $1,934 · +15.8% YoY. Source: county tax records.
Cash-flow waterfall
monthlySold comps — $/sqft
last 12 mo · ≤1 miLoading sold comps…