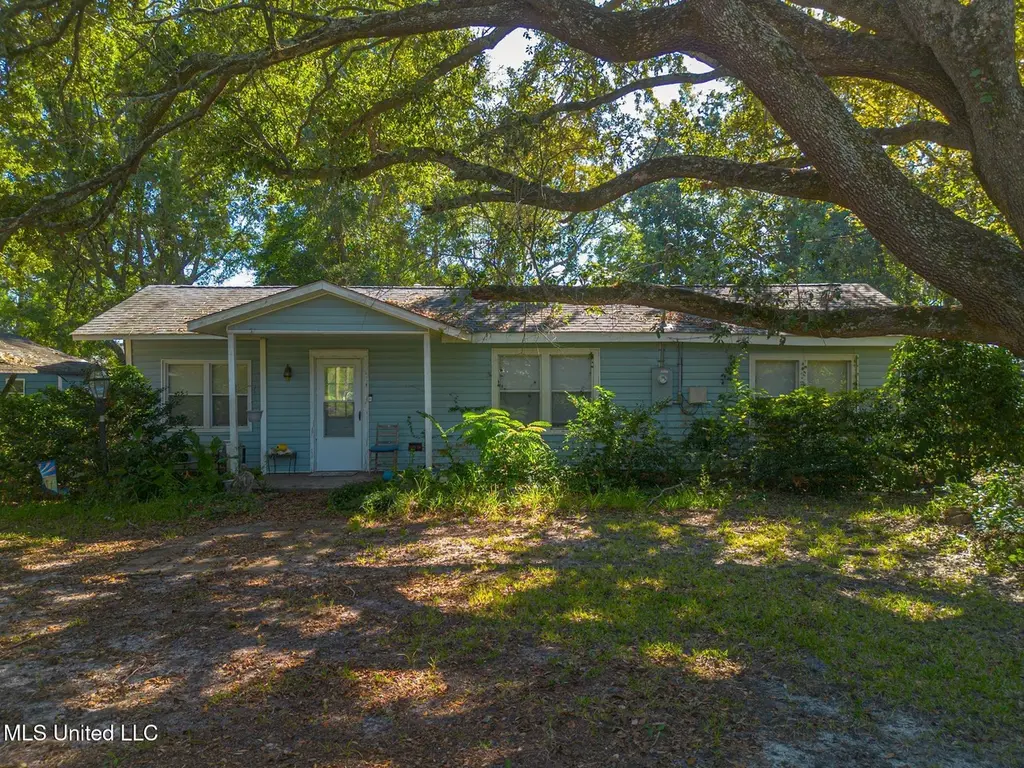
4409 29th St · Gulfport, MS
Flood risk 1/10 · Minimal
- FEMA flood zone
- X (unshaded)
- Chance of flooding over 30 yrs
- 0.0%
- Est. flood insurance / yr
- $507 – $1,088
Fire risk 3/10 · Minor
- Est. fire insurance / yr
- $1,241 – $2,305
Heat risk 10/10 · Severe
- Hot days now (above 106°F)
- 7 days/yr
- Hot days in 30 yrs
- 23 days/yr
Wind risk 9/10 · Severe
- Chance of severe wind over 30 yrs
- 99.0%
Air-quality risk 1/10 · Minimal
- Unhealthy air days now
- 0 days/yr
- Unhealthy air days in 30 yrs
- 0 days/yr
Risk factors via First Street. Map © Google.
Why this score? — see what drove the C- grade
The composite is a weighted blend of 9 inputs, each scored 0–100. Each bar is that input's sub-score; the figure is the points it added to the 100-point composite (weight × sub-score).
- Cash flow +20.9/30.0
- DSCR +6.6/10.0
- Rent growth +5.0/5.0
- ARV discount +4.5/15.0
- 1% rule +4.3/10.0
- Livability +3.7/5.0
- Schools +3.4/10.0
- Condition / age +2.5/5.0
- Appreciation +0.0/10.0
$130,000
🖨 Deal sheet 📄 Offer letter ✓ Due diligence
Listing remarks MLS
Zoned Residential as well as B1 business, this property offers the chance to create something special. Conveniently located near the Seabee base, minutes to I-10 for an easy commute, and a short drive to the beach with NO FLOOD insurance required. This property sits on 3 parcels with a total of 10 lots (1.13 acres) offering a unique opportunity with plenty of room and potential for your next project. Being sold AS-IS - renovate, rebuild, or reimagine - the options are wide open!
Key facts
- 3 parcels
- 10 lots
- Unique opportunity
Tags
Neighborhood map
What this means for you Summary
Snapshot
- This is a 2-bed/1.0-bath single-family listed at $130k.
Deal economics
- At list price, monthly cash flow is $180 ($2k/yr) — positive.
- The deal already cash-flows at list — no discount required.
- To meet the 1% rule (rent ≥ 1% of price), the offer needs to be $120k (7.4% below list).
- Recommended offer: $114k (12.0% below list) — sets the bar for market timing.
- Cap rate 8.0% vs local median 4.9% in Gulfport — top-decile yield for the area; either an underpriced asset or a hidden risk that comps aren't pricing in. Stress-test before assuming the spread holds.
Location & tenants
- Location reads 73/100 on livability (#15 in MS) — a middle-class / working-renter tenant base. Strengths: cost of living A+, housing A+, health & safety A+; Watch: schools D, amenities F, commute F.
- Gulfport School District (urban): math 41% / reading 42% proficiency, ranked #37 of 130 in MS (top 28%) — families likely to look elsewhere, expect single-tenant / working-renter base with shorter leases; 67% free/reduced lunch — lower-income household profile, screen leases tightly.
- Market conditions: Rents rising fast (+10.5%/yr); 252 active listings in the ZIP; 11 comparable units currently listed for rent nearby; rentals leasing fast (median 14d on market — plan ~1-2 weeks tenant-placement turnaround); lower-income renter base — watch delinquency; 2,194 units permitted in Harrison County in 2024 (0 in 5+ unit buildings).
- This rent runs 42% of the median local income ($35k/yr) — at the standard rent-burdened threshold; future hikes will face affordability resistance.
Forward outlook
- Local home prices are declining (-3.0%/yr); year-one equity from $899 of loan paydown is wiped out by about $4k of value loss. Plan a longer hold.
- Harrison County population projected at +27% by 2050 — long-run rental-demand tailwind backs the buy-and-hold thesis.
- At projected returns (-3.0% appreciation + 8.0% rent growth), your $36k cash investment doubles in ~9 years — after that, you're playing with house money.
Negotiation context
- It's been on market 244 days — a 12% lower offer ($114k) is reasonable based on typical stale-listing flexibility.
Risks & watch-outs
- Watch-outs: built in 1945 — expect roof / HVAC / electrical / plumbing capex.
- Climate carrying-cost: severe wind risk, 99% chance of damaging wind over 30y; extreme-heat days projected 7→23/yr by 2055 (HVAC capex compounding) — expect insurance premiums to compound above CPI over the hold.
Questions for the listing agent
- It's been on market 244 days. Have you received any prior offers? Is the seller open to a 12% concession, seller financing, or rate buy-down credit?
- Built in 1945 — when were the roof, HVAC, electrical panel, plumbing, and water heater last replaced?
- Why hasn't it sold? Are there any deal-killer items the seller is aware of (foundation, flood, title, zoning, code violations)?
- Is there a deadline driving the sale (1031 exchange, divorce, estate, relocation)? That informs how much negotiation room exists.
- Schools are D-rated, which usually means shorter tenancies and higher turnover. Who's the typical renter profile here, and what's been the actual vacancy rate?
- What's the average days-on-market for RENTAL listings here right now (not sales)? A rising rental-DOM trend means longer vacancies and softer asking-rent achievability than the comps imply.
- What's the recent tenant-quality profile in this submarket — average credit score on applications, eviction rate, late-payment / NSF rate, and stable-employment percentage? A property-management company in the area should have these aggregated.
- How much new for-sale + rental construction is in the pipeline within 1–3 miles? Heavy new supply typically softens prices + rents 12–24 months out; constrained supply supports both.
Investment metrics
- 1% rule
- 0.93% ✗
- Cap rate
- 7.96%
- Cash-on-cash
- 5.95%
- DSCR
- 1.26
- GRM
- 9.0
CMA / ARV
- ARV (median comp)
- $121,806
- List price
- $130,000
- Delta
- 6.73%
- Verdict
- FAIR
- Comps
- 20 within 1.0 mi
Show comp detail 10 sales within ~0.75 mi
| Address | Dist | Beds/Ba | Sqft | Sold | Price | $/sf | Match |
|---|---|---|---|---|---|---|---|
| 4809 29th St | 0.22mi | 2/1.0 | 1,286 (-2%) | 9mo | $113,000 | $88 | 80 |
| 2820 50th Ave | 0.35mi | 3/2.0 (+1) | 1,400 (+7%) | 1mo | $199,900 | $143 | 62 |
| 4812 30th 1/2 St | 0.29mi | 3/2.0 (+1) | 1,385 (+6%) | 13mo | $160,000 | $116 | 56 |
| 3001 50th Ave | 0.39mi | 3/2.0 (+1) | 1,352 (+4%) | 14mo | $145,000 | $107 | 55 |
| 3511 Bonita Dr | 0.65mi | 3/1.0 (+1) | 1,269 (-3%) | 8mo | $69,900 | $55 | 53 |
| 4588 31st St | 0.21mi | 3/2.0 (+1) | 1,200 (-8%) | 22mo | $150,000 | $125 | 49 |
| 2817 49th Ave | 0.31mi | 3/2.0 (+1) | 1,432 (+10%) | 16mo | $157,000 | $110 | 47 |
| 2007 45th Ave | 0.65mi | 3/2.0 (+1) | 1,421 (+9%) | 5mo | $167,000 | $118 | 42 |
| 2016 47th Ave | 0.61mi | 3/1.0 (+1) | 1,418 (+9%) | 18mo | $75,000 | $53 | 37 |
| 2007 46th Ave | 0.65mi | 3/2.0 (+1) | 1,150 (-12%) | 7mo | $139,500 | $121 | 35 |
Match score weights: distance 35% · size 25% · config 20% · recency 20%. Top-matched comps best support the ARV.
Projected returns pro-forma
-3.0% appreciation · 8.0% rent growth · sell at horizon
- IRR
- -2.3%
- Equity multiple
- 0.91×
- Total profit
- $-3,271
- Equity at exit
- $19,383
- IRR
- 11.8%
- Equity multiple
- 2.12×
- Total profit
- $40,662
- Equity at exit
- $11,240
Cash invested: $36,400 (down + closing). Projections, not guarantees.
Landlord ↔ Tenant lean methodology
- Overall (STATE)
- 90 Strongly Landlord-Friendly
- State Mississippi
- 90 Strongly Landlord-Friendly · R+11
- County
- — inherits STATE
- City
- — inherits STATE
ZIP-level market 39501
- Home prices YoY
- -34.5%
- Rents YoY
- 10.5%
- Active inventory
- 252
- Price-to-rent
- 9.0×
Monthly cashflow live
- Estimated rent
- $1,204 high interval (Pro) →
- Mortgage (P&I)
- −$682
- Tax from tax record
- −$35 /mo · $416/yr
- Insurance
- −$54
- HOA
- −$0
- Vacancy / Maint / Mgmt
- −$253
- Net cashflow
- $180
Break-even live
UW: 25.0% down · 7.5% · 30yr · 1.5% tax · 5.0% vac · 8.0% maint · 8.0% mgmt
Financing live
Cash to close
- Down payment
- $32,500
- Closing costs
- $3,900
- Reserves months
- —
- Total cash needed
- —
Loan-product check · same deal, 3 products live
Conventional
25% down · 7.5% · 30yr
- Down + closing
- —
- Monthly P&I
- —
- Monthly cashflow
- —
- DSCR
- —
- Eligible?
- —
Personal DTI + credit; lowest rate.
DSCR
20% down · 8.5% · 30yr
- Down + closing
- —
- Monthly P&I
- —
- Monthly cashflow
- —
- DSCR
- —
- Eligible?
- —
No personal income docs; deal must DSCR.
Hard money
10% down · 12.0% · 12mo
- Down + closing
- —
- Monthly P&I
- —
- Monthly cashflow
- —
- DSCR
- —
- Eligible?
- —
Short-term bridge; refi at stabilization.
Rent comps 11 comps
| Address | Beds | Baths | Sqft | Rent | $/sqft | DOM | Units | Dist |
|---|---|---|---|---|---|---|---|---|
| 3008 50th Ave Gulfport, MS | 3.0 | 2.0 | 1054 | $1,050 | $1.00 | 13d | 1 | 0.36mi |
| 2414 34th Ave Gulfport, MS | 2.0 | 1.0 | 912 | $1,125 | $1.23 | 21d | 1 | 0.83mi |
| 3712 37th Ave Gulfport, MS | 3.0 | 2.0 | 1144 | $1,175 | $1.03 | 13d | 1 | 0.87mi |
| 2986 58th Ave Gulfport, MS | 3.0 | 2.0 | 1153 | $1,295 | $1.12 | 13d | 1 | 0.90mi |
| 3625 Meadowlark Dr Gulfport, MS | 3.0 | 1.0 | 1315 | $1,200 | $0.91 | 13d | 1 | 1.06mi |
| 3633 Southward Dr Gulfport, MS | 2.0 | 2.0 | 900 | $1,000 | $1.11 | 43d | 1 | 1.18mi |
| 1513 34th Ave Gulfport, MS | 2.0 | 2.0 | 884 | $1,250 | $1.41 | 43d | 1 | 1.28mi |
| 1221 42nd Ave Gulfport, MS | 3.0 | 1.0 | 1000 | $1,400 | $1.40 | 43d | 1 | 1.29mi |
| 1412 Jo Ellen Cir Gulfport, MS | 3.0 | 1.5 | 1275 | $1,050 | $0.82 | 13d | 1 | 1.40mi |
| 2317 30th St Gulfport, MS | 2.0 | 1.0 | 1164 | $2,150 | $1.85 | 21d | 1 | 1.43mi |
| 1129 Woodward Ave Gulfport, MS | 3.0 | 1.0 | 1719 | $1,300 | $0.76 | 13d | 1 | 1.45mi |
Listing history 16 events
-
2026-06-18days on market $130,000 Active 244 DOM
-
2026-06-17days on market $130,000 Active 243 DOM
-
2026-06-16days on market $130,000 Active 242 DOM
-
2026-06-15days on market $130,000 Active 241 DOM
-
2026-06-14days on market $130,000 Active 239 DOM
-
2026-06-13days on market $130,000 Active 238 DOM
-
2026-06-10days on market $130,000 Active 236 DOM
-
2026-06-09days on market $130,000 Active 235 DOM
-
2026-06-08days on market $130,000 Active 234 DOM
-
2026-06-07days on market $130,000 Active 233 DOM
-
2026-06-05days on market $130,000 Active 230 DOM
-
2026-06-02days on market $130,000 Active 228 DOM
-
2026-06-01days on market $130,000 Active 227 DOM
-
2026-05-31days on market $130,000 Active 226 DOM
-
2026-05-30days on market $130,000 Active 225 DOM
-
2025-10-17$130,000 Active 483-char remark
Show marketing remark (483 chars)
Zoned Residential as well as B1 business, this property offers the chance to create something special. Conveniently located near the Seabee base, minutes to I-10 for an easy commute, and a short drive to the beach with NO FLOOD insurance required. This property sits on 3 parcels with a total of 10 lots (1.13 acres) offering a unique opportunity with plenty of room and potential for your next project. Being sold AS-IS - renovate, rebuild, or reimagine - the options are wide open!
ⓘ Source: listings_history table (triggers on properties + properties_extension) + one-shot
backfill from property_details.listing_events for pre-trigger history.
Tax reassessment forecast MS · Resets to sale price
- Current annual tax
- $416 · $35/mo
- Projected year-2 tax
- $1,027 · $86/mo
- Expected delta
- +$611/yr (+$51/mo · 146.6%)
ⓘ Screening estimate from a state-policy table — verify with the county assessor before closing.
Climate risk First Street
- Flood 1/10 Low FEMA zone X (unshaded) · 0% chance over 30 yrs
- Wildfire 3/10 Moderate
- Heat 10/10 Extreme 7 d/yr ≥106°F today · 23 d/yr by 30 yrs out
- Wind 9/10 Extreme 99% chance of damaging wind over 30 yrs
- Air quality 1/10 Low 0 unhealthy d/yr today · 0 by 30 yrs out
Nearby sold comps map
Loading sold comps map…
Walkable amenities ~0.75 mi
Loading nearby amenities…
Taxation est. · year 1
- Rental income
- $14,446
- − Mortgage interest
- −$7,282
- − Property taxes
- −$416
- − Insurance
- −$650
- − Repairs & maintenance
- −$1,156
- − Management
- −$1,156
- − Depreciation
- −$3,782
- Taxable income
- $5
- Est. tax owed @ 24.0%
- −$1
- After-tax cash flow
- $2,164/yr
For passive investors: Depreciation is non-cash, so a rental often shows a tax loss while cash-flowing — sheltering income. Rental losses are passive: they offset passive income freely, and up to $25,000/yr can offset ordinary (W-2) income if you actively participate and your MAGI is under $100k (phasing out to $0 by $150k); unused losses carry forward. On sale, claimed depreciation is recaptured at up to 25%, and gains may owe capital-gains tax (a 1031 exchange can defer both). Figures are a year-1 estimate at your 24.0% rate — not tax advice; consult a CPA.
Schools (NCES district)
- District
- Gulfport School District
- NCES district ID
- 2801710
- Math proficiency
- 41% ▼ -15.00%
- Reading proficiency
- 42% ▼ -6.00%
- Median HH income
- $35,712
- Composite
- 34.38/100
- National rank
- #5213
- State rank
- #37 of 130 in MS
Livability — Gulfport
- Score
- 73/100
- State rank
- #15
- US rank
- #5010
Category grades
Schools grade is shown separately in the Schools card above.
Census & demographics
- Census place
- Gulfport, MS
- County
- Harrison County · 178,171 people
- City population
- 96,188
- Metro
- Gulfport-Biloxi, MS
- Population (ZIP)
- 22,565
- Household income
- $34,758
- Rent vs Own
- Severe rent burden
- 1516.0
Population outlook (Harrison County) Hauer SSP2
- Today (2025)
- 228,444 people
- By 2030
- 241,942 · +5.9%
- By 2040
- 267,531 · +17.1%
- By 2050
- 291,062 · +27.4%
- By 2075
- 346,711 · +51.8%
- By 2100
- 378,165 · +65.5%
Race, ethnicity, and origin ACS 2023
- Neighborhood character
- Diverse neighborhood (Simpson 0.56)
- Race & ethnicity
- Black 59% White 29% Two or more races 7% Hispanic / Latino 5%
- Hispanic origin (detail)
- Mexican 2%
- Common ancestry
- Lithuanian 2% Serbian 1% Slovak 1%
- Foreign-born
- 2% · Canada
- Languages at home
- 95% English-only · Spanish 4%
Political lean MEDSL · Harrison
- 2024 margin
- Strong R (+28.9) · D 35.0% · R 63.9% · Other 1.1%
- 2008→2024 swing
- -2.9pp toward R · 2008: -26.0pp · 2024: -28.9pp
- All cycles
- 2024: R+28.9 2020: R+25.2 2016: R+30.7 2012: R+26.6 2008: R+26.0
Not yet ingested
- Civics
- —
Market trends
- HPI YoY
- ▼ -110.16%
- Current HPI
- 208.998
- Rent YoY
- ▲ 10.49%
- Metro
- Gulfport-Biloxi, MS
- State GDP YoY
- —
- F500 in state
- 0
Price history
1 event — show timeline
- 2025-10-17 Listed $130,000 MLSU
Property tax history
+0.5%/yrLatest (2020): $416 · +0.0% YoY. Source: county tax records.
Cash-flow waterfall
monthlySold comps — $/sqft
last 12 mo · ≤1 miLoading sold comps…