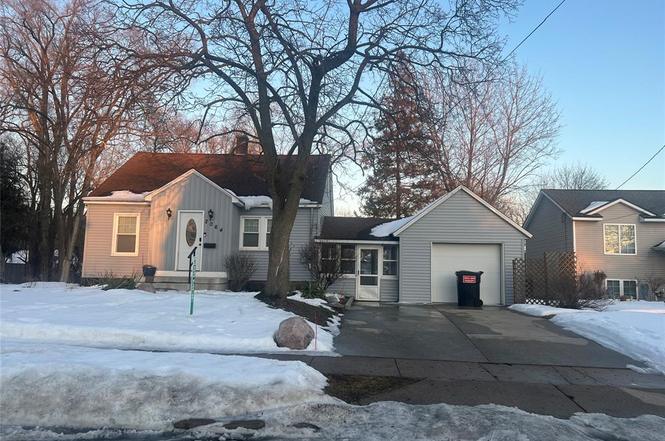
2064 Wyoming Ave SW · Wyoming, MI
Flood risk 1/10 · Minimal
- FEMA flood zone
- X (unshaded)
- Chance of flooding over 30 yrs
- 0.0%
- Est. flood insurance / yr
- $473 – $860
Fire risk 1/10 · Minimal
- Est. fire insurance / yr
- $784 – $1,456
Heat risk 2/10 · Minimal
- Hot days now (above 97°F)
- 7 days/yr
- Hot days in 30 yrs
- 16 days/yr
Wind risk 2/10 · Minimal
- Chance of severe wind over 30 yrs
- —
Air-quality risk 2/10 · Minimal
- Unhealthy air days now
- 2 days/yr
- Unhealthy air days in 30 yrs
- 2 days/yr
Risk factors via First Street. Map © Google.
Why this score? — see what drove the D+ grade
The composite is a weighted blend of 9 inputs, each scored 0–100. Each bar is that input's sub-score; the figure is the points it added to the 100-point composite (weight × sub-score).
- ARV discount +15.0/15.0
- Cash flow +13.5/30.0
- Rent growth +5.0/5.0
- DSCR +4.1/10.0
- Livability +3.9/5.0
- 1% rule +3.4/10.0
- Condition / age +2.5/5.0
- Schools +2.4/10.0
- Appreciation +0.0/10.0
$174,900
🖨 Deal sheet (PDF) 📄 Offer letter ✓ Due diligence
Listing remarks MLS
This bungalow has a nice touch with the attached garage, large lot, and full basement. This home is in need of a little love inside and is priced accordingly. Offers will be presented in order of receipt. Home being sold "As-Is"
Key facts
- 8,276 sq ft lot
- Garage
- Built 1940
Neighborhood map
What this means for you Summary
Snapshot
- This is a 3-bed/1.0-bath single-family listed at $175k.
Deal economics
- At list price, monthly cash flow is $7 ($88/yr) — positive.
- The deal already cash-flows at list — no discount required.
- To meet the 1% rule (rent ≥ 1% of price), the offer needs to be $147k (16.1% below list).
- Recommended offer: $147k (16.1% below list) — sets the bar for 1% rule.
- Cap rate 6.3% vs local median 3.8% in Wyoming — top-decile yield for the area; either an underpriced asset or a hidden risk that comps aren't pricing in. Stress-test before assuming the spread holds.
Location & tenants
- Location reads 77/100 on livability (#126 in MI, #3,095 nationally) — a middle-class / working-renter tenant base. Strengths: cost of living A+, housing A+, health & safety A+; Watch: schools D+, crime D-, amenities F.
- Wyoming Public Schools (urban): math 16% / reading 39% proficiency, ranked #394 of 540 in MI (top 73%) — low school quality limits family demand, transient renter base, plan for 1-2y turnover; 64% free/reduced lunch — lower-income household profile, screen leases tightly.
- Market conditions: Rents rising fast (+10.5%/yr); 94 active listings in the ZIP; 15 comparable units currently listed for rent nearby; rentals at typical pace (median 16d on market — plan ~3-4 weeks tenant-placement turnaround); 2,253 units permitted in Kent County in 2024 (969 in 5+ unit buildings).
Forward outlook
- Local home prices are declining (-3.0%/yr); year-one equity from $1k of loan paydown is wiped out by about $5k of value loss. Plan a longer hold.
- Kent County population projected at +22% by 2050 — long-run rental-demand tailwind backs the buy-and-hold thesis.
Negotiation context
- Only 9 days on market — expect competitive offers; lowballing is unlikely to land.
- 2 sale attempts with the ask held roughly flat each time — persistent listings suggest the price (not the market) is what's stuck; bring a comps-based counter.
Risks & watch-outs
- Watch-outs: built in 1940 — expect roof / HVAC / electrical / plumbing capex.
Questions for the listing agent
- Built in 1940 — when were the roof, HVAC, electrical panel, plumbing, and water heater last replaced?
- Is there a deadline driving the sale (1031 exchange, divorce, estate, relocation)? That informs how much negotiation room exists.
- Schools are D-rated, which usually means shorter tenancies and higher turnover. Who's the typical renter profile here, and what's been the actual vacancy rate?
- Crime grade is D in this area — have there been break-ins, vandalism, or insurance claims at this property in the last 3 years? What carrier currently insures it and at what premium?
- The area grade is low — what's the realistic commute time and amenity access for the typical tenant pool here? Any planned neighborhood developments (good or bad) we should know about?
- What's the average days-on-market for RENTAL listings here right now (not sales)? A rising rental-DOM trend means longer vacancies and softer asking-rent achievability than the comps imply.
- What's the recent tenant-quality profile in this submarket — average credit score on applications, eviction rate, late-payment / NSF rate, and stable-employment percentage? A property-management company in the area should have these aggregated.
- How much new for-sale + rental construction is in the pipeline within 1–3 miles? Heavy new supply typically softens prices + rents 12–24 months out; constrained supply supports both.
Investment metrics
- 1% rule
- 0.84% ✗
- Cap rate
- 6.34%
- Cash-on-cash
- 0.18%
- DSCR
- 1.01
- GRM
- 9.9
CMA / ARV
- ARV (on-the-fly)
- $227,022
- Comps found
- 9
Show comp detail 9 sales within ~0.75 mi
| Address | Dist | Beds/Ba | Sqft | Sold | Price | $/sf | Match |
|---|---|---|---|---|---|---|---|
| 2033 Wyoming Ave SW | 0.05mi | 3/1.0 | 1,042 (+11%) | 11mo | $235,000 | $226 | 70 |
| 2461 Wyoming Ave SW | 0.51mi | 3/1.0 | 970 (+3%) | 4mo | $246,900 | $255 | 68 |
| 2043 Melvin St SW | 0.25mi | 2/2.0 (-1) | 1,020 (+8%) | 4mo | $280,000 | $275 | 62 |
| 2224 Berwyn Ave SW | 0.47mi | 4/2.0 (+1) | 912 (-3%) | 4mo | $285,000 | $313 | 60 |
| 2148 Avon Ave SW | 0.30mi | 2/1.0 (-1) | 876 (-7%) | 14mo | $201,000 | $229 | 57 |
| 2412 Taft Ave SW | 0.67mi | 3/1.0 | 990 (+5%) | 6mo | $208,000 | $210 | 55 |
| 2304 Camden Ave SW | 0.57mi | 2/1.0 (-1) | 1,036 (+10%) | 2mo | $232,000 | $224 | 50 |
| 2446 Lamar Ave SW | 0.61mi | 2/1.0 (-1) | 864 (-8%) | 14mo | $231,500 | $268 | 41 |
| 2432 Taft Ave SW | 0.70mi | 3/2.0 | 1,020 (+8%) | 22mo | $245,900 | $241 | 31 |
Match score weights: distance 35% · size 25% · config 20% · recency 20%. Top-matched comps best support the ARV.
Projected returns pro-forma
-3.0% appreciation · 8.0% rent growth · sell at horizon
- IRR
- -10.8%
- Equity multiple
- 0.59×
- Total profit
- $-20,129
- Equity at exit
- $26,078
- IRR
- 4.2%
- Equity multiple
- 1.37×
- Total profit
- $18,326
- Equity at exit
- $15,122
Cash invested: $48,972 (down + closing). Projections, not guarantees.
Landlord ↔ Tenant lean methodology
- Overall (STATE)
- 62 Landlord-Friendly
- State Michigan
- 62 Landlord-Friendly · EVEN
- County
- — inherits STATE
- City
- — inherits STATE
ZIP-level market 49519
- Rents YoY
- 10.5%
- Active inventory
- 94
- Price-to-rent
- 9.9×
Monthly cashflow live
- Estimated rent
- $1,468 high interval (Pro) →
- Mortgage (P&I)
- −$917
- Tax from tax record
- −$162 /mo · $1,945/yr
- Insurance
- −$73
- HOA
- −$0
- Vacancy / Maint / Mgmt
- −$308
- Net cashflow
- $7
Break-even live
Sensitivity live
| Price | -10% $106 | -5% $57 | +0% $7 | +5% $-42 | +10% $-92 |
|---|---|---|---|---|---|
| Rent | -10% $-109 | -5% $-51 | +0% $7 | +5% $65 | +10% $123 |
| Rate | -1.0pp $95 | -0.5pp $52 | base $7 | +0.5pp $-38 | +1.0pp $-84 |
UW: 25.0% down · 7.5% · 30yr · 1.5% tax · 5.0% vac · 8.0% maint · 8.0% mgmt
Financing live
Cash to close
- Down payment
- $43,725
- Closing costs
- $5,247
- Reserves months
- —
- Total cash needed
- —
Loan-product check · same deal, 3 products live
Conventional
25% down · 7.5% · 30yr
- Down + closing
- —
- Monthly P&I
- —
- Monthly cashflow
- —
- DSCR
- —
- Eligible?
- —
Personal DTI + credit; lowest rate.
DSCR
20% down · 8.5% · 30yr
- Down + closing
- —
- Monthly P&I
- —
- Monthly cashflow
- —
- DSCR
- —
- Eligible?
- —
No personal income docs; deal must DSCR.
Hard money
10% down · 12.0% · 12mo
- Down + closing
- —
- Monthly P&I
- —
- Monthly cashflow
- —
- DSCR
- —
- Eligible?
- —
Short-term bridge; refi at stabilization.
Rent comps 15 comps
| Address | Beds | Baths | Sqft | Rent | $/sqft | DOM | Units | Dist |
|---|---|---|---|---|---|---|---|---|
| 2986 Chicago Dr SW Grandville, MI | 2.0 | 1.0 | 850 | $1,250 | $1.47 | 15d | 1 | 0.96mi |
| 2235 29th St SW Apt 1 Wyoming, MI | 2.0 | 1.0 | 796 | $1,250 | $1.57 | 45d | 1 | 1.02mi |
| 2227 29th St SW Apt 3 Wyoming, MI | 2.0 | 1.0 | 796 | $1,250 | $1.57 | 45d | 1 | 1.02mi |
| 2855 Taft Ave SW #5 Grand Rapids, MI | 2.0 | 1.5 | 1100 | $1,250 | $1.14 | 24d | 1 | 1.09mi |
| 2855 Taft Ave SW Apt 12 Grand Rapids, MI | 2.0 | 1.5 | 1100 | $1,400 | $1.27 | 4d | 1 | 1.09mi |
| 2329 30th St SW Unit 2323 Wyoming, MI | 2.0 | 1.0 | 850 | $1,325 | $1.56 | 45d | 1 | 1.11mi |
| 2860 Taft Ave SW Apt 3 Wyoming, MI | 2.0 | 1.5 | 800 | $1,325 | $1.66 | 15d | 1 | 1.12mi |
| 2860 Taft Ave SW Apt 14 Wyoming, MI | 2.0 | 1.5 | 800 | $1,325 | $1.66 | 4d | 1 | 1.12mi |
| 2365 30th St SW Unit 2320 Wyoming, MI | 2.0 | 1.0 | 837 | $1,365 | $1.63 | 11d | 1 | 1.13mi |
| 2875 Taft Ave SW Unit 4 Wyoming, MI | 2.0 | 1.5 | 800 | $1,400 | $1.75 | 15d | 1 | 1.14mi |
| 2875 Taft Ave SW Unit 8 Wyoming, MI | 2.0 | 1.5 | 800 | $1,400 | $1.75 | 4d | 1 | 1.14mi |
| 3100 Waterchase Way SW Wyoming, MI | 1.0–3.0 | 1.0–2.0 | 836 | $2,305 | $2.76 | 4d | 35 | 1.26mi |
| 2935 Oak Valley Ave SW Wyoming, MI | 1.0–2.0 | 1.0 | 695 | $1,250 | $1.80 | 11d | 10 | 1.29mi |
| 2931 Burlingame Ave SW Wyoming, MI | 1.0–2.0 | 1.0 | 800 | $1,380 | $1.73 | 4d | 1 | 1.37mi |
| 2340 Michael Ave SW Unit 2280 4 Wyoming, MI | 2.0 | 1.0 | 900 | $1,200 | $1.33 | 20d | 1 | 1.43mi |
Listing history 4 events
-
2026-03-11status Pending 238-char remark
Show marketing remark (238 chars)
This bungalow has a nice touch with the attached garage, large lot, and full basement. This home is in need of a little love inside and is priced accordingly. Offers will be presented in order of receipt. Home being sold "As-Is"
-
2026-03-11status Pending
Show marketing remark (238 chars)
This bungalow has a nice touch with the attached garage, large lot, and full basement. This home is in need of a little love inside and is priced accordingly. Offers will be presented in order of receipt. Home being sold "As-Is"
-
2026-03-03$174,900 Active
-
2026-03-02$174,900 Active 238-char remark
Show marketing remark (238 chars)
This bungalow has a nice touch with the attached garage, large lot, and full basement. This home is in need of a little love inside and is priced accordingly. Offers will be presented in order of receipt. Home being sold "As-Is"
ⓘ Source: listings_history table (triggers on properties + properties_extension) + one-shot
backfill from property_details.listing_events for pre-trigger history.
Tax reassessment forecast MI · Partial reset (capped growth)
- Current annual tax
- $1,945 · $162/mo
- Projected year-2 tax
- $2,319 · $193/mo
- Expected delta
- +$374/yr (+$31/mo · 19.3%)
ⓘ Screening estimate from a state-policy table — verify with the county assessor before closing.
Climate risk First Street
- Flood 1/10 Low FEMA zone X (unshaded) · 0% chance over 30 yrs
- Wildfire 1/10 Low
- Heat 2/10 Low 7 d/yr ≥97°F today · 16 d/yr by 30 yrs out
- Wind 2/10 Low
- Air quality 2/10 Low 2 unhealthy d/yr today · 2 by 30 yrs out
Nearby sold comps map
Loading sold comps map…
Walkable amenities ~0.75 mi
Loading nearby amenities…
Taxation est. · year 1
- Rental income
- $17,612
- − Mortgage interest
- −$9,797
- − Property taxes
- −$1,945
- − Insurance
- −$874
- − Repairs & maintenance
- −$1,409
- − Management
- −$1,409
- − Depreciation
- −$5,088
- Taxable loss
- −$2,910
- Est. tax savings @ 24.0%
- +$698
- After-tax cash flow
- $787/yr
For passive investors: Depreciation is non-cash, so a rental often shows a tax loss while cash-flowing — sheltering income. Rental losses are passive: they offset passive income freely, and up to $25,000/yr can offset ordinary (W-2) income if you actively participate and your MAGI is under $100k (phasing out to $0 by $150k); unused losses carry forward. On sale, claimed depreciation is recaptured at up to 25%, and gains may owe capital-gains tax (a 1031 exchange can defer both). Figures are a year-1 estimate at your 24.0% rate — not tax advice; consult a CPA.
Schools (NCES district)
- District
- Wyoming Public Schools
- NCES district ID
- 2636570
- Math proficiency
- 16% ▼ -8.00%
- Reading proficiency
- 39% ▲ 4.00%
- Median HH income
- $46,299
- Composite
- 23.69/100
- National rank
- #7835
- State rank
- #394 of 540 in MI
Livability — Wyoming
- Score
- 77/100
- State rank
- #126
- US rank
- #3095
Category grades
Schools grade is shown separately in the Schools card above.
Census & demographics
- Census place
- Wyoming, MI
- County
- Kent County · 533,805 people
- City population
- 56,117
- Metro
- Grand Rapids-Kentwood, MI
- Population (ZIP)
- 27,965
- Household income
- $73,762
- Rent vs Own
- Severe rent burden
- 847.0
Population outlook (Kent County) Hauer SSP2
- Today (2025)
- 712,484 people
- By 2030
- 748,618 · +5.1%
- By 2040
- 814,777 · +14.4%
- By 2050
- 868,556 · +21.9%
- By 2075
- 966,487 · +35.7%
- By 2100
- 967,975 · +35.9%
Race, ethnicity, and origin ACS 2023
- Neighborhood character
- Predominantly White (66%)
- Race & ethnicity
- White 66% Hispanic / Latino 18% Two or more races 14% Black 9% Asian 2%
- Hispanic origin (detail)
- Mexican 13% Puerto Rican 2%
- Common ancestry
- Iranian 18% Romanian 5% Slovak 2%
- Foreign-born
- 8% · Canada
- Languages at home
- 85% English-only · Spanish 12% Other Indo-European 1%
Political lean MEDSL · Kent
- 2024 margin
- Lean D (+5.4) · D 51.8% · R 46.5% · Other 1.7%
- 2008→2024 swing
- +4.8pp toward D · 2008: 0.5pp · 2024: 5.4pp
- All cycles
- 2024: D+5.4 2020: D+6.1 2016: R+3.1 2012: R+7.9 2008: D+0.5
Not yet ingested
- Civics
- —
Market trends
- HPI YoY
- ▼ -244.17%
- Current HPI
- 274.6556
- Rent YoY
- ▲ 10.46%
- Metro
- Grand Rapids-Kentwood, MI
- State GDP YoY
- ▲ 1.37%
- F500 in state
- 28
Industry mix (Fortune 500 HQ in MI)
| Industry | F500 HQs | Revenue |
|---|---|---|
| Automotive Parts | 3 | $48B |
|
||
| Automotive | 2 | $372B |
|
||
| Chemicals | 1 | $45B |
|
||
| Automotive Retail | 1 | $29B |
|
||
| Healthcare / Medical Devices | 1 | $23B |
|
||
| Automotive Technology | 1 | $20B |
|
||
Price history
+0.0% since first listed4 events — show timeline
- 2026-03-11 Pending — MiRealSource-MiMLS
- 2026-03-11 Pending — REALCOMP
- 2026-03-03 Listed $174,900 REALCOMP
- 2026-03-02 Listed $174,900 MiRealSource-MiMLS
Property tax history
+2.0%/yrLatest (2025): $1,945 · -5.1% YoY. Source: county tax records.
Cash-flow waterfall
monthlySold comps — $/sqft
last 12 mo · ≤1 miLoading sold comps…