 Multi-family
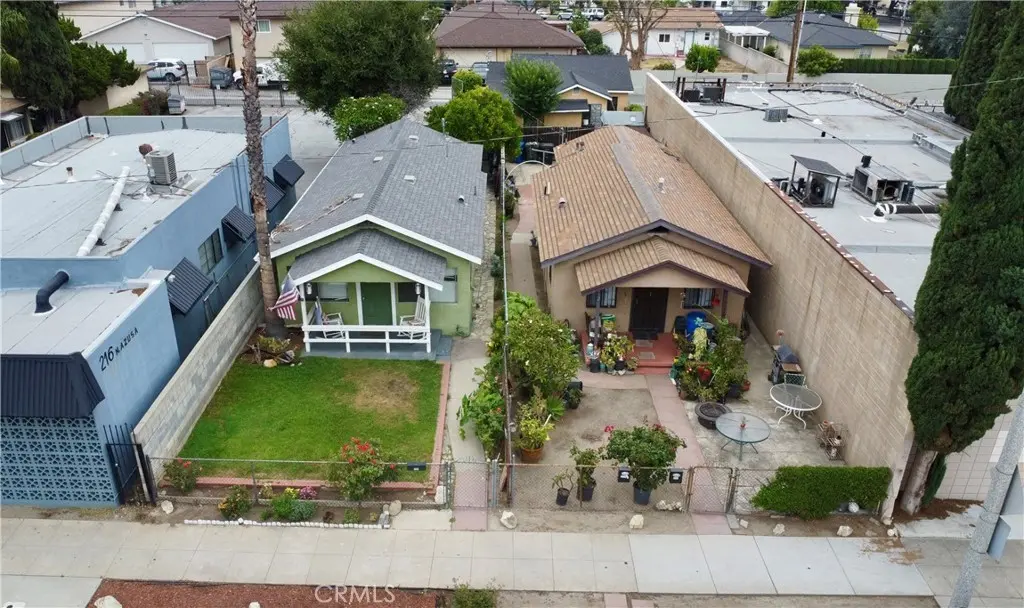
212 N Azusa · Azusa, CA
Flood risk 1/10 · Minimal
- FEMA flood zone
- X (unshaded)
- Chance of flooding over 30 yrs
- 0.0%
- Est. flood insurance / yr
- $507 – $1,088
Fire risk 1/10 · Minimal
- Est. fire insurance / yr
- $659 – $1,223
Heat risk 7/10 · Major
- Hot days now (above 99°F)
- 7 days/yr
- Hot days in 30 yrs
- 19 days/yr
Wind risk 1/10 · Minimal
- Chance of severe wind over 30 yrs
- —
Air-quality risk 7/10 · Major
- Unhealthy air days now
- 15 days/yr
- Unhealthy air days in 30 yrs
- 17 days/yr
Risk factors via First Street. Map © Google.
Why this score? — see what drove the D grade
The composite is a weighted blend of 9 inputs, each scored 0–100. Each bar is that input's sub-score; the figure is the points it added to the 100-point composite (weight × sub-score).
- Cash flow +14.0/30.0
- ARV discount +7.5/15.0
- DSCR +4.2/10.0
- Rent growth +3.8/5.0
- Schools +3.3/10.0
- Livability +3.2/5.0
- 1% rule +3.0/10.0
- Condition / age +2.5/5.0
- Appreciation +0.0/10.0
$875,000
🖨 Deal sheet 📄 Offer letter ✓ Due diligence
Multi-family units
County records classify this as Multi-Family (2-4 Unit). Listing-text estimate: 1 unit. estimate disagrees with records
Listing remarks
Prime north Azusa Rental Opportunity! Featuring 3 separate two-Bedrooms each unit, separately metered for gas and electricity, property sits on a large 6,983 sqft lot. Ideal for Investor seeking rental income, Owner occupy one and collect supplemental rental income from the other 2 units or if you're looking to complete a 1031 exchange. Walking distance to prime City of Azusa Civic Center corridor restaurants & shops, Target and Historic Route 66. Close to Azusa Metro Station, easy access to 210 & 57 fwys.
Key facts
- Easy access to fwys
- Large lot
- Rental opportunity
Tags
Property features AI
Finance
- Other: Property consists of 3 buildings and 3 total units
- Financial info: Rent control applies; Gross scheduled income reported around $4,500; At least one unit showing actual rent of $4,450; total of 3 units
- HOA & community:
Exterior
- Parking: No designated parking
- Security:
- Utilities: Public water (district); Sewer or septic (unknown); Separate gas meters: 3; Separate electric meters: 3; Separate water meters: 1
- Home design: Single-story building; No accessory dwelling unit (ADU)
- Construction: Year built per assessor; Total building area 1,918 (building-level data present)
- Exterior features: No pool; Front yard
Interior
- Kitchen:
- Bedrooms: Unit example: 2 bedrooms (unit-level data present)
- Flooring:
- Bathrooms: Unit example: 1 full bathroom (unit-level data present)
- Heating & cooling: Wall heater
- Interior features: Entry on the main level; No common walls (detached units); Sidewalks in the community
- Laundry & utility: Laundry inside the unit
Neighborhood map
What this means for you Summary
Snapshot
- This is a 1-bed/1.0-bath multifamily listed at $875k.
Deal economics
- At list price, monthly cash flow is $111 ($1k/yr) — positive.
- The deal already cash-flows at list — no discount required.
- To meet the 1% rule (rent ≥ 1% of price), the offer needs to be $701k (19.9% below list).
- Recommended offer: $701k (19.9% below list) — sets the bar for 1% rule.
- Cap rate 6.4% vs local median 2.6% in Azusa — top-decile yield for the area; either an underpriced asset or a hidden risk that comps aren't pricing in. Stress-test before assuming the spread holds.
Location & tenants
- Location reads 65/100 on livability (#367 in CA) — a middle-class / working-renter tenant base. Strengths: commute A+, employment B; Watch: schools D-, amenities D-, cost of living F.
- Azusa Unified (suburban): math 30% / reading 39% proficiency, ranked #874 of 1,400 in CA (top 62%) — families likely to look elsewhere, expect single-tenant / working-renter base with shorter leases; 70% free/reduced lunch — lower-income household profile, screen leases tightly.
- Market conditions: Rents rising fast (+5.4%/yr); 96 active listings in the ZIP; 25 comparable units currently listed for rent nearby; rentals at typical pace (median 15d on market — plan ~3-4 weeks tenant-placement turnaround); solid renter incomes; 19,697 units permitted in Los Angeles County in 2024 (9,426 in 5+ unit buildings).
- At $7,013/mo this rent would consume 91% of the median local household income ($93k/yr) (locally 1631% of renters already pay >50% of income on rent) — very limited rent-growth headroom before tenants either downsize or default.
Forward outlook
- Local home prices are declining (-3.0%/yr); year-one equity from $6k of loan paydown is wiped out by about $26k of value loss. Plan a longer hold.
- Los Angeles County population projected at +9% by 2050 — modest demand growth; plan on rents tracking national, not racing it.
Negotiation context
- It's been on market 18 days — a 2% lower offer ($862k) is reasonable based on typical stale-listing flexibility.
Risks & watch-outs
- Watch-outs: built in 1925 — expect roof / HVAC / electrical / plumbing capex.
- Climate carrying-cost: extreme-heat days projected 7→19/yr by 2055 (HVAC capex compounding) — expect insurance premiums to compound above CPI over the hold.
Questions for the listing agent
- Built in 1925 — when were the roof, HVAC, electrical panel, plumbing, and water heater last replaced?
- Is there a deadline driving the sale (1031 exchange, divorce, estate, relocation)? That informs how much negotiation room exists.
- Schools are D-rated, which usually means shorter tenancies and higher turnover. Who's the typical renter profile here, and what's been the actual vacancy rate?
- The area grade is low — what's the realistic commute time and amenity access for the typical tenant pool here? Any planned neighborhood developments (good or bad) we should know about?
- What's the average days-on-market for RENTAL listings here right now (not sales)? A rising rental-DOM trend means longer vacancies and softer asking-rent achievability than the comps imply.
- What's the recent tenant-quality profile in this submarket — average credit score on applications, eviction rate, late-payment / NSF rate, and stable-employment percentage? A property-management company in the area should have these aggregated.
- How much new apartment / multifamily construction is in the pipeline within 1–3 miles? Heavy new supply (>2% of stock underway) typically softens rents 12–24 months out; light construction supports rent growth.
Investment metrics
- 1% rule
- 0.80% ✗
- Cap rate
- 6.45%
- Cash-on-cash
- 0.54%
- DSCR
- 1.02
- GRM
- 10.4
CMA / ARV
No comps found within radius.
Projected returns pro-forma
-3.0% appreciation · 5.38% rent growth · sell at horizon
- IRR
- -13.1%
- Equity multiple
- 0.52×
- Total profit
- $-117,802
- Equity at exit
- $130,465
- IRR
- -1.1%
- Equity multiple
- 0.92×
- Total profit
- $-20,517
- Equity at exit
- $75,654
Cash invested: $245,000 (down + closing). Projections, not guarantees.
Landlord ↔ Tenant lean methodology
- Overall (STATE)
- 18 Strongly Tenant-Friendly
- State California
- 18 Strongly Tenant-Friendly · D+13
- County
- — inherits STATE
- City
- — inherits STATE
ZIP-level market 91702
- Rents YoY
- 5.4%
- Active inventory
- 96
- Price-to-rent
- 31.2×
Monthly cashflow live
- Estimated rent
- $7,013 high interval (Pro) →
- Mortgage (P&I)
- −$4,589
- Tax from tax record
- −$476 /mo · $5,714/yr
- Insurance
- −$365
- HOA
- −$0
- Vacancy / Maint / Mgmt
- −$1,473
- Net cashflow
- $111
Break-even live
3-unit breakdown (identical units grouped — click to expand)
| Units | Beds | Baths | Est. rent |
|---|---|---|---|
| 3× units | 2 | 1 | $7,014 |
| #1 | 2 | 1 | $2,338 |
| #2 | 2 | 1 | $2,338 |
| #3 | 2 | 1 | $2,338 |
| Total (3 units) | $7,013 | ||
UW: 25.0% down · 7.5% · 30yr · 1.5% tax · 5.0% vac · 8.0% maint · 8.0% mgmt
Financing live
Cash to close
- Down payment
- $218,750
- Closing costs
- $26,250
- Reserves months
- —
- Total cash needed
- —
Loan-product check · same deal, 3 products live
Conventional
25% down · 7.5% · 30yr
- Down + closing
- —
- Monthly P&I
- —
- Monthly cashflow
- —
- DSCR
- —
- Eligible?
- —
Personal DTI + credit; lowest rate.
DSCR
20% down · 8.5% · 30yr
- Down + closing
- —
- Monthly P&I
- —
- Monthly cashflow
- —
- DSCR
- —
- Eligible?
- —
No personal income docs; deal must DSCR.
Hard money
10% down · 12.0% · 12mo
- Down + closing
- —
- Monthly P&I
- —
- Monthly cashflow
- —
- DSCR
- —
- Eligible?
- —
Short-term bridge; refi at stabilization.
Rent comps 25 comps
| Address | Beds | Baths | Sqft | Rent | $/sqft | DOM | Units | Dist |
|---|---|---|---|---|---|---|---|---|
| 236 N San Gabriel Ave Unit 14 Azusa, CA | 2.0 | 1.0 | 710 | $2,100 | $2.96 | 43d | 1 | 0.10mi |
| 236 N San Gabriel Ave Unit 8 Azusa, CA | 2.0 | 1.0 | 588 | $2,200 | $3.74 | 43d | 1 | 0.10mi |
| 236 N San Gabriel Ave Unit 8 Azusa, CA | 2.0 | 1.0 | 600 | $2,100 | $3.50 | 24d | 1 | 0.10mi |
| 469 W 2nd St Azusa, CA | 1.0 | 1.0 | 500 | $1,500 | $3.00 | 43d | 1 | 0.32mi |
| 450 N Soldano Ave Azusa, CA | 1.0 | 1.0 | 552 | $1,695 | $3.07 | 15d | 7 | 0.35mi |
| 545 N Soldano Ave Azusa, CA | 1.0 | 1.0 | 536 | $2,200 | $4.10 | 24d | 1 | 0.48mi |
| 626 N Azusa Ave Azusa, CA | 1.0–3.0 | 1.0–2.0 | 1095 | $2,632 | $2.40 | 1d | 6 | 0.52mi |
| 909 W 1st St Azusa, CA | 2.0–4.0 | 2.0–2.5 | 1143 | $3,275 | $2.87 | 1d | 5 | 0.67mi |
| 850 N Azusa Ave Azusa, CA | 1.0–3.0 | 1.0–2.0 | 984 | $2,299 | $2.34 | 1d | 34 | 0.81mi |
| 601 E 8th St Azusa, CA | 1.0–4.0 | 1.0–2.0 | 880 | $2,050 | $2.33 | 7d | 3 | 0.83mi |
| 506 E 9th St Azusa, CA | 1.0 | 1.0 | 624 | $1,995 | $3.20 | 19d | 1 | 0.87mi |
| 933 N Alameda Ave Unit 6 Azusa, CA | 2.0 | 1.0 | 736 | $2,100 | $2.85 | 43d | 1 | 0.93mi |
| 801 E Alosta Ave Azusa, CA | 1.0–2.0 | 1.0–2.0 | 783 | $1,949 | $2.49 | 1d | 30 | 0.95mi |
| 1015 N Azusa Ave Unit 06 Azusa, CA | — | 1.0 | 390 | $1,500 | $3.85 | 43d | 1 | 1.02mi |
| 273 W Arrow Hwy Azusa, CA | 2.0 | 1.0–2.0 | 725 | $2,122 | $2.93 | 5d | 4 | 1.24mi |
| 565 E Arrow Hwy Azusa, CA | — | 1.0 | 444 | $1,550 | $3.49 | 7d | 1 | 1.25mi |
| 1000 E Alosta Ave Azusa, CA | 1.0–2.0 | 1.0 | 755 | $1,966 | $2.60 | 2d | 5 | 1.27mi |
| 1130 E Alosta Ave Azusa, CA | 1.0–2.0 | 1.0 | 907 | $2,050 | $2.26 | 2d | 2 | 1.28mi |
| 1311 N Azusa Ave Azusa, CA | 1.0–2.0 | 1.0 | 745 | $1,975 | $2.65 | 43d | 3 | 1.37mi |
| 1160 E Alosta Ave Azusa, CA | 1.0 | 1.0 | 600 | $1,800 | $3.00 | 12d | 1 | 1.39mi |
| 1160 E Alosta Ave Unit 32 Azusa, CA | 1.0 | 1.0 | 600 | $1,785 | $2.98 | 43d | 1 | 1.39mi |
| 1160 E Alosta Ave Unit 23 Azusa, CA | 1.0 | 1.0 | 600 | $1,800 | $3.00 | 22d | 1 | 1.39mi |
| 1345 N San Gabriel Ave Azusa, CA | 1.0 | 1.0 | 750 | $1,975 | $2.63 | 13d | 1 | 1.45mi |
| 777 S Citrus Ave Azusa, CA | 1.0 | 1.0 | 709 | $2,200 | $3.10 | 12d | 1 | 1.47mi |
| 1151 W Arrow Hwy Azusa, CA | 1.0–2.0 | 1.0–2.0 | 862 | $1,895 | $2.20 | 43d | 1 | 1.49mi |
Listing history 12 events
-
2026-06-18days on market $875,000 Active 18 DOM
-
2026-06-17days on market $875,000 Active 17 DOM
-
2026-06-16days on market $875,000 Active 16 DOM
-
2026-06-15days on market $875,000 Active 15 DOM
-
2026-06-13days on market $875,000 Active 13 DOM
-
2026-06-13days on market $875,000 Active 12 DOM
-
2026-06-04days on market $875,000 Active 8 DOM
-
2026-06-03days on market $875,000 Active 7 DOM
-
2026-06-02days on market $875,000 Active 6 DOM
-
2026-06-01days on market $875,000 Active 5 DOM
-
2026-05-31days on market $875,000 Active 4 DOM
-
2026-05-27$875,000 Active
ⓘ Source: listings_history table (triggers on properties + properties_extension) + one-shot
backfill from property_details.listing_events for pre-trigger history.
Tax reassessment forecast CA · Resets to sale price
- Current annual tax
- $5,714 · $476/mo
- Projected year-2 tax
- $6,650 · $554/mo
- Expected delta
- +$936/yr (+$78/mo · 16.4%)
ⓘ Screening estimate from a state-policy table — verify with the county assessor before closing.
Climate risk First Street
- Flood 1/10 Low FEMA zone X (unshaded) · 0% chance over 30 yrs
- Wildfire 1/10 Low
- Heat 7/10 Severe 7 d/yr ≥99°F today · 19 d/yr by 30 yrs out
- Wind 1/10 Low
- Air quality 7/10 Severe 15 unhealthy d/yr today · 17 by 30 yrs out
Nearby sold comps map
Loading sold comps map…
Walkable amenities ~0.75 mi
Loading nearby amenities…
Taxation est. · year 1
- Rental income
- $84,156
- − Mortgage interest
- −$49,014
- − Property taxes
- −$5,714
- − Insurance
- −$4,375
- − Repairs & maintenance
- −$6,732
- − Management
- −$6,732
- − Depreciation
- −$25,455
- Taxable loss
- −$13,866
- Est. tax savings @ 24.0%
- +$3,328
- After-tax cash flow
- $4,659/yr
For passive investors: Depreciation is non-cash, so a rental often shows a tax loss while cash-flowing — sheltering income. Rental losses are passive: they offset passive income freely, and up to $25,000/yr can offset ordinary (W-2) income if you actively participate and your MAGI is under $100k (phasing out to $0 by $150k); unused losses carry forward. On sale, claimed depreciation is recaptured at up to 25%, and gains may owe capital-gains tax (a 1031 exchange can defer both). Figures are a year-1 estimate at your 24.0% rate — not tax advice; consult a CPA.
Schools (NCES district)
- District
- Azusa Unified
- NCES district ID
- 0603600
- Math proficiency
- 30% ▲ 2.00%
- Reading proficiency
- 39% ▬ 0.00%
- Median HH income
- $58,149
- Composite
- 33.35/100
- National rank
- #10566
- State rank
- #874 of 1400 in CA
Livability — Azusa
- Score
- 65/100
- State rank
- #367
- US rank
- #12533
Category grades
Schools grade is shown separately in the Schools card above.
Census & demographics
- Census place
- Azusa, CA
- County
- Los Angeles County · 9,444,647 people
- City population
- 60,903
- Metro
- Los Angeles-Long Beach-Anaheim, CA
- Population (ZIP)
- 60,903
- Household income
- $92,683
- Rent vs Own
- Severe rent burden
- 1631.0
Population outlook (Los Angeles County) Hauer SSP2
- Today (2025)
- 10,940,515 people
- By 2030
- 11,256,481 · +2.9%
- By 2040
- 11,729,929 · +7.2%
- By 2050
- 11,948,407 · +9.2%
- By 2075
- 11,818,114 · +8.0%
- By 2100
- 10,842,928 · -0.9%
Race, ethnicity, and origin ACS 2023
- Neighborhood character
- Predominantly Hispanic (68%)
- Race & ethnicity
- Hispanic / Latino 68% Two or more races 21% White 14% Asian 13% Black 2% Native American 1%
- Hispanic origin (detail)
- Mexican 59%
- Common ancestry
- Lithuanian 1% Italian 1%
- Foreign-born
- 33% · Canada, China, Vietnam
- Languages at home
- 42% English-only · Spanish 47% Chinese 3% Tagalog/Filipino 3%
Political lean MEDSL · Los Angeles
- 2024 margin
- Solid D (+32.9) · D 64.8% · R 31.9% · Other 3.3%
- 2008→2024 swing
- -7.4pp toward R · 2008: 40.4pp · 2024: 32.9pp
- All cycles
- 2024: D+32.9 2020: D+44.2 2016: D+48.0 2012: D+40.0 2008: D+40.4
Not yet ingested
- Civics
- —
Market trends
- HPI YoY
- ▼ -583.11%
- Current HPI
- 422.7044
- Rent YoY
- ▲ 5.38%
- Metro
- Los Angeles-Long Beach-Anaheim, CA
- State GDP YoY
- ▲ 3.21%
- F500 in state
- 116
Industry mix (Fortune 500 HQ in CA)
| Industry | F500 HQs | Revenue |
|---|---|---|
| Technology | 27 | $1,492B |
|
||
| Financial Services | 3 | $174B |
|
||
| Retail | 3 | $44B |
|
||
| Insurance | 3 | $26B |
|
||
| Media / Entertainment | 2 | $115B |
|
||
| Pharmaceuticals / Biotech | 2 | $62B |
|
||
Price history
1 event — show timeline
- 2026-05-27 Listed $875,000 CRMLS
Property tax history
+6.8%/yrLatest (2025): $5,714 · +110.4% YoY. Source: county tax records.
Cash-flow waterfall
monthlySold comps — $/sqft
last 12 mo · ≤1 miLoading sold comps…