 🏷️ Likely Rental
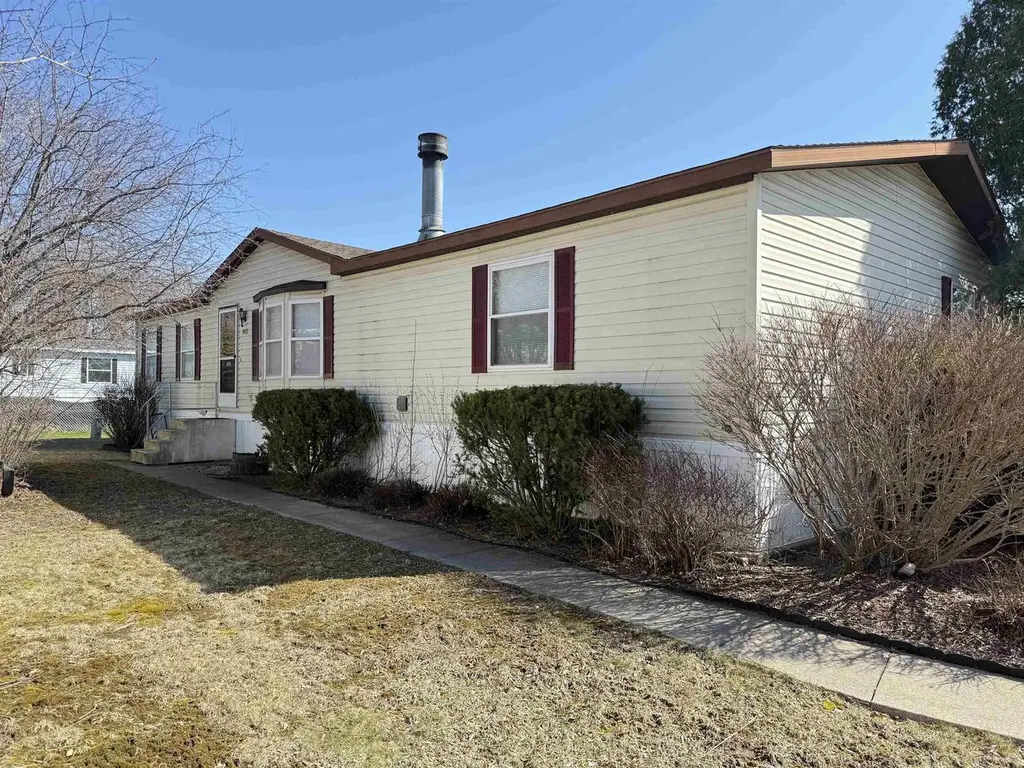
402 Opal Ave · Lannon, WI
Flood risk No data
- FEMA flood zone
- —
- Chance of flooding over 30 yrs
- —
- Est. flood insurance / yr
- —
Fire risk No data
- Est. fire insurance / yr
- —
Heat risk No data
- Hot days now (above threshold)
- —
- Hot days in 30 yrs
- —
Wind risk No data
- Chance of severe wind over 30 yrs
- —
Air-quality risk No data
- Unhealthy air days now
- —
- Unhealthy air days in 30 yrs
- —
Risk factors via First Street. Map © Google.
Why this score? — see what drove the B+ grade
The composite is a weighted blend of 9 inputs, each scored 0–100. Each bar is that input's sub-score; the figure is the points it added to the 100-point composite (weight × sub-score).
- Cash flow +30.0/30.0
- 1% rule +10.0/10.0
- DSCR +10.0/10.0
- ARV discount +7.5/15.0
- Appreciation +7.5/10.0
- Schools +5.6/10.0
- Livability +3.9/5.0
- Condition / age +2.8/5.0
- Rent growth +2.5/5.0
$132,000
🖨 Deal sheet (PDF) 📄 Offer letter ✓ Due diligence
Listing remarks MLS
1992 Marshfield Doublewide Manufactured home! Sewer/well water approx. $75/month. Pet friendly: 2 pets allowed (1 cat/1 dog or 2 cats; dogs subject to HOA approval, no specific breed restrictions). Well-maintained 3BR/2 full bath manufactured home in a desirable park location. Spacious living room opens to the kitchen with a convenient eat-in breakfast area. Convenient laundry area/mud room and large shed. Water heater new in 2025. Schedule your showing today! Lot rent is $955/MONTHLY- MUST APPLY IN PARK
Key facts
- 4,356 sq ft lot
- Built 1992
- Listed 73 days
Neighborhood map
What this means for you Summary
Snapshot
- This is a 3-bed/2.0-bath single-family listed at $132k. Condition is rated average.
Deal economics
- At list price, monthly cash flow is $940 ($11k/yr) — positive.
- The deal already cash-flows at list — no discount required.
- Meets the 1% rule at list price ($2k rent vs $132k).
- Recommended offer: $124k (6.0% below list) — sets the bar for market timing.
Location & tenants
- Location reads 78/100 on livability (#97 in WI, #2,485 nationally) — a middle-class / working-renter tenant base. Strengths: crime A+, cost of living A+, housing A+; Watch: amenities F, commute F.
- Hamilton School District (suburban): math 65% / reading 60% proficiency, ranked #12 of 342 in WI (top 4%) — acceptable for families but not a draw, mixed tenant base, ~2y average lease; only 12% free/reduced lunch — higher-income household profile.
- Market conditions: 21 active listings in the ZIP; 1 comparable units currently listed for rent nearby; 1,885 units permitted in Waukesha County in 2024 (696 in 5+ unit buildings).
Forward outlook
- In year one you build about $8k of equity ($913 loan paydown + $7k appreciation (5.0% local appreciation)).
- At projected returns (5.0% appreciation + 3.0% rent growth), your $37k cash investment doubles in ~2 years — after that, you're playing with house money.
- By year 5, paydown + projected appreciation supports a ~$33k cash-out refi (75% LTV) — recoverable capital for the next deal without selling this one.
Negotiation context
- It's been on market 74 days — a 6% lower offer ($124k) is reasonable based on typical stale-listing flexibility.
Questions for the listing agent
- It's been on market 74 days. Have you received any prior offers? Is the seller open to a 6% concession, seller financing, or rate buy-down credit?
- Why hasn't it sold? Are there any deal-killer items the seller is aware of (foundation, flood, title, zoning, code violations)?
- Is there a deadline driving the sale (1031 exchange, divorce, estate, relocation)? That informs how much negotiation room exists.
- Schools are A-rated — typically a magnet for longer-tenancy family renters. What's the average tenant stay here, and is there a school-zone premium baked into asking?
- What's the average days-on-market for RENTAL listings here right now (not sales)? A rising rental-DOM trend means longer vacancies and softer asking-rent achievability than the comps imply.
- What's the recent tenant-quality profile in this submarket — average credit score on applications, eviction rate, late-payment / NSF rate, and stable-employment percentage? A property-management company in the area should have these aggregated.
- How much new for-sale + rental construction is in the pipeline within 1–3 miles? Heavy new supply typically softens prices + rents 12–24 months out; constrained supply supports both.
Investment metrics
- 1% rule
- 1.78% ✓
- Cap rate
- 14.84%
- Cash-on-cash
- 30.53%
- DSCR
- 2.36
- GRM
- 4.7
CMA / ARV
- ARV (median comp)
- $402,462
- List price
- $132,000
- Delta
- -67.20%
- Verdict
- UNDERPRICED
- Comps
- 20 within 1.0 mi
Show comp detail 8 sales within ~0.75 mi
| Address | Dist | Beds/Ba | Sqft | Sold | Price | $/sf | Match |
|---|---|---|---|---|---|---|---|
| W204N6866 Woodward Ct | 0.19mi | 3/1.5 | 1,531 (-9%) | 12mo | $425,000 | $278 | 64 |
| 20452 Good Hope Rd | 0.36mi | 3/2.0 | 1,703 (+1%) | 23mo | $300,000 | $176 | 61 |
| W207N6838 Flora Dr | 0.31mi | 3/1.5 | 1,455 (-13%) | 6mo | $399,900 | $275 | 56 |
| 20903 W Main St | 0.43mi | 3/1.0 | 1,847 (+10%) | 10mo | $442,000 | $239 | 51 |
| 21308 W Main St | 0.70mi | 3/2.0 | 1,731 (+3%) | 22mo | $327,000 | $189 | 44 |
| W204N6612 Lannon Rd | 0.43mi | 2/2.0 (-1) | 1,910 (+14%) | 11mo | $420,000 | $220 | 43 |
| 7337 N Vine St | 0.53mi | 4/1.0 (+1) | 1,904 (+13%) | 6mo | $345,000 | $181 | 38 |
| 20999 W Main St | 0.47mi | 3/2.0 | 1,916 (+14%) | 23mo | $420,000 | $219 | 36 |
Match score weights: distance 35% · size 25% · config 20% · recency 20%. Top-matched comps best support the ARV.
Projected returns pro-forma
5.05% appreciation · 3.0% rent growth · sell at horizon
- IRR
- 39.8%
- Equity multiple
- 3.45×
- Total profit
- $90,700
- Equity at exit
- $75,175
- IRR
- 37.8%
- Equity multiple
- 7.02×
- Total profit
- $222,338
- Equity at exit
- $130,051
Cash invested: $36,960 (down + closing). Projections, not guarantees.
Landlord ↔ Tenant lean methodology
- Overall (STATE)
- 73 Landlord-Friendly
- State Wisconsin
- 73 Landlord-Friendly · R+2
- County
- — inherits STATE
- City
- — inherits STATE
ZIP-level market 53046
- Home prices YoY
- 2.5%
- Active inventory
- 21
- Price-to-rent
- 4.7×
Monthly cashflow live
- Estimated rent
- $2,345 medium interval (Pro) →
- Mortgage (P&I)
- −$692
- Tax est. 1.5%
- −$165 /mo · $1,980/yr
- Insurance
- −$55
- HOA
- −$0
- Vacancy / Maint / Mgmt
- −$492
- Net cashflow
- $940
Break-even live
Sensitivity live
| Price | -10% $1,032 | -5% $986 | +0% $940 | +5% $895 | +10% $849 |
|---|---|---|---|---|---|
| Rent | -10% $755 | -5% $848 | +0% $940 | +5% $1,033 | +10% $1,126 |
| Rate | -1.0pp $1,007 | -0.5pp $974 | base $940 | +0.5pp $906 | +1.0pp $871 |
UW: 25.0% down · 7.5% · 30yr · 1.5% tax · 5.0% vac · 8.0% maint · 8.0% mgmt
Financing live
Cash to close
- Down payment
- $33,000
- Closing costs
- $3,960
- Reserves months
- —
- Total cash needed
- —
Loan-product check · same deal, 3 products live
Conventional
25% down · 7.5% · 30yr
- Down + closing
- —
- Monthly P&I
- —
- Monthly cashflow
- —
- DSCR
- —
- Eligible?
- —
Personal DTI + credit; lowest rate.
DSCR
20% down · 8.5% · 30yr
- Down + closing
- —
- Monthly P&I
- —
- Monthly cashflow
- —
- DSCR
- —
- Eligible?
- —
No personal income docs; deal must DSCR.
Hard money
10% down · 12.0% · 12mo
- Down + closing
- —
- Monthly P&I
- —
- Monthly cashflow
- —
- DSCR
- —
- Eligible?
- —
Short-term bridge; refi at stabilization.
Rent comps 1 comps
| Address | Beds | Baths | Sqft | Rent | $/sqft | DOM | Units | Dist |
|---|---|---|---|---|---|---|---|---|
| 19400 Rock Pointe Way Lannon, WI | 1.0–3.0 | 1.0–2.0 | 1114 | $2,345 | $2.11 | 2d | 1 | 1.25mi |
Listing history 16 events
-
2026-06-21days on market $132,000 Active 74 DOM
-
2026-06-18days on market $132,000 Active 71 DOM
-
2026-06-17days on market $132,000 Active 70 DOM
-
2026-06-16days on market $132,000 Active 69 DOM
-
2026-06-15days on market $132,000 Active 68 DOM
-
2026-06-13days on market $132,000 Active 66 DOM
-
2026-06-09days on market $132,000 Active 62 DOM
-
2026-06-08days on market $132,000 Active 61 DOM
-
2026-06-07days on market $132,000 Active 60 DOM
-
2026-06-05days on market $132,000 Active 57 DOM
-
2026-06-03pricedays on market $132,000 Active 56 DOM
-
2026-06-02days on market $140,000 Active 55 DOM
-
2026-06-01days on market $140,000 Active 54 DOM
-
2026-05-31days on market $140,000 Active 53 DOM
-
2026-05-05price $140,000 511-char remark
Show marketing remark (511 chars)
1992 Marshfield Doublewide Manufactured home! Sewer/well water approx. $75/month. Pet friendly: 2 pets allowed (1 cat/1 dog or 2 cats; dogs subject to HOA approval, no specific breed restrictions). Well-maintained 3BR/2 full bath manufactured home in a desirable park location. Spacious living room opens to the kitchen with a convenient eat-in breakfast area. Convenient laundry area/mud room and large shed. Water heater new in 2025. Schedule your showing today! Lot rent is $955/MONTHLY- MUST APPLY IN PARK
-
2026-04-08$150,000 Active 511-char remark
Show marketing remark (511 chars)
1992 Marshfield Doublewide Manufactured home! Sewer/well water approx. $75/month. Pet friendly: 2 pets allowed (1 cat/1 dog or 2 cats; dogs subject to HOA approval, no specific breed restrictions). Well-maintained 3BR/2 full bath manufactured home in a desirable park location. Spacious living room opens to the kitchen with a convenient eat-in breakfast area. Convenient laundry area/mud room and large shed. Water heater new in 2025. Schedule your showing today! Lot rent is $955/MONTHLY- MUST APPLY IN PARK
ⓘ Source: listings_history table (triggers on properties + properties_extension) + one-shot
backfill from property_details.listing_events for pre-trigger history.
Nearby sold comps map
Loading sold comps map…
Walkable amenities ~0.75 mi
Loading nearby amenities…
Taxation est. · year 1
- Rental income
- $28,140
- − Mortgage interest
- −$7,394
- − Property taxes
- −$1,980
- − Insurance
- −$660
- − Repairs & maintenance
- −$2,251
- − Management
- −$2,251
- − Depreciation
- −$3,840
- Taxable income
- $9,764
- Est. tax owed @ 24.0%
- −$2,343
- After-tax cash flow
- $8,941/yr
For passive investors: Depreciation is non-cash, so a rental often shows a tax loss while cash-flowing — sheltering income. Rental losses are passive: they offset passive income freely, and up to $25,000/yr can offset ordinary (W-2) income if you actively participate and your MAGI is under $100k (phasing out to $0 by $150k); unused losses carry forward. On sale, claimed depreciation is recaptured at up to 25%, and gains may owe capital-gains tax (a 1031 exchange can defer both). Figures are a year-1 estimate at your 24.0% rate — not tax advice; consult a CPA.
Condition & rehab AI · 12 photos
This 1992 manufactured home requires moderate repairs and maintenance, including painting, siding, and flooring. Upgrading these areas can significantly increase its resale and rental value.
Repairs flagged
- Minor Paint — Faded paint in some areas
- Minor Siding — Light wear on siding
- Minor Flooring — Carpeted floors in living areas, hardwood in dining area
Value-add opportunities
- Both Paint — Fresh paint can improve curb appeal and interior aesthetics
- Both Siding — New siding can improve curb appeal and increase home value
- Both Flooring — New flooring can improve interior aesthetics and increase home value
Renovation cost estimate screening
| Repair item | Severity | Est. cost |
|---|---|---|
| Paint · Faded paint in some areas | Minor | $500–3,000 |
| Siding · Light wear on siding | Minor | $500–3,000 |
| Flooring · Carpeted floors in living areas, hardwood in dining area | Minor | $500–3,000 |
| Total estimated repair cost · 3 items | $1,500–9,000 |
Value-add ROI direction
- Both Paint — Fresh paint can improve curb appeal and interior aesthetics ↑
- Both Siding — New siding can improve curb appeal and increase home value ↑
- Both Flooring — New flooring can improve interior aesthetics and increase home value ↑
ⓘ Cost ranges are severity-bucket heuristics (US national rule-of-thumb). Get contractor quotes + a written scope before underwriting a rehab budget.
Schools (NCES district)
- District
- Hamilton School District
- NCES district ID
- 5506030
- Math proficiency
- 65% ▼ -3.00%
- Reading proficiency
- 60% ▼ -6.00%
- Median HH income
- $78,241
- Composite
- 55.88/100
- National rank
- #1203
- State rank
- #12 of 342 in WI
Livability — Lannon
- Score
- 78/100
- State rank
- #97
- US rank
- #2485
Category grades
Schools grade is shown separately in the Schools card above.
Census & demographics
- Census place
- Lannon, WI
- City population
- 1,475
- Population (ZIP)
- 1,475
Population outlook (Waukesha County) Hauer SSP2
- Today (2025)
- 412,798 people
- By 2030
- 418,092 · +1.3%
- By 2040
- 420,872 · +2.0%
- By 2050
- 413,862 · +0.3%
- By 2075
- 402,782 · -2.4%
- By 2100
- 365,796 · -11.4%
Race, ethnicity, and origin ACS 2023
- Neighborhood character
- Predominantly White (85%)
- Race & ethnicity
- White 85% Asian 6% Hispanic / Latino 5%
- Hispanic origin (detail)
- Mexican 5%
- Common ancestry
- Romanian 10% Portuguese 6% Scotch-Irish 3%
- Foreign-born
- 7% · Canada
- Languages at home
- 87% English-only · Spanish 5% Other Asian/Pacific 3% Other Indo-European 2%
Political lean MEDSL · Waukesha
- 2024 margin
- R (+19.8) · D 39.5% · R 59.2% · Other 1.3%
- 2008→2024 swing
- +5.9pp toward D · 2008: -25.7pp · 2024: -19.8pp
- All cycles
- 2024: R+19.8 2020: R+20.8 2016: R+27.1 2012: R+34.8 2008: R+25.7
Not yet ingested
- Civics
- —
Market trends
- HPI YoY
- ▲ 5.05%
- Current HPI
- 210.7992
- Rent YoY
- —
- Metro
- —
- State GDP YoY
- ▲ 2.10%
- F500 in state
- 20
Industry mix (Fortune 500 HQ in WI)
| Industry | F500 HQs | Revenue |
|---|---|---|
| Industrial Machinery | 4 | $23B |
|
||
| Industrial Technology | 2 | $36B |
|
||
| Insurance | 1 | $36B |
|
||
| Professional Services | 1 | $19B |
|
||
| Utilities | 1 | $9B |
|
||
| Consumer Goods | 1 | $3B |
|
||
Price history
-6.7% since first listed2 events — show timeline
- 2026-05-05 Price Changed $140,000 SCWMLS
- 2026-04-08 Listed $150,000 SCWMLS
Cash-flow waterfall
monthlySold comps — $/sqft
last 12 mo · ≤1 miLoading sold comps…