5300 NW 87th Ave #306 · Doral, FL
Flood risk 1/10 · Minimal
- FEMA flood zone
- AH
- Chance of flooding over 30 yrs
- 0.0%
- Est. flood insurance / yr
- $1,142 – $2,507
Fire risk 2/10 · Minimal
- Est. fire insurance / yr
- $947 – $1,759
Heat risk 9/10 · Severe
- Hot days now (above 106°F)
- 7 days/yr
- Hot days in 30 yrs
- 28 days/yr
Wind risk 10/10 · Severe
- Chance of severe wind over 30 yrs
- 99.0%
Air-quality risk 2/10 · Minimal
- Unhealthy air days now
- 1 days/yr
- Unhealthy air days in 30 yrs
- 1 days/yr
Risk factors via First Street. Map © Google.
Why this score? — see what drove the C grade
The composite is a weighted blend of 9 inputs, each scored 0–100. Each bar is that input's sub-score; the figure is the points it added to the 100-point composite (weight × sub-score).
- Cash flow +17.7/30.0
- 1% rule +10.0/10.0
- ARV discount +7.5/15.0
- DSCR +5.5/10.0
- Appreciation +4.9/10.0
- Schools +4.2/10.0
- Livability +4.0/5.0
- Condition / age +2.5/5.0
- Rent growth +2.2/5.0
$118,000
🖨 Deal sheet (PDF) 📄 Offer letter ✓ Due diligence
Listing remarks
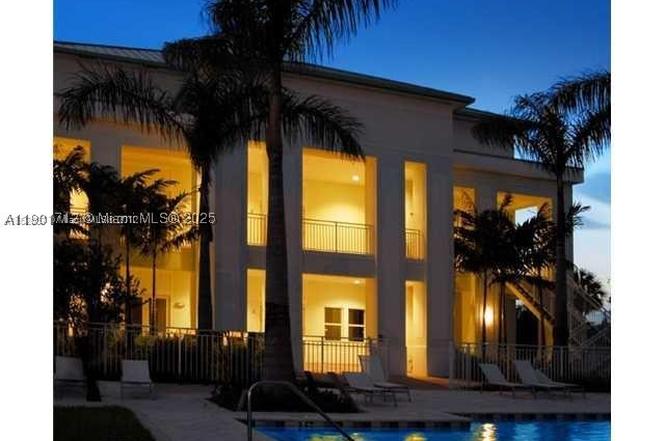
Amazing fully furnished Studio at Providence Doral at The Blue. The unit # 306 is located in the third building next to the pool and front desk. The owners and guests can also enjoy a full list of massage and beauty services spa, an equipped 24-hour fitness center, excellent restaurant and resort style, pool on site. Located right in the heart of Doral and walking distance to Downtown Doral and the Trump National Hotel and Golf Course, and just a short drive to City Place Doral, the airport, and Brickell/Downtown/Beaches. Condo Association fee includes all utilities and amenities, electricity, hot water, cable, WIFI, 24 hour security. Owners can stay for up to 6 months per year. Unit can be
Key facts
- Excellent restaurant
- Resort style pool
- Hotel-resort program
Tags
Property features AI
Finance
- Other: Association pool
- Financial info: Pets not allowed
- HOA & community: Monthly association fee; Association fee covers amenities; Amenities include elevator(s), fitness center, and pool
Exterior
- Parking: 1 covered garage space; Open parking space
- Security: Complex fenced
- Utilities: Central heating; Central air conditioning
- Home design: Attached property; 2 stories; Entry on level 2
- Construction: Block construction; Resale property
- Exterior features: Balcony; Open balcony/patio; Complex fenced
Interior
- Kitchen: Dishwasher; Electric range; Microwave; Refrigerator
- Bedrooms: Den
- Bathrooms: 1 full bathroom
- Heating & cooling: Central heating; Central air conditioning
- Interior features: Blinds; First floor entry; Elevator; Bedroom on main level
- Laundry & utility: Washer; Dryer
Neighborhood map
What this means for you Summary
Snapshot
- This is a 1-bed/1.0-bath condo listed at $118k.
Deal economics
- At list price, monthly cash flow is $-57 ($-688/yr) — negative.
- To cash-flow at today's rent, offer at most $108k (8.6% below list).
- Meets the 1% rule at list price ($2k rent vs $118k).
- Recommended offer: $104k (12.0% below list) — sets the bar for market timing.
- Cap rate 7.3% vs local median 2.8% in Doral — top-decile yield for the area; either an underpriced asset or a hidden risk that comps aren't pricing in. Stress-test before assuming the spread holds.
Location & tenants
- Location reads 80/100 on livability (#122 in FL, #1,868 nationally) — a professional / high-income tenant draw. Strengths: crime A+, commute A+, employment A+; Watch: amenities D, cost of living F.
- Miami-Dade (suburban): math 45% / reading 54% proficiency, ranked #40 of 73 in FL (top 55%) — families likely to look elsewhere, expect single-tenant / working-renter base with shorter leases; 64% free/reduced lunch — lower-income household profile, screen leases tightly.
- Zoned schools: John I. Smith K-8 Center (math 57% / reading 58%, grade C+, #764 of 2,144 statewide, top 36%, 1,001 students, 31% FRL); Ruben Dario Middle School (math 32% / reading 45%, grade F, #384 of 571 statewide, top 68%, 549 students, 62% FRL); J.C. Bermudez Doral Senior High (math 32% / reading 39%, grade F, #367 of 667 statewide, top 57%, 859 students, 31% FRL) — zoned schools average 41% FRL vs 64% district-wide (23 pts lower); this property's tenant base skews higher-income than the district average.
- Market conditions: Rents soft (-1.1%/yr); 483 active listings in the ZIP; 36 comparable units currently listed for rent nearby; rentals leasing fast (median 5d on market — plan ~1-2 weeks tenant-placement turnaround); solid renter incomes; 10,051 units permitted in Miami-Dade County in 2024 (7,758 in 5+ unit buildings).
- This rent runs 31% of the median local income ($97k/yr) — at the standard rent-burdened threshold; future hikes will face affordability resistance.
Forward outlook
- In year one you build about $513 of equity ($816 loan paydown + $-303 appreciation (-0.3% local appreciation)).
- Miami-Dade County population projected at +28% by 2050 — long-run rental-demand tailwind backs the buy-and-hold thesis.
Negotiation context
- It's been on market 241 days — a 12% lower offer ($104k) is reasonable based on typical stale-listing flexibility.
Risks & watch-outs
- Watch-outs: flood insurance adds $152/mo; HOA is 43% of rent.
- Climate carrying-cost: in FEMA flood zone AH (mandatory federal flood insurance); severe wind risk, 99% chance of damaging wind over 30y; extreme-heat days projected 7→28/yr by 2055 (HVAC capex compounding) — expect insurance premiums to compound above CPI over the hold.
Questions for the listing agent
- What do current leases actually rent for vs. the listed asking? Can we see a recent rent roll and the last 12 months of T-12 income?
- It's been on market 241 days. Have you received any prior offers? Is the seller open to a 12% concession, seller financing, or rate buy-down credit?
- What's the actual annual flood-insurance premium (NFIP or private), and is the property in a SFHA with mandatory coverage?
- What does the HOA fee cover, when was the last increase, and are there any pending special assessments or reserve-fund shortfalls?
- Any open or pending special assessments — roof, HVAC, plumbing, elevator, façade? What's the per-unit balance and payoff schedule, and is the seller paying it off at close or rolling it to the buyer?
- Why hasn't it sold? Are there any deal-killer items the seller is aware of (foundation, flood, title, zoning, code violations)?
- Is there a deadline driving the sale (1031 exchange, divorce, estate, relocation)? That informs how much negotiation room exists.
- Schools are A-rated — typically a magnet for longer-tenancy family renters. What's the average tenant stay here, and is there a school-zone premium baked into asking?
- What's the average days-on-market for RENTAL listings here right now (not sales)? A rising rental-DOM trend means longer vacancies and softer asking-rent achievability than the comps imply.
- What's the recent tenant-quality profile in this submarket — average credit score on applications, eviction rate, late-payment / NSF rate, and stable-employment percentage? A property-management company in the area should have these aggregated.
- How much new apartment / multifamily construction is in the pipeline within 1–3 miles? Heavy new supply (>2% of stock underway) typically softens rents 12–24 months out; light construction supports rent growth.
Investment metrics
- 1% rule
- 2.11% ✓
- Cap rate
- 7.26%
- Cash-on-cash
- 3.44%
- DSCR
- 1.15
- GRM
- 4.0
CMA / ARV
No comps found within radius.
Projected returns pro-forma
-0.26% appreciation · 0.0% rent growth · sell at horizon
- IRR
- -10.4%
- Equity multiple
- 0.55×
- Total profit
- $-15,028
- Equity at exit
- $32,757
- IRR
- -10.3%
- Equity multiple
- 0.13×
- Total profit
- $-28,886
- Equity at exit
- $38,193
Cash invested: $33,040 (down + closing). Projections, not guarantees.
Landlord ↔ Tenant lean methodology
- Overall (STATE)
- 87 Strongly Landlord-Friendly
- State Florida
- 87 Strongly Landlord-Friendly · R+3
- County
- — inherits STATE
- City
- — inherits STATE
ZIP-level market 33178
- Home prices YoY
- -0.1%
- Rents YoY
- -1.1%
- Active inventory
- 483
- Price-to-rent
- 4.0×
Monthly cashflow live
- Estimated rent
- $2,486 high interval (Pro) →
- Mortgage (P&I)
- −$619
- Tax from tax record
- −$144 /mo · $1,722/yr
- Insurance
- −$49
- Flood insurance flood zone
- −$152 /mo · $1,824/yr
- HOA
- −$1,058
- Vacancy / Maint / Mgmt
- −$522
- Net cashflow
- $-57
Break-even live
Sensitivity live
| Price | -10% $9 | -5% $-24 | +0% $-57 | +5% $-91 | +10% $-124 |
|---|---|---|---|---|---|
| Rent | -10% $-254 | -5% $-156 | +0% $-57 | +5% $41 | +10% $139 |
| Rate | -1.0pp $2 | -0.5pp $-27 | base $-57 | +0.5pp $-88 | +1.0pp $-119 |
UW: 25.0% down · 7.5% · 30yr · 1.5% tax · 5.0% vac · 8.0% maint · 8.0% mgmt
Financing live
Cash to close
- Down payment
- $29,500
- Closing costs
- $3,540
- Reserves months
- —
- Total cash needed
- —
Loan-product check · same deal, 3 products live
Conventional
25% down · 7.5% · 30yr
- Down + closing
- —
- Monthly P&I
- —
- Monthly cashflow
- —
- DSCR
- —
- Eligible?
- —
Personal DTI + credit; lowest rate.
DSCR
20% down · 8.5% · 30yr
- Down + closing
- —
- Monthly P&I
- —
- Monthly cashflow
- —
- DSCR
- —
- Eligible?
- —
No personal income docs; deal must DSCR.
Hard money
10% down · 12.0% · 12mo
- Down + closing
- —
- Monthly P&I
- —
- Monthly cashflow
- —
- DSCR
- —
- Eligible?
- —
Short-term bridge; refi at stabilization.
Rent comps 36 comps
| Address | Beds | Baths | Sqft | Rent | $/sqft | DOM | Units | Dist |
|---|---|---|---|---|---|---|---|---|
| 5300 Paseo Blvd Unit 1007 Doral, FL | 1.0 | 1.0 | 698 | $2,700 | $3.87 | 4d | 1 | 0.11mi |
| 5300 Paseo Blvd Doral, FL | 1.0–2.0 | 1.0–2.0 | 900 | $2,700 | $3.00 | 9d | 3 | 0.11mi |
| 5300 Paseo Blvd Doral, FL | 1.0–2.0 | 1.0–2.0 | 900 | $2,600 | $2.89 | 3d | 4 | 0.11mi |
| 5252 NW 85th Ave Doral, FL | 1.0–3.0 | 1.0–2.0 | 1008 | $2,650 | $2.63 | 19d | 6 | 0.16mi |
| 5252 NW 85th Ave Doral, FL | 1.0–3.0 | 1.0–2.0 | 1008 | $2,700 | $2.68 | 0d | 6 | 0.16mi |
| 5350 NW 84th Ave Doral, FL | 3.0 | 1.0–3.0 | 904 | $3,167 | $3.50 | 0d | 11 | 0.20mi |
| 5350 NW 84th Ave Unit 1022290P Doral, FL | 1.0 | 1.0 | 656 | $3,880 | $5.91 | 15d | 1 | 0.20mi |
| 5250 NW 84th Ave Doral, FL | 1.0–3.0 | 1.0–2.0 | 979 | $2,458 | $2.51 | 0d | 38 | 0.24mi |
| 4760 NW 85th Ave Miami, FL | 3.0 | 1.0–2.0 | 999 | $3,032 | $3.03 | 0d | 17 | 0.31mi |
| 8290 Lake Dr Doral, FL | 1.0–2.0 | 1.0–2.0 | 873 | $1,950 | $2.23 | 3d | 3 | 0.41mi |
| 8290 Lake Dr Doral, FL | 1.0–2.0 | 1.0–2.0 | 873 | $2,000 | $2.29 | 4d | 3 | 0.41mi |
| 4740 NW 84th Ct Unit 43A Doral, FL | — | 1.0 | 600 | $1,690 | $2.82 | 14d | 1 | 0.43mi |
| 4740 NW 84th Ave Miami, FL | — | 1.0 | 600 | $1,690 | $2.82 | 18d | 1 | 0.43mi |
| 8150 NW 53rd St Doral, FL | 1.0–3.0 | 1.0–2.0 | 999 | $2,467 | $2.47 | 0d | 19 | 0.53mi |
| 8160 Geneva Ct Doral, FL | 1.0 | 1.0 | 710 | $1,950 | $2.75 | 9d | 4 | 0.58mi |
| 8100 Geneva Ct Doral, FL | 1.0–2.0 | 1.0–2.0 | 851 | $2,000 | $2.35 | 9d | 1 | 0.65mi |
| 8100 Geneva Ct Doral, FL | 1.0–2.0 | 1.0–2.0 | 851 | $1,875 | $2.20 | 6d | 2 | 0.65mi |
| 8100 Geneva Ct #233 Doral, FL | 1.0 | 1.0 | 710 | $1,950 | $2.75 | 19d | 1 | 0.66mi |
| 8100 Geneva Ct #345 Doral, FL | 1.0 | 1.0 | 710 | $2,000 | $2.82 | 16d | 1 | 0.66mi |
| 8803 NW 41st St Unit 8803 Doral, FL | 1.0 | 1.0 | 738 | $2,259 | $3.06 | 26d | 1 | 0.67mi |
| 8425 NW 41st St Doral, FL | 1.0–3.0 | 1.0–2.0 | 991 | $2,354 | $2.38 | 0d | 36 | 0.68mi |
| 8800 NW 36th St #14 Doral, FL | 1.0 | 1.0 | 706 | $3,140 | $4.45 | 22d | 1 | 0.77mi |
| 8902 Doral Blvd Unit 402 Doral, FL | 1.0 | 1.0 | 720 | $2,250 | $3.12 | 9d | 1 | 0.78mi |
| 8800 Doral Blvd Doral, FL | 3.0 | 1.0–2.0 | 977 | $2,711 | $2.77 | 0d | 42 | 0.79mi |
| 4400 NW 79th Ave Doral, FL | 1.0–3.0 | 1.0–2.0 | 900 | $2,270 | $2.52 | 0d | 6 | 0.86mi |
| 3555 NW 83rd Ave Doral, FL | 2.0 | 1.0–2.0 | 848 | $2,582 | $3.04 | 0d | 32 | 0.95mi |
| 8401 NW 34th Ter Doral, FL | 2.0 | 1.0–2.0 | 840 | $2,974 | $3.54 | 0d | 22 | 0.99mi |
| 9400 NW 41st St Doral, FL | 1.0 | 1.0 | 759 | $2,511 | $3.31 | 0d | 9 | 1.01mi |
| 3300 NW 87th Ave Unit 309 Doral, FL | — | 1.0 | 520 | $2,150 | $4.13 | 9d | 1 | 1.04mi |
| 3450 NW 85th Ct Doral, FL | 3.0 | 1.0–2.0 | 971 | $2,581 | $2.66 | 0d | 28 | 1.04mi |
| 3940 NW 79th Ave Doral, FL | 3.0 | 1.0–3.0 | 1040 | $2,907 | $2.79 | 0d | 1 | 1.05mi |
| 9480 NW 41st St Unit 3542 Doral, FL | 1.0 | 1.0 | 702 | $2,257 | $3.22 | 4d | 1 | 1.05mi |
| 3368 NW 84th Ave Miami, FL | 1.0 | 1.0 | 700 | $2,319 | $3.31 | 9d | 1 | 1.10mi |
| 8430 NW 33rd Ter Unit 33 Doral, FL | 1.0 | 1.0 | 715 | $2,400 | $3.36 | 9d | 1 | 1.12mi |
| 7902 NW 36th St Unit 705 Miami, FL | — | 1.0 | 525 | $2,150 | $4.10 | 9d | 1 | 1.13mi |
| 10000 NW 45th Ter Doral, FL | 1.0–3.0 | 1.0–3.0 | 1088 | $2,125 | $1.95 | 0d | 21 | 1.40mi |
HOA detail condo
- Monthly dues
- $1,058 · $12,696/yr
- Likely covers
- waterelectricinternetcablepoolgymsecurity
- Assessments
- None detected in remarks — confirm with the listing agent.
Listing history 20 events
-
2026-06-21days on market $118,000 Active 241 DOM
-
2026-06-18days on market $118,000 Active 238 DOM
-
2026-06-17days on market $118,000 Active 237 DOM
-
2026-06-16days on market $118,000 Active 236 DOM
-
2026-06-15price $118,000 Active 235 DOM
-
2026-06-15days on market $119,000 Active 235 DOM
-
2026-06-13days on market $119,000 Active 233 DOM
-
2026-06-09days on market $119,000 Active 229 DOM
-
2026-06-08days on market $119,000 Active 228 DOM
-
2026-06-08days on market $119,000 Active 227 DOM
-
2026-06-04days on market $119,000 Active 224 DOM
-
2026-06-03days on market $119,000 Active 223 DOM
-
2026-06-02days on market $119,000 Active 222 DOM
-
2026-06-01days on market $119,000 Active 221 DOM
-
2026-05-31days on market $119,000 Active 220 DOM
-
2026-05-04price $119,000
-
2026-04-27price $120,000
-
2026-04-13price $125,000
-
2026-02-27price $128,000
-
2025-10-23$135,000 Active
ⓘ Source: listings_history table (triggers on properties + properties_extension) + one-shot
backfill from property_details.listing_events for pre-trigger history.
Tax reassessment forecast FL · Resets to sale price
- Current annual tax
- $1,722 · $144/mo
- Projected year-2 tax
- $1,722 · $144/mo
- Expected delta
- $0/yr ($0/mo · 0.0%)
ⓘ Screening estimate from a state-policy table — verify with the county assessor before closing.
Climate risk First Street
- Flood 1/10 Low FEMA zone AH · 0% chance over 30 yrs
- Wildfire 2/10 Low
- Heat 9/10 Extreme 7 d/yr ≥106°F today · 28 d/yr by 30 yrs out
- Wind 10/10 Extreme 99% chance of damaging wind over 30 yrs
- Air quality 2/10 Low 1 unhealthy d/yr today · 1 by 30 yrs out
Nearby sold comps map
Loading sold comps map…
Walkable amenities ~0.75 mi
Loading nearby amenities…
Taxation est. · year 1
- Rental income
- $29,836
- − Mortgage interest
- −$6,610
- − Property taxes
- −$1,722
- − Insurance
- −$2,414
- − Repairs & maintenance
- −$2,387
- − Management
- −$2,387
- − HOA
- −$12,696
- − Depreciation
- −$3,433
- Taxable loss
- −$1,813
- Est. tax savings @ 24.0%
- +$435
- After-tax cash flow
- $-253/yr
For passive investors: Depreciation is non-cash, so a rental often shows a tax loss while cash-flowing — sheltering income. Rental losses are passive: they offset passive income freely, and up to $25,000/yr can offset ordinary (W-2) income if you actively participate and your MAGI is under $100k (phasing out to $0 by $150k); unused losses carry forward. On sale, claimed depreciation is recaptured at up to 25%, and gains may owe capital-gains tax (a 1031 exchange can defer both). Figures are a year-1 estimate at your 24.0% rate — not tax advice; consult a CPA.
Schools (NCES district)
- District
- Miami-Dade
- NCES district ID
- 1200390
- Math proficiency
- 45% ▼ -16.00%
- Reading proficiency
- 54% ▼ -5.00%
- Median HH income
- $43,928
- Composite
- 41.76/100
- National rank
- #3397
- State rank
- #40 of 73 in FL
Livability — Doral
- Score
- 80/100
- State rank
- #122
- US rank
- #1868
Category grades
Schools grade is shown separately in the Schools card above.
Census & demographics
- Census place
- Doral, FL
- County
- Miami-Dade County · 2,697,751 people
- City population
- 67,789
- Metro
- Miami-Fort Lauderdale-Pompano Beach, FL
- Population (ZIP)
- 67,789
- Household income
- $96,653
- Rent vs Own
- Severe rent burden
- 3658.0
Population outlook (Miami-Dade County) Hauer SSP2
- Today (2025)
- 3,126,439 people
- By 2030
- 3,325,765 · +6.4%
- By 2040
- 3,697,561 · +18.3%
- By 2050
- 4,012,134 · +28.3%
- By 2075
- 4,605,612 · +47.3%
- By 2100
- 4,866,598 · +55.7%
Race, ethnicity, and origin ACS 2023
- Neighborhood character
- Predominantly Hispanic (83%)
- Race & ethnicity
- Hispanic / Latino 83% Two or more races 34% White 11% Asian 2% Black 2%
- Hispanic origin (detail)
- Mexican 2% Puerto Rican 3% Cuban 8% Dominican 3% Salvadoran 2%
- Common ancestry
- Estonian 2% Russian 1% Italian 1%
- Foreign-born
- 69% · Canada, Jamaica, Dominican Republic
- Languages at home
- 12% English-only · Spanish 82% Other Indo-European 4% Other Asian/Pacific 1%
Political lean MEDSL · Miami-Dade
- 2024 margin
- R (+11.4) · D 43.9% · R 55.4%
- 2008→2024 swing
- -27.6pp toward R · 2008: 16.1pp · 2024: -11.4pp
- All cycles
- 2024: R+11.4 2020: D+7.3 2016: D+29.6 2012: D+23.7 2008: D+16.1
Not yet ingested
- Civics
- —
Market trends
- HPI YoY
- ▼ -0.26%
- Current HPI
- 310.2015
- Rent YoY
- ▼ -1.09%
- Metro
- Miami-Fort Lauderdale-Pompano Beach, FL
- State GDP YoY
- ▲ 3.28%
- F500 in state
- 36
Industry mix (Fortune 500 HQ in FL)
| Industry | F500 HQs | Revenue |
|---|---|---|
| Industrial Technology | 2 | $29B |
|
||
| Insurance | 2 | $17B |
|
||
| Retail | 1 | $60B |
|
||
| Technology Distribution | 1 | $58B |
|
||
| Homebuilding | 1 | $35B |
|
||
| Technology Manufacturing | 1 | $35B |
|
||
Price history
-11.9% since first listed5 events — show timeline
- 2026-05-04 Price Changed $119,000 MARMLS
- 2026-04-27 Price Changed $120,000 MARMLS
- 2026-04-13 Price Changed $125,000 MARMLS
- 2026-02-27 Price Changed $128,000 MARMLS
- 2025-10-23 Listed $135,000 MARMLS
Property tax history
-5.4%/yrLatest (2025): $1,722 · -4.9% YoY. Source: county tax records.
Cash-flow waterfall
monthlySold comps — $/sqft
last 12 mo · ≤1 miLoading sold comps…