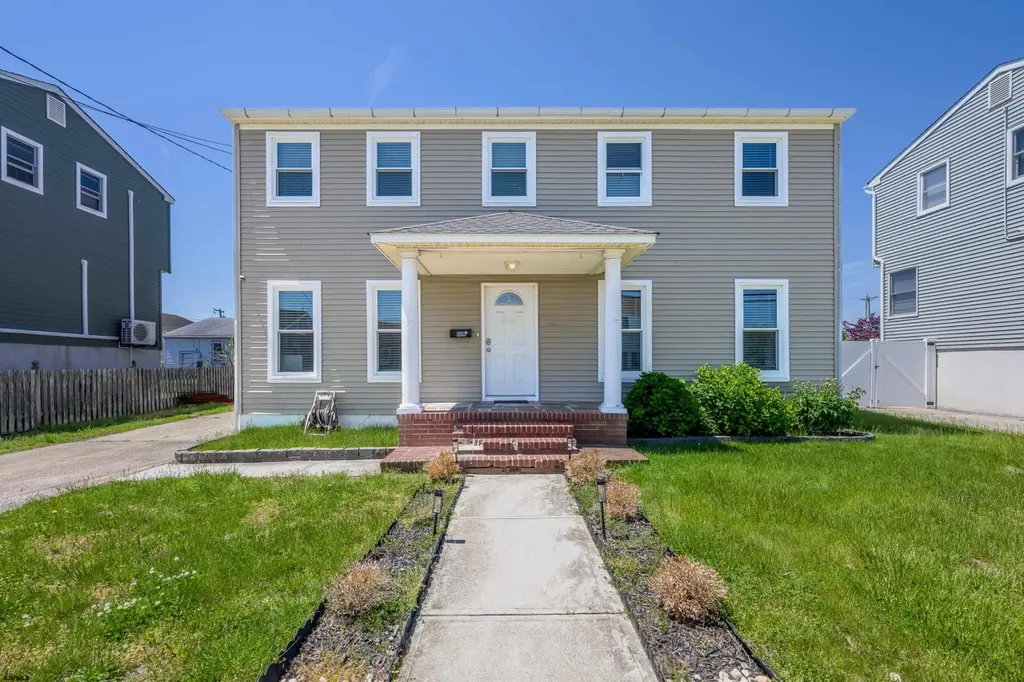
606 N Dudley Ave · Ventnor City, NJ
Flood risk 10/10 · Severe
- FEMA flood zone
- AE
- Chance of flooding over 30 yrs
- 0.99%
- Est. flood insurance / yr
- $1,737 – $8,500
Fire risk 1/10 · Minimal
- Est. fire insurance / yr
- $526 – $976
Heat risk 9/10 · Severe
- Hot days now (above 95°F)
- 7 days/yr
- Hot days in 30 yrs
- 16 days/yr
Wind risk 8/10 · Major
- Chance of severe wind over 30 yrs
- 80.0%
Air-quality risk 2/10 · Minimal
- Unhealthy air days now
- 1 days/yr
- Unhealthy air days in 30 yrs
- 2 days/yr
Risk factors via First Street. Map © Google.
Why this score? — see what drove the D+ grade
The composite is a weighted blend of 9 inputs, each scored 0–100. Each bar is that input's sub-score; the figure is the points it added to the 100-point composite (weight × sub-score).
- Cash flow +17.2/30.0
- ARV discount +7.6/15.0
- DSCR +5.4/10.0
- Rent growth +5.0/5.0
- 1% rule +4.2/10.0
- Livability +3.6/5.0
- Schools +3.3/10.0
- Condition / age +2.5/5.0
- Appreciation +0.0/10.0
$645,000
🖨 Deal sheet (PDF) 📄 Offer letter ✓ Due diligence
Listing remarks MLS
Beautiful 2 story home recently renovated! Property features 3 bedrooms 2.5 baths, newer kitchen w/ granite counter tops, newer kitchen appliances, newer bath, refinished hardwood flooring, freshly painted interior, new lights, windows, heater, air conditioner and more! Just move right into this beauty. The buyer is responsible for the Certificate of Occupancy.
Key facts
- Roof completed
- Recent updates
- Additional den
Tags
Property features AI
Finance
- Other: Listing photos available (36); Available documents: Lead-based paint disclosure, Seller's property condition
Exterior
- Parking: Exterior parking for three or more cars; No garage
- Utilities: Public water; Public sewer; Gas water heater
- Home design: For sale; Age: 25+ years
- Construction: Brick and vinyl exterior
- Exterior features: Brick and vinyl siding; Concrete driveway; Window screens; Lot dimensions approximately 60' x 80'; Zoned R2; Not waterfront
Interior
- Kitchen: Dishwasher; Gas stove; Self-cleaning oven; Microwave; Refrigerator; Disposal
- Bedrooms: 8 total rooms (bedroom count not specified)
- Flooring: Hardwood; Tile; Vinyl; Laminate
- Bathrooms: 2 full bathrooms; 1 half bathroom
- Heating & cooling: Electric heating; Baseboard heating; Electric air conditioning; Multi-zone A/C
- Interior features: Kitchen with center island; Blinds; Den/TV room; Eat-in kitchen; Laundry/utility room; Attic storage; Crawl space basement
- Laundry & utility: Washer; Dryer; Laundry/utility room
Neighborhood map
What this means for you Summary
Snapshot
- This is a 4-bed/2.5-bath single-family listed at $645k.
Deal economics
- At list price, monthly cash flow is $33 ($397/yr) — positive.
- The deal already cash-flows at list — no discount required.
- To meet the 1% rule (rent ≥ 1% of price), the offer needs to be $590k (8.5% below list).
- Recommended offer: $590k (8.5% below list) — sets the bar for 1% rule.
- Cap rate 7.1% vs local median 4.1% in Ventnor City — top-decile yield for the area; either an underpriced asset or a hidden risk that comps aren't pricing in. Stress-test before assuming the spread holds.
Location & tenants
- Location reads 72/100 on livability (#202 in NJ) — a middle-class / working-renter tenant base. Strengths: health & safety A+, commute A-, crime B+; Watch: amenities F, cost of living F.
- Ventnor City School District (suburban): math 27% / reading 49% proficiency, ranked #266 of 472 in NJ (top 56%) — families likely to look elsewhere, expect single-tenant / working-renter base with shorter leases.
- Zoned schools: Ventnor Elementary School (math 27% / reading 42%, grade F, #582 of 1,303 statewide, top 49%, 304 students, 47% FRL); Ventnor Middle School (math 28% / reading 52%, grade F, #197 of 431 statewide, top 46%, 204 students, 62% FRL) — zoned schools at 54% FRL track the district average.
- Market conditions: Rents rising fast (+57.3%/yr); 160 active listings in the ZIP; 16 comparable units currently listed for rent nearby; rentals at typical pace (median 23d on market — plan ~3-4 weeks tenant-placement turnaround); 672 units permitted in Atlantic County in 2024 (258 in 5+ unit buildings).
- At $5,903/mo this rent would consume 103% of the median local household income ($69k/yr) (locally 329% of renters already pay >50% of income on rent) — very limited rent-growth headroom before tenants either downsize or default.
Forward outlook
- Local home prices are declining (-3.0%/yr); year-one equity from $4k of loan paydown is wiped out by about $19k of value loss. Plan a longer hold.
- Atlantic County population projected at -12% by 2050 — secular population decline; favor cash flow + early exit over multi-decade hold.
Negotiation context
- It's been on market 32 days — a 3% lower offer ($626k) is reasonable based on typical stale-listing flexibility.
- 7 sale attempts since 22y ago with the ask held roughly flat each time — persistent listings suggest the price (not the market) is what's stuck; bring a comps-based counter.
- Current owner paid $275k; list at $645k implies a 135% gain — meaningful room to come down on a strong offer.
Risks & watch-outs
- Watch-outs: flood insurance adds $427/mo.
- Climate carrying-cost: in FEMA flood zone AE (mandatory federal flood insurance); severe wind risk, 80% chance of damaging wind over 30y; extreme-heat days projected 7→16/yr by 2055 (HVAC capex compounding) — expect insurance premiums to compound above CPI over the hold.
Questions for the listing agent
- It's been on market 32 days. Have you received any prior offers? Is the seller open to a 8% concession, seller financing, or rate buy-down credit?
- Built in 1969 — when were the roof, HVAC, electrical panel, plumbing, and water heater last replaced?
- What's the actual annual flood-insurance premium (NFIP or private), and is the property in a SFHA with mandatory coverage?
- Is there a deadline driving the sale (1031 exchange, divorce, estate, relocation)? That informs how much negotiation room exists.
- The area grade is low — what's the realistic commute time and amenity access for the typical tenant pool here? Any planned neighborhood developments (good or bad) we should know about?
- What's the average days-on-market for RENTAL listings here right now (not sales)? A rising rental-DOM trend means longer vacancies and softer asking-rent achievability than the comps imply.
- What's the recent tenant-quality profile in this submarket — average credit score on applications, eviction rate, late-payment / NSF rate, and stable-employment percentage? A property-management company in the area should have these aggregated.
- How much new for-sale + rental construction is in the pipeline within 1–3 miles? Heavy new supply typically softens prices + rents 12–24 months out; constrained supply supports both.
Investment metrics
- 1% rule
- 0.92% ✗
- Cap rate
- 7.15%
- Cash-on-cash
- 3.05%
- DSCR
- 1.14
- GRM
- 9.1
CMA / ARV
- ARV (on-the-fly)
- $645,840
- Comps found
- 12
Show comp detail 12 sales within ~0.75 mi
| Address | Dist | Beds/Ba | Sqft | Sold | Price | $/sf | Match |
|---|---|---|---|---|---|---|---|
| 504 N Burghley Ave | 0.18mi | 4/2.5 | 1,918 (+2%) | 2mo | $835,000 | $435 | 86 |
| 703 N Burghley Ave | 0.13mi | 4/2.5 | 1,779 (-5%) | 4mo | $605,000 | $340 | 83 |
| 607 N Dorset Ave | 0.02mi | 3/1.5 (-1) | 1,772 (-5%) | 3mo | $544,900 | $308 | 78 |
| 605 N Oxford Ave | 0.07mi | 3/1.5 (-1) | 2,000 (+7%) | 6mo | $595,000 | $298 | 71 |
| 812 N Dorset Ave | 0.24mi | 3/2.5 (-1) | 1,808 (-3%) | 10mo | $635,000 | $351 | 70 |
| 813 Dudley Ct | 0.22mi | 4/2.5 | 2,040 (+9%) | 9mo | $330,000 | $162 | 67 |
| 812 N Burghley Ave | 0.27mi | 3/2.0 (-1) | 2,148 (+15%) | 2mo | $740,000 | $345 | 54 |
| 207 N Harvard Ave | 0.52mi | 3/2.5 (-1) | 1,671 (-11%) | 2mo | $735,000 | $440 | 52 |
| 124 N Newport Ave | 0.65mi | 4/4.0 | 1,996 (+7%) | 5mo | $950,000 | $476 | 48 |
| 118 N Portland Ave | 0.65mi | 3/2.0 (-1) | 1,728 (-8%) | 3mo | $675,000 | $391 | 48 |
| 6217 Monmouth Ave | 0.54mi | 3/2.0 (-1) | 1,593 (-15%) | 1mo | $396,000 | $249 | 42 |
| 6501 Winchester Ave | 0.71mi | 3/1.5 (-1) | 2,030 (+8%) | 9mo | $700,000 | $345 | 36 |
Match score weights: distance 35% · size 25% · config 20% · recency 20%. Top-matched comps best support the ARV.
Projected returns pro-forma
-3.0% appreciation · 8.0% rent growth · sell at horizon
- IRR
- -10.3%
- Equity multiple
- 0.61×
- Total profit
- $-71,022
- Equity at exit
- $96,172
- IRR
- 5.1%
- Equity multiple
- 1.46×
- Total profit
- $83,639
- Equity at exit
- $55,768
Cash invested: $180,600 (down + closing). Projections, not guarantees.
Landlord ↔ Tenant lean methodology
- Overall (STATE)
- 21 Tenant-Leaning
- State New Jersey
- 21 Tenant-Leaning · D+6
- County
- — inherits STATE
- City
- — inherits STATE
ZIP-level market 08406
- Home prices YoY
- -33.3%
- Rents YoY
- 57.3%
- Active inventory
- 160
- Price-to-rent
- 9.1×
Monthly cashflow live
- Estimated rent
- $5,903 medium interval (Pro) →
- Mortgage (P&I)
- −$3,382
- Tax from tax record
- −$552 /mo · $6,628/yr
- Insurance
- −$269
- Flood insurance flood zone
- −$427 /mo · $5,118/yr
- HOA
- −$0
- Vacancy / Maint / Mgmt
- −$1,240
- Net cashflow
- $33
Break-even live
Sensitivity live
| Price | -10% $398 | -5% $216 | +0% $33 | +5% $-149 | +10% $-332 |
|---|---|---|---|---|---|
| Rent | -10% $-433 | -5% $-200 | +0% $33 | +5% $266 | +10% $499 |
| Rate | -1.0pp $358 | -0.5pp $197 | base $33 | +0.5pp $-134 | +1.0pp $-304 |
UW: 25.0% down · 7.5% · 30yr · 1.5% tax · 5.0% vac · 8.0% maint · 8.0% mgmt
Financing live
Cash to close
- Down payment
- $161,250
- Closing costs
- $19,350
- Reserves months
- —
- Total cash needed
- —
Loan-product check · same deal, 3 products live
Conventional
25% down · 7.5% · 30yr
- Down + closing
- —
- Monthly P&I
- —
- Monthly cashflow
- —
- DSCR
- —
- Eligible?
- —
Personal DTI + credit; lowest rate.
DSCR
20% down · 8.5% · 30yr
- Down + closing
- —
- Monthly P&I
- —
- Monthly cashflow
- —
- DSCR
- —
- Eligible?
- —
No personal income docs; deal must DSCR.
Hard money
10% down · 12.0% · 12mo
- Down + closing
- —
- Monthly P&I
- —
- Monthly cashflow
- —
- DSCR
- —
- Eligible?
- —
Short-term bridge; refi at stabilization.
Rent comps 16 comps
| Address | Beds | Baths | Sqft | Rent | $/sqft | DOM | Units | Dist |
|---|---|---|---|---|---|---|---|---|
| 406 N Dorset Ave Ventnor City, NJ | 4.0 | 1.5 | 1568 | $13,000 | $8.29 | 15d | 1 | 0.21mi |
| 610A N Victoria Ave Ventnor City, NJ | 3.0 | 2.5 | 1800 | $2,550 | $1.42 | 23d | 1 | 0.23mi |
| 109 N Wissahickon Ave Unit B Ventnor City, NJ | 4.0 | 3.5 | 2000 | $25,000 | $12.50 | 23d | 1 | 0.82mi |
| 24 N Baton Rouge Ave Ventnor City, NJ | 3.0 | 2.0 | 1350 | $18,000 | $13.33 | 15d | 1 | 0.85mi |
| 1 N Austin Ave Unit 1308998P Ventnor City, NJ | 3.0 | 3.0 | 2195 | $7,184 | $3.27 | 23d | 1 | 0.85mi |
| 7 S Richards Ave Ventnor City, NJ | 4.0 | 2.0 | 1600 | $25,000 | $15.62 | 15d | 1 | 0.89mi |
| 7103 Ventnor Ave Ventnor City, NJ | 4.0 | 3.0 | 2288 | $5,500 | $2.40 | 15d | 1 | 1.03mi |
| 6 N Melbourne Ave Ventnor City, NJ | 4.0 | 3.5 | 2028 | $3,000 | $1.48 | 45d | 1 | 1.04mi |
| 119 N Belmont Ave Unit June 2026 Margate City, NJ | 4.0 | 2.5 | 2044 | $10,000 | $4.89 | 15d | 1 | 1.13mi |
| 107 N Douglas Ave Unit AUGUST Margate City, NJ | 5.0 | 3.5 | 2312 | $33,000 | $14.27 | 23d | 1 | 1.33mi |
| 307 N Essex Ave Margate City, NJ | 4.0 | 2.0 | 1561 | $1,800 | $1.15 | 45d | 1 | 1.33mi |
| 107 N Douglas Ave Margate City, NJ | 5.0 | 3.5 | 2312 | $36,000 | $15.57 | 45d | 1 | 1.33mi |
| 36 Chelsea Ct Atlantic City, NJ | 3.0 | 2.5 | 2100 | $3,300 | $1.57 | 15d | 1 | 1.36mi |
| 200 N Essex Ave Margate City, NJ | 4.0 | 3.0 | 1570 | $15,000 | $9.55 | 45d | 1 | 1.36mi |
| 7701 Atlantic Ave Margate City, NJ | 1.0–3.0 | 2.0–3.0 | 1660 | $75,000 | $45.18 | 45d | 4 | 1.44mi |
| 3809 Ventnor Ave #6 Atlantic City, NJ | 3.0 | 1.0 | 1500 | $2,100 | $1.40 | 23d | 1 | 1.47mi |
Listing history 34 events
-
2026-06-21days on market $645,000 Active 32 DOM
-
2026-06-19days on market $645,000 Active 30 DOM
-
2026-06-18days on market $645,000 Active 29 DOM
-
2026-06-17days on market $645,000 Active 28 DOM
-
2026-06-16days on market $645,000 Active 27 DOM
-
2026-06-15days on market $645,000 Active 26 DOM
-
2026-06-14days on market $645,000 Active 24 DOM
-
2026-06-13days on market $645,000 Active 23 DOM
-
2026-06-10pricedays on market $645,000 Active 21 DOM
-
2026-06-09days on market $675,000 Active 20 DOM
-
2026-06-08days on market $675,000 Active 19 DOM
-
2026-06-07days on market $675,000 Active 18 DOM
-
2026-06-03days on market $675,000 Active 14 DOM
-
2026-06-02days on market $675,000 Active 13 DOM
-
2026-06-01days on market $675,000 Active 12 DOM
-
2026-05-31days on market $675,000 Active 11 DOM
-
2026-05-30days on market $675,000 Active 10 DOM
-
2026-05-20$675,000 Active
-
2020-01-02soldstatus $275,000
-
2019-12-03soldstatus $275,000 Closed 365-char remark
Show marketing remark (365 chars)
Beautiful 2 story home recently renovated! Property features 3 bedrooms 2.5 baths, newer kitchen w/ granite counter tops, newer kitchen appliances, newer bath, refinished hardwood flooring, freshly painted interior, new lights, windows, heater, air conditioner and more! Just move right into this beauty. The buyer is responsible for the Certificate of Occupancy.
-
2019-10-11status Pending 365-char remark
Show marketing remark (365 chars)
Beautiful 2 story home recently renovated! Property features 3 bedrooms 2.5 baths, newer kitchen w/ granite counter tops, newer kitchen appliances, newer bath, refinished hardwood flooring, freshly painted interior, new lights, windows, heater, air conditioner and more! Just move right into this beauty. The buyer is responsible for the Certificate of Occupancy.
-
2019-09-01$275,000 Active 365-char remark
Show marketing remark (365 chars)
Beautiful 2 story home recently renovated! Property features 3 bedrooms 2.5 baths, newer kitchen w/ granite counter tops, newer kitchen appliances, newer bath, refinished hardwood flooring, freshly painted interior, new lights, windows, heater, air conditioner and more! Just move right into this beauty. The buyer is responsible for the Certificate of Occupancy.
-
2017-03-22historical 491-char remark
Show marketing remark (491 chars)
Wonderful traditional family home with all the modern touches. Open floor plan with hardwood floors throughout, large breakfast bar in kitchen along with granite counters and stainless steel appliances. Tap room with custom built in bar perfect for entertaining. Large Master bedroom with private bath along with 3 nice sized bedrooms. Huge fenced in yard with all important outside shower, shed & patio. Walk to ballfeild, playground, shopping & more make this the perfect home!
-
2017-02-17$183,900 Active 491-char remark
Show marketing remark (491 chars)
Wonderful traditional family home with all the modern touches. Open floor plan with hardwood floors throughout, large breakfast bar in kitchen along with granite counters and stainless steel appliances. Tap room with custom built in bar perfect for entertaining. Large Master bedroom with private bath along with 3 nice sized bedrooms. Huge fenced in yard with all important outside shower, shed & patio. Walk to ballfeild, playground, shopping & more make this the perfect home!
-
2012-11-01historical
-
2012-04-14$324,900
-
2011-10-11historical
-
2011-03-17$374,900
-
2010-12-15historical
-
2010-04-29$389,900
-
2005-07-07soldstatus $350,000
-
2005-07-05soldstatus $350,000
-
2005-01-01historical
-
2004-12-31$365,000
ⓘ Source: listings_history table (triggers on properties + properties_extension) + one-shot
backfill from property_details.listing_events for pre-trigger history.
Tax reassessment forecast NJ · Partial reset (capped growth)
- Current annual tax
- $6,628 · $552/mo
- Projected year-2 tax
- $11,344 · $945/mo
- Expected delta
- +$4,716/yr (+$393/mo · 71.2%)
ⓘ Screening estimate from a state-policy table — verify with the county assessor before closing.
Climate risk First Street
- Flood 10/10 Extreme FEMA zone AE · 99% chance over 30 yrs
- Wildfire 1/10 Low
- Heat 9/10 Extreme 7 d/yr ≥95°F today · 16 d/yr by 30 yrs out
- Wind 8/10 Severe 80% chance of damaging wind over 30 yrs
- Air quality 2/10 Low 1 unhealthy d/yr today · 2 by 30 yrs out
Nearby sold comps map
Loading sold comps map…
Walkable amenities ~0.75 mi
Loading nearby amenities…
Taxation est. · year 1
- Rental income
- $70,833
- − Mortgage interest
- −$36,130
- − Property taxes
- −$6,628
- − Insurance
- −$8,344
- − Repairs & maintenance
- −$5,667
- − Management
- −$5,667
- − Depreciation
- −$18,764
- Taxable loss
- −$10,366
- Est. tax savings @ 24.0%
- +$2,488
- After-tax cash flow
- $2,885/yr
For passive investors: Depreciation is non-cash, so a rental often shows a tax loss while cash-flowing — sheltering income. Rental losses are passive: they offset passive income freely, and up to $25,000/yr can offset ordinary (W-2) income if you actively participate and your MAGI is under $100k (phasing out to $0 by $150k); unused losses carry forward. On sale, claimed depreciation is recaptured at up to 25%, and gains may owe capital-gains tax (a 1031 exchange can defer both). Figures are a year-1 estimate at your 24.0% rate — not tax advice; consult a CPA.
Schools (NCES district)
- District
- Ventnor City School District
- NCES district ID
- 3416680
- Math proficiency
- 27% ▼ -18.00%
- Reading proficiency
- 49% ▼ -7.00%
- Median HH income
- $52,220
- Composite
- 32.96/100
- National rank
- #5588
- State rank
- #266 of 472 in NJ
Livability — Ventnor City
- Score
- 72/100
- State rank
- #202
- US rank
- #5716
Category grades
Schools grade is shown separately in the Schools card above.
Census & demographics
- Census place
- Ventnor City, NJ
- County
- Atlantic County · 143,611 people
- City population
- 8,972
- Metro
- Atlantic City-Hammonton, NJ
- Population (ZIP)
- 8,972
- Household income
- $69,099
- Rent vs Own
- Severe rent burden
- 329.0
Population outlook (Atlantic County) Hauer SSP2
- Today (2025)
- 268,948 people
- By 2030
- 264,497 · -1.7%
- By 2040
- 252,261 · -6.2%
- By 2050
- 237,846 · -11.6%
- By 2075
- 210,650 · -21.7%
- By 2100
- 180,234 · -33.0%
Race, ethnicity, and origin ACS 2023
- Neighborhood character
- Predominantly White (70%)
- Race & ethnicity
- White 70% Hispanic / Latino 15% Asian 9% Two or more races 9% Black 2%
- Hispanic origin (detail)
- Mexican 3% Puerto Rican 4% Dominican 1%
- Common ancestry
- Romanian 4% Scotch-Irish 3% Iranian 2%
- Foreign-born
- 21% · Canada, Jamaica, Vietnam
- Languages at home
- 76% English-only · Spanish 10% Other Indo-European 5% Vietnamese 3%
Political lean MEDSL · Atlantic
- 2024 margin
- Toss-up / Even · D 47.7% · R 50.7% · Other 1.6%
- 2008→2024 swing
- -18.1pp toward R · 2008: 15.1pp · 2024: -3.0pp
- All cycles
- 2024: R+3.0 2020: D+6.7 2016: D+6.2 2012: D+17.2 2008: D+15.1
Not yet ingested
- Civics
- —
Market trends
- HPI YoY
- ▼ -223.99%
- Current HPI
- 449.3494
- Rent YoY
- ▲ 57.28%
- Metro
- Atlantic City-Hammonton, NJ
- State GDP YoY
- ▲ 2.05%
- F500 in state
- 34
Industry mix (Fortune 500 HQ in NJ)
| Industry | F500 HQs | Revenue |
|---|---|---|
| Consumer Goods | 3 | $31B |
|
||
| Pharmaceuticals | 2 | $153B |
|
||
| Technology | 2 | $21B |
|
||
| Insurance | 2 | $20B |
|
||
| Healthcare | 2 | $19B |
|
||
| Financial Services | 1 | $70B |
|
||
Price history
+84.9% since first listed17 events — show timeline
- 2026-05-20 Listed $675,000 SJSRMLS
- 2020-01-02 Sold (Public Records) $275,000 Public Records
- 2019-12-03 Sold (MLS) $275,000 BRIGHT MLS
- 2019-10-11 Pending — BRIGHT MLS
- 2019-09-01 Listed $275,000 BRIGHT MLS
- 2017-03-22 Listing Removed — SJSRMLS
- 2017-02-17 Listed $183,900 SJSRMLS
- 2012-11-01 Listing Removed — SJSRMLS
- 2012-04-14 Listed $324,900 SJSRMLS
- 2011-10-11 Listing Removed — SJSRMLS
- 2011-03-17 Listed $374,900 SJSRMLS
- 2010-12-15 Listing Removed — SJSRMLS
- 2010-04-29 Listed $389,900 SJSRMLS
- 2005-07-07 Sold (Public Records) $350,000 Public Records
- 2005-07-05 Sold (MLS) $350,000 SJSRMLS
- 2005-01-01 Listing Removed — SJSRMLS
- 2004-12-31 Listed $365,000 SJSRMLS
Property tax history
+1.0%/yrLatest (2025): $6,628 · +3.3% YoY. Source: county tax records.
Cash-flow waterfall
monthlySold comps — $/sqft
last 12 mo · ≤1 miLoading sold comps…