 Duplex
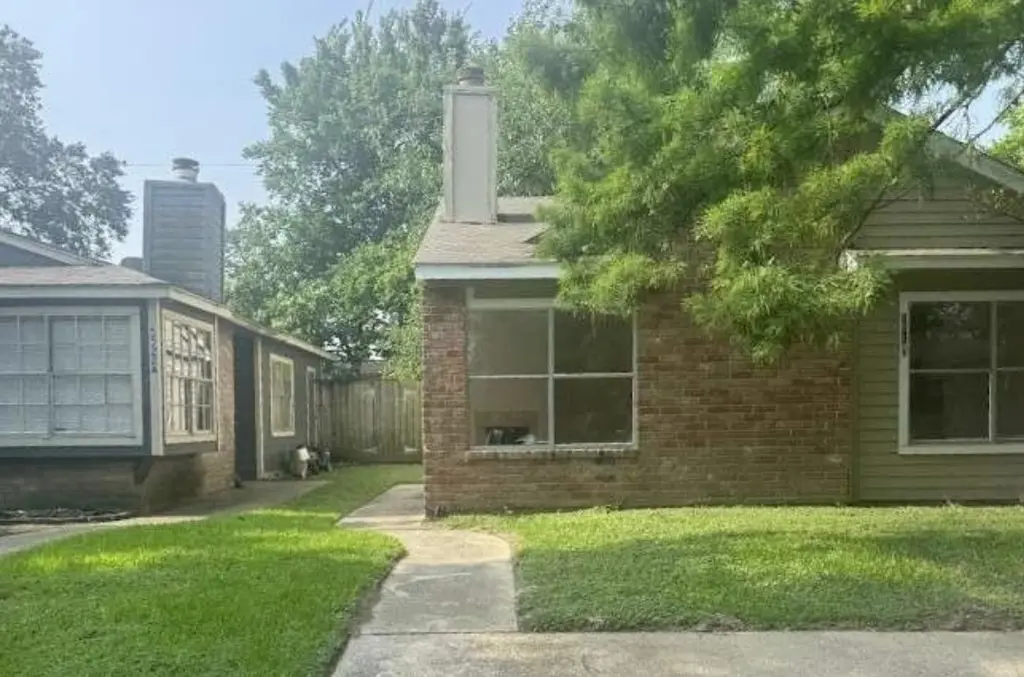
5518 Farley Dr · Houston, TX
Flood risk 3/10 · Minor
- FEMA flood zone
- X (unshaded)
- Chance of flooding over 30 yrs
- 0.2%
- Est. flood insurance / yr
- $507 – $1,088
Fire risk 2/10 · Minimal
- Est. fire insurance / yr
- $1,222 – $2,270
Heat risk 9/10 · Severe
- Hot days now (above 110°F)
- 7 days/yr
- Hot days in 30 yrs
- 24 days/yr
Wind risk 9/10 · Severe
- Chance of severe wind over 30 yrs
- 99.0%
Air-quality risk 3/10 · Minor
- Unhealthy air days now
- 3 days/yr
- Unhealthy air days in 30 yrs
- 3 days/yr
Risk factors via First Street. Map © Google.
Why this score? — see what drove the C grade
The composite is a weighted blend of 9 inputs, each scored 0–100. Each bar is that input's sub-score; the figure is the points it added to the 100-point composite (weight × sub-score).
- Cash flow +21.1/30.0
- DSCR +6.7/10.0
- ARV discount +6.6/15.0
- 1% rule +6.1/10.0
- Appreciation +4.8/10.0
- Livability +3.7/5.0
- Condition / age +2.5/5.0
- Rent growth +2.1/5.0
- Schools +1.5/10.0
$227,499
🖨 Deal sheet 📄 Offer letter ✓ Due diligence
Multi-family units
County records classify this as Multi-Family (2-4 Unit). Listing-text estimate: 2 units. confirmed
Listing remarks MLS
NEW LISTING! UNRESTRICTED DUPLEX for sale at a great price! You can live in one unit and collect rent from the other unit. Each unit has two bedrooms and one bathroom. This property is located near IAH airport and Greenspoint; with easy access to Beltway 8. Features for these units include a tile exposed fireplace, built-in bookshelf, tile flooring throughout the living area and kitchen, and a well-designed spacious floorplan! Unit #A was recently updated including new ceiling fans and fixtures, fresh paint, and new kitchen cabinets. WE MAKE IT EASY TO OWN. This is a great opportunity! Don't wait, call us today to get more information on the owner's easy terms and smooth process that may be able to put the deed in your name and make this your dream property.
Key facts
- Spacious floorplan
- Recently updated
- Built-in bookshelf
Tags
Neighborhood map
What this means for you Summary
Snapshot
- This is a 2 × 2-bed/1.0-bath units multifamily listed at $227k.
Deal economics
- At list price, monthly cash flow is $323 ($4k/yr) — positive. Per door: $162/mo.
- The deal already cash-flows at list — no discount required.
- Meets the 1% rule at list price ($3k rent vs $227k).
- Recommended offer: $200k (12.0% below list) — sets the bar for market timing.
- Cap rate 8.0% vs local median 3.2% in Houston — top-decile yield for the area; either an underpriced asset or a hidden risk that comps aren't pricing in. Stress-test before assuming the spread holds.
Location & tenants
- Location reads 74/100 on livability (#184 in TX, #4,771 nationally) — a middle-class / working-renter tenant base. Strengths: amenities A+, cost of living A+, housing A+; Watch: schools D, crime F.
- Aldine ISD (suburban): math 16% / reading 21% proficiency, ranked #790 of 826 in TX (top 96%) — low school quality limits family demand, transient renter base, plan for 1-2y turnover; 79% free/reduced lunch — lower-income household profile, screen leases tightly.
- Market conditions: Rents soft (-1.5%/yr); 41 active listings in the ZIP; lower-income renter base — watch delinquency; 29,883 units permitted in Harris County in 2024 (8,621 in 5+ unit buildings).
- At $2,516/mo this rent would consume 69% of the median local household income ($44k/yr) (locally 944% of renters already pay >50% of income on rent) — very limited rent-growth headroom before tenants either downsize or default.
Forward outlook
- In year one you build about $681 of equity ($2k loan paydown + $-892 appreciation (-0.4% local appreciation)).
- Harris County population projected at +47% by 2050 — long-run rental-demand tailwind backs the buy-and-hold thesis.
Negotiation context
- It's been on market 332 days — a 12% lower offer ($200k) is reasonable based on typical stale-listing flexibility.
- 2 sale attempts since 7y ago with the ask held roughly flat each time — persistent listings suggest the price (not the market) is what's stuck; bring a comps-based counter.
Risks & watch-outs
- Climate carrying-cost: severe wind risk, 99% chance of damaging wind over 30y; extreme-heat days projected 7→24/yr by 2055 (HVAC capex compounding) — expect insurance premiums to compound above CPI over the hold.
Questions for the listing agent
- It's been on market 332 days. Have you received any prior offers? Is the seller open to a 12% concession, seller financing, or rate buy-down credit?
- Can we see the unit-by-unit rent roll, current vacancy, and any below-market leases? What's the average tenancy length?
- What capital expenditures (roof, boiler, parking lot, exteriors) have been made in the last 5 years, and what's planned in the next 2?
- Why hasn't it sold? Are there any deal-killer items the seller is aware of (foundation, flood, title, zoning, code violations)?
- Is there a deadline driving the sale (1031 exchange, divorce, estate, relocation)? That informs how much negotiation room exists.
- Schools are D-rated, which usually means shorter tenancies and higher turnover. Who's the typical renter profile here, and what's been the actual vacancy rate?
- Crime grade is F in this area — have there been break-ins, vandalism, or insurance claims at this property in the last 3 years? What carrier currently insures it and at what premium?
- What's the average days-on-market for RENTAL listings here right now (not sales)? A rising rental-DOM trend means longer vacancies and softer asking-rent achievability than the comps imply.
- What's the recent tenant-quality profile in this submarket — average credit score on applications, eviction rate, late-payment / NSF rate, and stable-employment percentage? A property-management company in the area should have these aggregated.
- How much new apartment / multifamily construction is in the pipeline within 1–3 miles? Heavy new supply (>2% of stock underway) typically softens rents 12–24 months out; light construction supports rent growth.
Investment metrics
- 1% rule
- 1.11% ✓
- Cap rate
- 8.00%
- Cash-on-cash
- 6.09%
- DSCR
- 1.27
- GRM
- 7.5
CMA / ARV
- ARV (median comp)
- $223,126
- List price
- $227,499
- Delta
- 1.96%
- Verdict
- FAIR
- Comps
- 5 within 1.0 mi
Show comp detail 2 sales within ~0.75 mi
| Address | Dist | Beds/Ba | Sqft | Sold | Price | $/sf | Match |
|---|---|---|---|---|---|---|---|
| 5535 Farley Dr | 0.05mi | 4/1.0 | 2,018 (0%) | 20mo | $230,000 | $114 | 77 |
| 5407 Farley Dr | 0.12mi | 4/2.0 | 1,888 (-6%) | 24mo | $230,000 | $122 | 64 |
Match score weights: distance 35% · size 25% · config 20% · recency 20%. Top-matched comps best support the ARV.
Projected returns pro-forma
-0.39% appreciation · 0.0% rent growth · sell at horizon
- IRR
- 0.9%
- Equity multiple
- 1.04×
- Total profit
- $2,498
- Equity at exit
- $61,636
- IRR
- 4.3%
- Equity multiple
- 1.41×
- Total profit
- $25,809
- Equity at exit
- $70,646
Cash invested: $63,700 (down + closing). Projections, not guarantees.
Landlord ↔ Tenant lean methodology
- Overall (STATE)
- 87 Strongly Landlord-Friendly
- State Texas
- 87 Strongly Landlord-Friendly · R+5
- County
- — inherits STATE
- City
- — inherits STATE
ZIP-level market 77032
- Home prices YoY
- -0.1%
- Rents YoY
- -1.5%
- Active inventory
- 41
- Price-to-rent
- 15.1×
Monthly cashflow live
- Estimated rent
- $2,516 high interval (Pro) →
- Mortgage (P&I)
- −$1,193
- Tax from tax record
- −$377 /mo · $4,518/yr
- Insurance
- −$95
- HOA
- −$0
- Vacancy / Maint / Mgmt
- −$528
- Net cashflow
- $323
Break-even live
2-unit breakdown (identical units grouped — click to expand)
| Units | Beds | Baths | Est. rent |
|---|---|---|---|
| 2× units | 2 | 1 | $2,516 |
| #1 | 2 | 1 | $1,258 |
| #2 | 2 | 1 | $1,258 |
| Total (2 units) | $2,516 | ||
UW: 25.0% down · 7.5% · 30yr · 1.5% tax · 5.0% vac · 8.0% maint · 8.0% mgmt
Financing live
Cash to close
- Down payment
- $56,875
- Closing costs
- $6,825
- Reserves months
- —
- Total cash needed
- —
Loan-product check · same deal, 3 products live
Conventional
25% down · 7.5% · 30yr
- Down + closing
- —
- Monthly P&I
- —
- Monthly cashflow
- —
- DSCR
- —
- Eligible?
- —
Personal DTI + credit; lowest rate.
DSCR
20% down · 8.5% · 30yr
- Down + closing
- —
- Monthly P&I
- —
- Monthly cashflow
- —
- DSCR
- —
- Eligible?
- —
No personal income docs; deal must DSCR.
Hard money
10% down · 12.0% · 12mo
- Down + closing
- —
- Monthly P&I
- —
- Monthly cashflow
- —
- DSCR
- —
- Eligible?
- —
Short-term bridge; refi at stabilization.
Listing history 29 events
-
2026-06-18days on market $227,499 Active 332 DOM
-
2026-06-17days on market $227,499 Active 331 DOM
-
2026-06-16days on market $227,499 Active 330 DOM
-
2026-06-15days on market $227,499 Active 329 DOM
-
2026-06-13days on market $227,499 Active 327 DOM
-
2026-06-13days on market $227,499 Active 326 DOM
-
2026-06-09days on market $227,499 Active 323 DOM
-
2026-06-08days on market $227,499 Active 322 DOM
-
2026-06-07days on market $227,499 Active 321 DOM
-
2026-06-04days on market $227,499 Active 318 DOM
-
2026-06-03days on market $227,499 Active 317 DOM
-
2026-06-02days on market $227,499 Active 316 DOM
-
2026-06-01days on market $227,499 Active 315 DOM
-
2026-05-31days on market $227,499 Active 314 DOM
-
2025-07-21$227,499 Active 768-char remark
Show marketing remark (768 chars)
NEW LISTING! UNRESTRICTED DUPLEX for sale at a great price! You can live in one unit and collect rent from the other unit. Each unit has two bedrooms and one bathroom. This property is located near IAH airport and Greenspoint; with easy access to Beltway 8. Features for these units include a tile exposed fireplace, built-in bookshelf, tile flooring throughout the living area and kitchen, and a well-designed spacious floorplan! Unit #A was recently updated including new ceiling fans and fixtures, fresh paint, and new kitchen cabinets. WE MAKE IT EASY TO OWN. This is a great opportunity! Don't wait, call us today to get more information on the owner's easy terms and smooth process that may be able to put the deed in your name and make this your dream property.
-
2024-09-20historical
-
2024-09-18price $237,499
-
2024-09-09price $242,499
-
2023-09-01price $255,999
-
2022-06-17price $260,999
-
2021-11-16price $250,999
-
2021-07-20price $244,999
-
2021-05-20price $221,999
-
2020-10-06price $202,999
-
2020-08-12price $192,999
-
2020-02-06price $177,999
-
2019-09-04$185,999 Active
-
2016-05-11soldstatus $217,514
-
2016-05-11soldstatus $217,514
ⓘ Source: listings_history table (triggers on properties + properties_extension) + one-shot
backfill from property_details.listing_events for pre-trigger history.
Tax reassessment forecast TX · Resets to sale price
- Current annual tax
- $4,518 · $377/mo
- Projected year-2 tax
- $4,518 · $377/mo
- Expected delta
- $0/yr ($0/mo · 0.0%)
ⓘ Screening estimate from a state-policy table — verify with the county assessor before closing.
Climate risk First Street
- Flood 3/10 Moderate FEMA zone X (unshaded) · 20% chance over 30 yrs
- Wildfire 2/10 Low
- Heat 9/10 Extreme 7 d/yr ≥110°F today · 24 d/yr by 30 yrs out
- Wind 9/10 Extreme 99% chance of damaging wind over 30 yrs
- Air quality 3/10 Moderate 3 unhealthy d/yr today · 3 by 30 yrs out
Nearby sold comps map
Loading sold comps map…
Walkable amenities ~0.75 mi
Loading nearby amenities…
Taxation est. · year 1
- Rental income
- $30,192
- − Mortgage interest
- −$12,743
- − Property taxes
- −$4,518
- − Insurance
- −$1,137
- − Repairs & maintenance
- −$2,415
- − Management
- −$2,415
- − Depreciation
- −$6,618
- Taxable income
- $344
- Est. tax owed @ 24.0%
- −$82
- After-tax cash flow
- $3,797/yr
For passive investors: Depreciation is non-cash, so a rental often shows a tax loss while cash-flowing — sheltering income. Rental losses are passive: they offset passive income freely, and up to $25,000/yr can offset ordinary (W-2) income if you actively participate and your MAGI is under $100k (phasing out to $0 by $150k); unused losses carry forward. On sale, claimed depreciation is recaptured at up to 25%, and gains may owe capital-gains tax (a 1031 exchange can defer both). Figures are a year-1 estimate at your 24.0% rate — not tax advice; consult a CPA.
Schools (NCES district)
- District
- Aldine ISD
- NCES district ID
- 4807710
- Math proficiency
- 16% ▼ -23.00%
- Reading proficiency
- 21% ▼ -11.00%
- Median HH income
- $37,081
- Composite
- 15.42/100
- National rank
- #9317
- State rank
- #790 of 826 in TX
Livability — Houston
- Score
- 74/100
- State rank
- #184
- US rank
- #4771
Category grades
Schools grade is shown separately in the Schools card above.
Census & demographics
- County
- Harris County · 4,702,590 people
- City population
- 3,226,434
- Metro
- Houston-The Woodlands-Sugar Land, TX
- Population (ZIP)
- 12,403
- Household income
- $43,725
- Rent vs Own
- Severe rent burden
- 944.0
Population outlook (Harris County) Hauer SSP2
- Today (2025)
- 5,571,493 people
- By 2030
- 6,089,821 · +9.3%
- By 2040
- 7,142,806 · +28.2%
- By 2050
- 8,185,864 · +46.9%
- By 2075
- 10,574,329 · +89.8%
- By 2100
- 12,109,958 · +117.4%
Race, ethnicity, and origin ACS 2023
- Neighborhood character
- Diverse neighborhood (Simpson 0.62)
- Race & ethnicity
- Hispanic / Latino 48% Black 37% Two or more races 22% White 8% Native American 2%
- Hispanic origin (detail)
- Mexican 39%
- Common ancestry
- Slovak 2%
- Foreign-born
- 24% · Canada, China
- Languages at home
- 58% English-only · Spanish 42%
Political lean MEDSL · Harris
- 2024 margin
- Lean D (+5.5) · D 52.0% · R 46.4% · Other 1.6%
- 2008→2024 swing
- +3.9pp toward D · 2008: 1.6pp · 2024: 5.5pp
- All cycles
- 2024: D+5.5 2020: D+13.3 2016: D+12.4 2012: D+0.1 2008: D+1.6
Not yet ingested
- Civics
- —
Market trends
- HPI YoY
- ▼ -0.39%
- Current HPI
- 336.6839
- Rent YoY
- ▼ -1.51%
- Metro
- Houston-The Woodlands-Sugar Land, TX
- State GDP YoY
- ▲ 3.95%
- F500 in state
- 110
Industry mix (Fortune 500 HQ in TX)
| Industry | F500 HQs | Revenue |
|---|---|---|
| Energy | 16 | $1,198B |
|
||
| Technology | 5 | $198B |
|
||
| Engineering / Construction | 4 | $72B |
|
||
| Energy Services | 3 | $60B |
|
||
| Utilities | 3 | $41B |
|
||
| Healthcare | 2 | $330B |
|
||
Price history
+4.6% since first listed15 events — show timeline
- 2025-07-21 Listed $227,499 HARMLS
- 2024-09-20 Listing Removed — HARMLS
- 2024-09-18 Price Changed $237,499 HARMLS
- 2024-09-09 Price Changed $242,499 HARMLS
- 2023-09-01 Price Changed $255,999 HARMLS
- 2022-06-17 Price Changed $260,999 HARMLS
- 2021-11-16 Price Changed $250,999 HARMLS
- 2021-07-20 Price Changed $244,999 HARMLS
- 2021-05-20 Price Changed $221,999 HARMLS
- 2020-10-06 Price Changed $202,999 HARMLS
- 2020-08-12 Price Changed $192,999 HARMLS
- 2020-02-06 Price Changed $177,999 HARMLS
- 2019-09-04 Listed $185,999 HARMLS
- 2016-05-11 Sold (Public Records) $217,514 Public Records
- 2016-05-11 Sold (Public Records) $217,514 Public Records
Property tax history
+4.2%/yrLatest (2025): $4,518 · +3.8% YoY. Source: county tax records.
Cash-flow waterfall
monthlySold comps — $/sqft
last 12 mo · ≤1 miLoading sold comps…