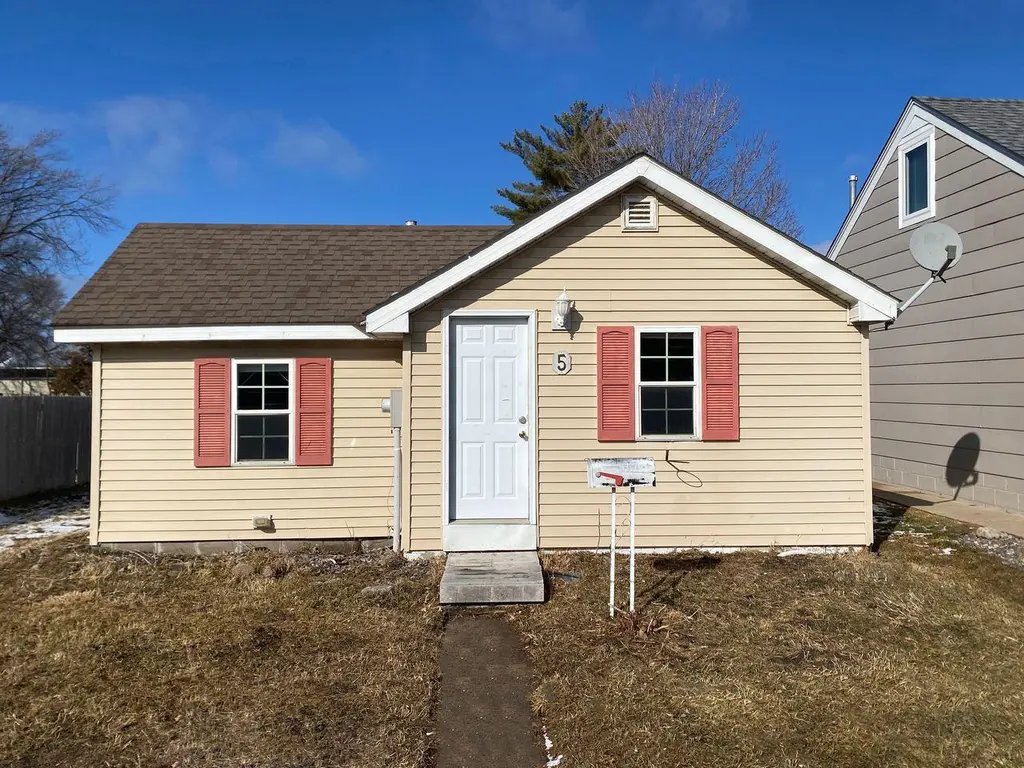
5 8th St NW · Buffalo, MN
Flood risk 1/10 · Minimal
- FEMA flood zone
- X
- Chance of flooding over 30 yrs
- 0.0%
- Est. flood insurance / yr
- $507 – $1,088
Fire risk 1/10 · Minimal
- Est. fire insurance / yr
- $888 – $1,650
Heat risk 2/10 · Minimal
- Hot days now (above 99°F)
- 7 days/yr
- Hot days in 30 yrs
- 14 days/yr
Wind risk 2/10 · Minimal
- Chance of severe wind over 30 yrs
- —
Air-quality risk 2/10 · Minimal
- Unhealthy air days now
- 2 days/yr
- Unhealthy air days in 30 yrs
- 2 days/yr
Risk factors via First Street. Map © Google.
Why this score? — see what drove the B grade
The composite is a weighted blend of 9 inputs, each scored 0–100. Each bar is that input's sub-score; the figure is the points it added to the 100-point composite (weight × sub-score).
- Cash flow +30.0/30.0
- 1% rule +10.0/10.0
- DSCR +10.0/10.0
- ARV discount +7.5/15.0
- Schools +4.8/10.0
- Livability +4.0/5.0
- Rent growth +2.5/5.0
- Condition / age +2.5/5.0
- Appreciation +0.0/10.0
$65,000
🖨 Deal sheet 📄 Offer letter ✓ Due diligence
Listing remarks MLS
Why rent when you can own! Freshly painted, newer carpet and luxury vinyl plank flooring. Big fenced in private backyard with storage shed, off-street parking, convenient location. Great investment/rental property. See it today!
Key facts
- Privacy fence
- Storage shed
- Convenient location
Tags
Property features AI
Finance
- Other: Lot size approximately 0.15 acres; City street with paved public road frontage
- Financial info:
- HOA & community:
Exterior
- Parking: Gravel parking
- Security:
- Utilities: City water connected; City sewer connected; Natural gas available
- Home design: Residential property; One level
- Construction: Foundation area approximately 481; Other foundation type
- Exterior features: Vinyl exterior; Storage shed
Interior
- Kitchen:
- Bedrooms: 1 bedroom
- Flooring:
- Bathrooms: 1 full bathroom; Bathroom rough-in
- Heating & cooling: No heating; No cooling
- Interior features: Main floor laundry; Crawl space/partial basement
- Laundry & utility: Laundry on main level
Neighborhood map
What this means for you Summary
Snapshot
- This is a 1-bed/1.0-bath single-family listed at $65k.
Deal economics
- At list price, monthly cash flow is $400 ($5k/yr) — positive.
- The deal already cash-flows at list — no discount required.
- Meets the 1% rule at list price ($1k rent vs $65k).
- Recommended offer: $63k (3.0% below list) — sets the bar for market timing.
- Cap rate 13.7% vs local median 2.8% in Buffalo — top-decile yield for the area; either an underpriced asset or a hidden risk that comps aren't pricing in. Stress-test before assuming the spread holds.
Location & tenants
- Location reads 79/100 on livability (#94 in MN, #2,114 nationally) — a middle-class / working-renter tenant base. Strengths: crime A+, housing A+, health & safety A+; Watch: amenities F, commute F.
- Buffalo-Hanover-Montrose Public Schools (town): math 52% / reading 56% proficiency, ranked #63 of 301 in MN (top 21%) — acceptable for families but not a draw, mixed tenant base, ~2y average lease; only 18% free/reduced lunch — higher-income household profile.
- Market conditions: 169 active listings in the ZIP; solid renter incomes; 1,260 units permitted in Wright County in 2024 (180 in 5+ unit buildings).
- This rent is only 14% of the median local income ($92k/yr) — well below the 30% rent-burden line; pricing power to push rent on renewal without tenant pushback.
Forward outlook
- Local home prices are declining (-3.0%/yr); year-one equity from $449 of loan paydown is wiped out by about $2k of value loss. Plan a longer hold.
- Wright County population projected at +9% by 2050 — modest demand growth; plan on rents tracking national, not racing it.
- At projected returns (-3.0% appreciation + 3.0% rent growth), your $18k cash investment doubles in ~5 years — after that, you're playing with house money.
Negotiation context
- It's been on market 35 days — a 3% lower offer ($63k) is reasonable based on typical stale-listing flexibility.
- 10 sale attempts since 29y ago; this cycle's ask has dropped $10k (13%) from the opening price — seller is motivated, your offer sets the floor, not the list.
Risks & watch-outs
- Watch-outs: built in 1910 — expect roof / HVAC / electrical / plumbing capex.
Questions for the listing agent
- It's been on market 35 days. Have you received any prior offers? Is the seller open to a 3% concession, seller financing, or rate buy-down credit?
- Built in 1910 — when were the roof, HVAC, electrical panel, plumbing, and water heater last replaced?
- Is there a deadline driving the sale (1031 exchange, divorce, estate, relocation)? That informs how much negotiation room exists.
- Schools are A-rated — typically a magnet for longer-tenancy family renters. What's the average tenant stay here, and is there a school-zone premium baked into asking?
- What's the average days-on-market for RENTAL listings here right now (not sales)? A rising rental-DOM trend means longer vacancies and softer asking-rent achievability than the comps imply.
- What's the recent tenant-quality profile in this submarket — average credit score on applications, eviction rate, late-payment / NSF rate, and stable-employment percentage? A property-management company in the area should have these aggregated.
- How much new for-sale + rental construction is in the pipeline within 1–3 miles? Heavy new supply typically softens prices + rents 12–24 months out; constrained supply supports both.
Investment metrics
- 1% rule
- 1.71% ✓
- Cap rate
- 13.68%
- Cash-on-cash
- 26.37%
- DSCR
- 2.17
- GRM
- 4.9
CMA / ARV
No comps found within radius.
Projected returns pro-forma
-3.0% appreciation · 3.0% rent growth · sell at horizon
- IRR
- 20.2%
- Equity multiple
- 1.82×
- Total profit
- $14,972
- Equity at exit
- $9,692
- IRR
- 28.4%
- Equity multiple
- 3.53×
- Total profit
- $45,973
- Equity at exit
- $5,620
Cash invested: $18,200 (down + closing). Projections, not guarantees.
Landlord ↔ Tenant lean methodology
- Overall (STATE)
- 46 Balanced
- State Minnesota
- 46 Balanced · D+2
- County
- — inherits STATE
- City
- — inherits STATE
ZIP-level market 55313
- Home prices YoY
- -24.6%
- Active inventory
- 169
- Price-to-rent
- 4.9×
Monthly cashflow live
- Estimated rent
- $1,110 medium interval (Pro) →
- Mortgage (P&I)
- −$341
- Tax from tax record
- −$109 /mo · $1,306/yr
- Insurance
- −$27
- HOA
- −$0
- Vacancy / Maint / Mgmt
- −$233
- Net cashflow
- $400
Break-even live
UW: 25.0% down · 7.5% · 30yr · 1.5% tax · 5.0% vac · 8.0% maint · 8.0% mgmt
Financing live
Cash to close
- Down payment
- $16,250
- Closing costs
- $1,950
- Reserves months
- —
- Total cash needed
- —
Loan-product check · same deal, 3 products live
Conventional
25% down · 7.5% · 30yr
- Down + closing
- —
- Monthly P&I
- —
- Monthly cashflow
- —
- DSCR
- —
- Eligible?
- —
Personal DTI + credit; lowest rate.
DSCR
20% down · 8.5% · 30yr
- Down + closing
- —
- Monthly P&I
- —
- Monthly cashflow
- —
- DSCR
- —
- Eligible?
- —
No personal income docs; deal must DSCR.
Hard money
10% down · 12.0% · 12mo
- Down + closing
- —
- Monthly P&I
- —
- Monthly cashflow
- —
- DSCR
- —
- Eligible?
- —
Short-term bridge; refi at stabilization.
Listing history 40 events
-
2026-06-18days on market $65,000 Active 35 DOM
-
2026-06-17days on market $65,000 Active 34 DOM
-
2026-06-16days on market $65,000 Active 33 DOM
-
2026-06-15days on market $65,000 Active 32 DOM
-
2026-06-13days on market $65,000 Active 30 DOM
-
2026-06-13pricedays on market $65,000 Active 29 DOM
-
2026-06-09days on market $75,000 Active 26 DOM
-
2026-06-08days on market $75,000 Active 25 DOM
-
2026-06-07days on market $75,000 Active 24 DOM
-
2026-06-04days on market $75,000 Active 21 DOM
-
2026-06-03days on market $75,000 Active 20 DOM
-
2026-06-01days on market $75,000 Active 18 DOM
-
2026-05-31days on market $75,000 Active 17 DOM
-
2026-05-14$75,000 Active
-
2022-06-03historical
-
2022-04-15$89,000 Active
-
2022-04-12historical
-
2019-12-13historical 228-char remark
Show marketing remark (228 chars)
Why rent when you can own! Freshly painted, newer carpet and luxury vinyl plank flooring. Big fenced in private backyard with storage shed, off-street parking, convenient location. Great investment/rental property. See it today!
-
2019-12-13soldstatus $78,500 Sold 228-char remark
Show marketing remark (228 chars)
Why rent when you can own! Freshly painted, newer carpet and luxury vinyl plank flooring. Big fenced in private backyard with storage shed, off-street parking, convenient location. Great investment/rental property. See it today!
-
2019-11-20status Pending 228-char remark
Show marketing remark (228 chars)
Why rent when you can own! Freshly painted, newer carpet and luxury vinyl plank flooring. Big fenced in private backyard with storage shed, off-street parking, convenient location. Great investment/rental property. See it today!
-
2019-11-14historical Contingent - Inspection 228-char remark
Show marketing remark (228 chars)
Why rent when you can own! Freshly painted, newer carpet and luxury vinyl plank flooring. Big fenced in private backyard with storage shed, off-street parking, convenient location. Great investment/rental property. See it today!
-
2019-10-14price $79,900 228-char remark
Show marketing remark (228 chars)
Why rent when you can own! Freshly painted, newer carpet and luxury vinyl plank flooring. Big fenced in private backyard with storage shed, off-street parking, convenient location. Great investment/rental property. See it today!
-
2019-08-30price $82,900 228-char remark
Show marketing remark (228 chars)
Why rent when you can own! Freshly painted, newer carpet and luxury vinyl plank flooring. Big fenced in private backyard with storage shed, off-street parking, convenient location. Great investment/rental property. See it today!
-
2019-07-22$89,900 Active 228-char remark
Show marketing remark (228 chars)
Why rent when you can own! Freshly painted, newer carpet and luxury vinyl plank flooring. Big fenced in private backyard with storage shed, off-street parking, convenient location. Great investment/rental property. See it today!
-
2008-06-29historical
-
2008-01-08$105,900
-
2005-04-12soldstatus $68,775
-
2005-03-31soldstatus $68,777
-
2005-03-15historical
-
2005-03-01$64,777
-
2004-11-21historical
-
2004-08-21$59,900
-
2004-06-09historical
-
2004-03-09$69,900
-
1998-10-01historical
-
1998-07-01$39,900
-
1998-06-30historical
-
1997-12-04$39,900
-
1997-11-28historical
-
1997-08-25$39,900
ⓘ Source: listings_history table (triggers on properties + properties_extension) + one-shot
backfill from property_details.listing_events for pre-trigger history.
Tax reassessment forecast MN · Partial reset (capped growth)
- Current annual tax
- $1,306 · $109/mo
- Projected year-2 tax
- $1,306 · $109/mo
- Expected delta
- $0/yr ($0/mo · 0.0%)
ⓘ Screening estimate from a state-policy table — verify with the county assessor before closing.
Climate risk First Street
- Flood 1/10 Low FEMA zone X · 0% chance over 30 yrs
- Wildfire 1/10 Low
- Heat 2/10 Low 7 d/yr ≥99°F today · 14 d/yr by 30 yrs out
- Wind 2/10 Low
- Air quality 2/10 Low 2 unhealthy d/yr today · 2 by 30 yrs out
Nearby sold comps map
Loading sold comps map…
Walkable amenities ~0.75 mi
Loading nearby amenities…
Taxation est. · year 1
- Rental income
- $13,317
- − Mortgage interest
- −$3,641
- − Property taxes
- −$1,306
- − Insurance
- −$325
- − Repairs & maintenance
- −$1,065
- − Management
- −$1,065
- − Depreciation
- −$1,891
- Taxable income
- $4,023
- Est. tax owed @ 24.0%
- −$966
- After-tax cash flow
- $3,833/yr
For passive investors: Depreciation is non-cash, so a rental often shows a tax loss while cash-flowing — sheltering income. Rental losses are passive: they offset passive income freely, and up to $25,000/yr can offset ordinary (W-2) income if you actively participate and your MAGI is under $100k (phasing out to $0 by $150k); unused losses carry forward. On sale, claimed depreciation is recaptured at up to 25%, and gains may owe capital-gains tax (a 1031 exchange can defer both). Figures are a year-1 estimate at your 24.0% rate — not tax advice; consult a CPA.
Schools (NCES district)
- District
- Buffalo-Hanover-Montrose Public Schools
- NCES district ID
- 2707200
- Math proficiency
- 52% ▼ -13.00%
- Reading proficiency
- 56% ▼ -9.00%
- Median HH income
- $72,549
- Composite
- 48.25/100
- National rank
- #2159
- State rank
- #63 of 301 in MN
Livability — Buffalo
- Score
- 79/100
- State rank
- #94
- US rank
- #2114
Category grades
Schools grade is shown separately in the Schools card above.
Census & demographics
- Census place
- Buffalo, MN
- County
- Wright County · 79,164 people
- City population
- 24,913
- Metro
- Minneapolis-St. Paul-Bloomington, MN-WI
- Population (ZIP)
- 24,913
- Household income
- $92,455
- Rent vs Own
- Severe rent burden
- 354.0
Population outlook (Wright County) Hauer SSP2
- Today (2025)
- 142,526 people
- By 2030
- 146,915 · +3.1%
- By 2040
- 153,625 · +7.8%
- By 2050
- 155,416 · +9.0%
- By 2075
- 150,352 · +5.5%
- By 2100
- 130,631 · -8.3%
Race, ethnicity, and origin ACS 2023
- Neighborhood character
- Predominantly White (92%)
- Race & ethnicity
- White 92% Two or more races 5% Hispanic / Latino 4% Asian 1%
- Common ancestry
- Portuguese 11% Romanian 4% Lithuanian 3%
- Foreign-born
- 4% · Canada
- Languages at home
- 94% English-only · Spanish 3% German/W. Germanic 1% Tagalog/Filipino 1%
Political lean MEDSL · Wright
- 2024 margin
- Strong R (+29.4) · D 34.4% · R 63.8% · Other 1.8%
- 2008→2024 swing
- -11.9pp toward R · 2008: -17.4pp · 2024: -29.4pp
- All cycles
- 2024: R+29.4 2020: R+28.6 2016: R+33.2 2012: R+21.4 2008: R+17.4
Not yet ingested
- Civics
- —
Market trends
- HPI YoY
- ▼ -71.68%
- Current HPI
- 219.6279
- Rent YoY
- —
- Metro
- Minneapolis-St. Paul-Bloomington, MN-WI
- State GDP YoY
- ▲ 2.41%
- F500 in state
- 34
Industry mix (Fortune 500 HQ in MN)
| Industry | F500 HQs | Revenue |
|---|---|---|
| Healthcare | 2 | $407B |
|
||
| Retail | 2 | $150B |
|
||
| Consumer Goods | 2 | $32B |
|
||
| Industrial Machinery | 2 | $6B |
|
||
| Agriculture | 1 | $40B |
|
||
| Healthcare / Medical Devices | 1 | $32B |
|
||
Price history
+88.0% since first listed27 events — show timeline
- 2026-05-14 Listed $75,000 NORTHSTARMLS as Distributed by MLS Grid
- 2022-06-03 Listing Removed — NORTHSTARMLS as Distributed by MLS Grid
- 2022-04-15 Listed $89,000 NORTHSTARMLS as Distributed by MLS Grid
- 2022-04-12 Coming Soon — NORTHSTARMLS as Distributed by MLS Grid
- 2019-12-13 Listing Removed — NORTHSTARMLS as Distributed by MLS Grid
- 2019-12-13 Sold (MLS) $78,500 NORTHSTARMLS as Distributed by MLS Grid
- 2019-11-20 Pending — NORTHSTARMLS as Distributed by MLS Grid
- 2019-11-14 Contingent — NORTHSTARMLS as Distributed by MLS Grid
- 2019-10-14 Price Changed $79,900 NORTHSTARMLS as Distributed by MLS Grid
- 2019-08-30 Price Changed $82,900 NORTHSTARMLS as Distributed by MLS Grid
- 2019-07-22 Listed $89,900 NORTHSTARMLS as Distributed by MLS Grid
- 2008-06-29 Listing Removed — NORTHSTARMLS as Distributed by MLS Grid
- 2008-01-08 Listed $105,900 NORTHSTARMLS as Distributed by MLS Grid
- 2005-04-12 Sold (Public Records) $68,775 Public Records
- 2005-03-31 Sold (MLS) $68,777 NORTHSTARMLS as Distributed by MLS Grid
- 2005-03-15 Listing Removed — NORTHSTARMLS as Distributed by MLS Grid
- 2005-03-01 Listed $64,777 NORTHSTARMLS as Distributed by MLS Grid
- 2004-11-21 Listing Removed — NORTHSTARMLS as Distributed by MLS Grid
- 2004-08-21 Listed $59,900 NORTHSTARMLS as Distributed by MLS Grid
- 2004-06-09 Listing Removed — NORTHSTARMLS as Distributed by MLS Grid
- 2004-03-09 Listed $69,900 NORTHSTARMLS as Distributed by MLS Grid
- 1998-10-01 Listing Removed — NORTHSTARMLS as Distributed by MLS Grid
- 1998-07-01 Listed $39,900 NORTHSTARMLS as Distributed by MLS Grid
- 1998-06-30 Listing Removed — NORTHSTARMLS as Distributed by MLS Grid
- 1997-12-04 Listed $39,900 NORTHSTARMLS as Distributed by MLS Grid
- 1997-11-28 Listing Removed — NORTHSTARMLS as Distributed by MLS Grid
- 1997-08-25 Listed $39,900 NORTHSTARMLS as Distributed by MLS Grid
Property tax history
+3.6%/yrLatest (2025): $1,306 · +33.3% YoY. Source: county tax records.
Cash-flow waterfall
monthlySold comps — $/sqft
last 12 mo · ≤1 miLoading sold comps…