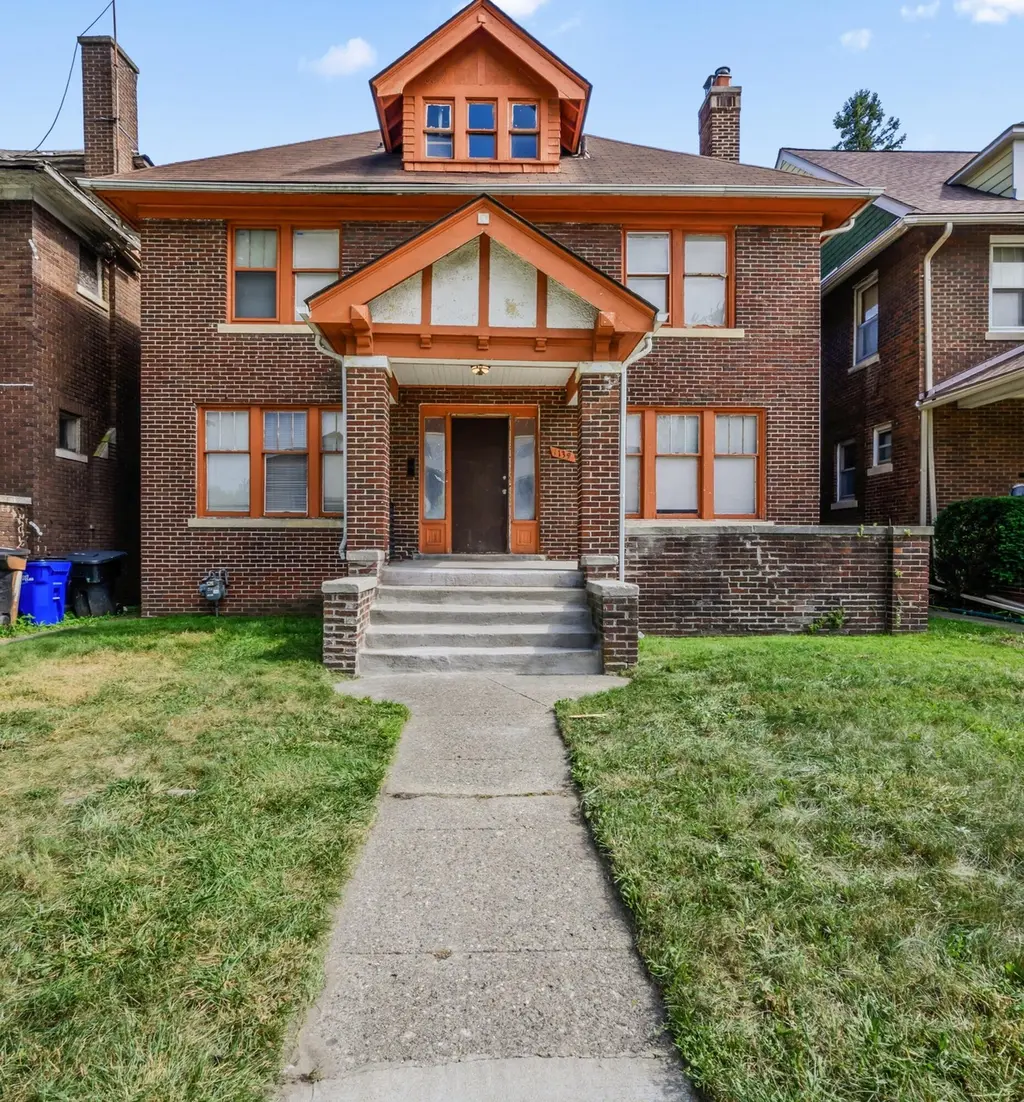
1139 Atkinson St · Detroit, MI
Flood risk 1/10 · Minimal
- FEMA flood zone
- X (unshaded)
- Chance of flooding over 30 yrs
- 0.0%
- Est. flood insurance / yr
- $507 – $1,088
Fire risk 1/10 · Minimal
- Est. fire insurance / yr
- $784 – $1,456
Heat risk 3/10 · Minor
- Hot days now (above 96°F)
- 7 days/yr
- Hot days in 30 yrs
- 15 days/yr
Wind risk 2/10 · Minimal
- Chance of severe wind over 30 yrs
- —
Air-quality risk 4/10 · Minor
- Unhealthy air days now
- 4 days/yr
- Unhealthy air days in 30 yrs
- 6 days/yr
Risk factors via First Street. Map © Google.
Why this score? — see what drove the C- grade
The composite is a weighted blend of 9 inputs, each scored 0–100. Each bar is that input's sub-score; the figure is the points it added to the 100-point composite (weight × sub-score).
- Cash flow +23.4/30.0
- DSCR +7.5/10.0
- ARV discount +7.5/15.0
- 1% rule +7.0/10.0
- Livability +3.7/5.0
- Condition / age +2.5/5.0
- Schools +1.3/10.0
- Rent growth +1.2/5.0
- Appreciation +0.0/10.0
$169,900
🖨 Deal sheet (PDF) 📄 Offer letter ✓ Due diligence
Listing remarks MLS
Welcome to Detroit's prestigious Boston-Edison Historic District, where timeless architecture meets modern comfort. This spacious 4-bedroom, 1.5-bath brick home showcases classic charm with beautiful hardwood floors throughout and thoughtfully updated living spaces. The updated kitchen offers both style and functionality, while the formal dining room and expansive living room with adjoining sunroom create the perfect setting for entertaining or relaxing in natural light. Upstairs, you'll find generously sized bedrooms designed to provide comfort and flexibility for today's lifestyle. Ideally located, this home offers convenient access to major freeways and is just minutes from downtown Detroit, where you can enjoy dining, entertainment, and cultural attractions. Don't miss the opportunity to own a piece of Detroit history--schedule your showing today!
Key facts
- 5,227 sq ft lot
- Built 1917
- Listed 16 days
Property features AI
Exterior
- Home design: Colonial style; Single-family residential property; Public water
- Construction: Brick construction; Built in 1917; Full basement
- Exterior features: Sidewalk
Interior
- Kitchen: Kitchen
- Bedrooms: Primary bedroom; Bedroom 2; Bedroom 3; Bedroom 4
- Bathrooms: 1 full bathroom; 1 half bathroom
- Heating & cooling: Forced air heating
- Interior features: Fireplace; Total of 9 rooms
Neighborhood map
What this means for you Summary
Snapshot
- This is a 4-bed/2.0-bath single-family listed at $170k.
Deal economics
- At list price, monthly cash flow is $316 ($4k/yr) — positive.
- The deal already cash-flows at list — no discount required.
- Meets the 1% rule at list price ($2k rent vs $170k).
- Recommended offer: $167k (1.5% below list) — sets the bar for market timing.
Location & tenants
- Location reads 73/100 on livability (#218 in MI) — a middle-class / working-renter tenant base. Strengths: amenities A+, commute A+, cost of living A+; Watch: schools F, crime F, employment F.
- Detroit Public Schools Community District (urban): math 10% / reading 24% proficiency, ranked #499 of 540 in MI (top 92%) — low school quality limits family demand, transient renter base, plan for 1-2y turnover; 90% free/reduced lunch — lower-income household profile, screen leases tightly.
- Market conditions: Rents falling (-5.1%/yr); 257 active listings in the ZIP; 33 comparable units currently listed for rent nearby; rentals at typical pace (median 16d on market — plan ~3-4 weeks tenant-placement turnaround); lower-income renter base — watch delinquency; 2,639 units permitted in Wayne County in 2024 (1,216 in 5+ unit buildings).
- At $2,040/mo this rent would consume 56% of the median local household income ($44k/yr) (locally 1258% of renters already pay >50% of income on rent) — very limited rent-growth headroom before tenants either downsize or default.
Forward outlook
- Local home prices are declining (-3.0%/yr); year-one equity from $1k of loan paydown is wiped out by about $5k of value loss. Plan a longer hold.
- Wayne County population projected at -17% by 2050 — secular population decline; favor cash flow + early exit over multi-decade hold.
Negotiation context
- It's been on market 16 days — a 2% lower offer ($167k) is reasonable based on typical stale-listing flexibility.
- 14 sale attempts since 15y ago with the ask held roughly flat each time — persistent listings suggest the price (not the market) is what's stuck; bring a comps-based counter.
- Current owner paid $125k; 36% above their basis — modest negotiation headroom, anchor on the comps not their cost.
Risks & watch-outs
- Watch-outs: built in 1917 — expect roof / HVAC / electrical / plumbing capex.
Questions for the listing agent
- Built in 1917 — when were the roof, HVAC, electrical panel, plumbing, and water heater last replaced?
- Is there a deadline driving the sale (1031 exchange, divorce, estate, relocation)? That informs how much negotiation room exists.
- Schools are F-rated, which usually means shorter tenancies and higher turnover. Who's the typical renter profile here, and what's been the actual vacancy rate?
- Crime grade is F in this area — have there been break-ins, vandalism, or insurance claims at this property in the last 3 years? What carrier currently insures it and at what premium?
- What's the average days-on-market for RENTAL listings here right now (not sales)? A rising rental-DOM trend means longer vacancies and softer asking-rent achievability than the comps imply.
- What's the recent tenant-quality profile in this submarket — average credit score on applications, eviction rate, late-payment / NSF rate, and stable-employment percentage? A property-management company in the area should have these aggregated.
- How much new for-sale + rental construction is in the pipeline within 1–3 miles? Heavy new supply typically softens prices + rents 12–24 months out; constrained supply supports both.
Investment metrics
- 1% rule
- 1.20% ✓
- Cap rate
- 8.52%
- Cash-on-cash
- 7.96%
- DSCR
- 1.35
- GRM
- 6.9
CMA / ARV
- ARV (median comp)
- $357,588
- List price
- $169,900
- Delta
- -52.49%
- Verdict
- UNDERPRICED
- Comps
- 20 within 1.0 mi
Show comp detail 12 sales within ~0.75 mi
| Address | Dist | Beds/Ba | Sqft | Sold | Price | $/sf | Match |
|---|---|---|---|---|---|---|---|
| 1129 Atkinson St | 0.01mi | 4/2.5 | 2,288 (+13%) | 4mo | $15,000 | $7 | 73 |
| 1423 Longfellow St | 0.20mi | 3/2.5 (-1) | 1,915 (-5%) | 5mo | $135,000 | $70 | 70 |
| 80 Glynn Ct | 0.62mi | 4/2.0 | 2,058 (+2%) | 0mo | $365,000 | $177 | 68 |
| 1485 Longfellow St | 0.25mi | 4/2.5 | 2,215 (+9%) | 5mo | $195,000 | $88 | 67 |
| 2011 Atkinson St | 0.56mi | 4/2.0 | 2,084 (+3%) | 3mo | $245,000 | $118 | 66 |
| 1419 Atkinson St | 0.15mi | 5/2.5 (+1) | 2,274 (+12%) | 1mo | $225,000 | $99 | 64 |
| 2016 Atkinson St | 0.57mi | 5/2.5 (+1) | 2,001 (-1%) | 3mo | $130,000 | $65 | 62 |
| 693 Calvert St | 0.53mi | 4/1.5 | 1,914 (-5%) | 4mo | $109,000 | $57 | 61 |
| 740 Pingree St | 0.43mi | 4/2.0 | 1,846 (-9%) | 5mo | $170,000 | $92 | 61 |
| 2281 Atkinson St | 0.73mi | 4/1.5 | 2,103 (+4%) | 4mo | $325,000 | $155 | 54 |
| 2041 Atkinson St | 0.60mi | 4/2.5 | 2,308 (+14%) | 2mo | $235,000 | $102 | 45 |
| 89 Hague St | 0.74mi | 5/3.5 (+1) | 2,154 (+6%) | 5mo | $175,000 | $81 | 39 |
Match score weights: distance 35% · size 25% · config 20% · recency 20%. Top-matched comps best support the ARV.
Projected returns pro-forma
-3.0% appreciation · 0.0% rent growth · sell at horizon
- IRR
- -7.9%
- Equity multiple
- 0.72×
- Total profit
- $-13,308
- Equity at exit
- $25,333
- IRR
- -3.1%
- Equity multiple
- 0.82×
- Total profit
- $-8,385
- Equity at exit
- $14,690
Cash invested: $47,572 (down + closing). Projections, not guarantees.
Landlord ↔ Tenant lean methodology
- Overall (STATE)
- 62 Landlord-Friendly
- State Michigan
- 62 Landlord-Friendly · EVEN
- County
- — inherits STATE
- City
- — inherits STATE
ZIP-level market 48202
- Rents YoY
- -5.1%
- Active inventory
- 257
- Price-to-rent
- 6.9×
Monthly cashflow live
- Estimated rent
- $2,040 high interval (Pro) →
- Mortgage (P&I)
- −$891
- Tax from tax record
- −$334 /mo · $4,009/yr
- Insurance
- −$71
- HOA
- −$0
- Vacancy / Maint / Mgmt
- −$428
- Net cashflow
- $316
Break-even live
Sensitivity live
| Price | -10% $412 | -5% $364 | +0% $316 | +5% $267 | +10% $219 |
|---|---|---|---|---|---|
| Rent | -10% $154 | -5% $235 | +0% $316 | +5% $396 | +10% $477 |
| Rate | -1.0pp $401 | -0.5pp $359 | base $316 | +0.5pp $271 | +1.0pp $227 |
UW: 25.0% down · 7.5% · 30yr · 1.5% tax · 5.0% vac · 8.0% maint · 8.0% mgmt
Financing live
Cash to close
- Down payment
- $42,475
- Closing costs
- $5,097
- Reserves months
- —
- Total cash needed
- —
Loan-product check · same deal, 3 products live
Conventional
25% down · 7.5% · 30yr
- Down + closing
- —
- Monthly P&I
- —
- Monthly cashflow
- —
- DSCR
- —
- Eligible?
- —
Personal DTI + credit; lowest rate.
DSCR
20% down · 8.5% · 30yr
- Down + closing
- —
- Monthly P&I
- —
- Monthly cashflow
- —
- DSCR
- —
- Eligible?
- —
No personal income docs; deal must DSCR.
Hard money
10% down · 12.0% · 12mo
- Down + closing
- —
- Monthly P&I
- —
- Monthly cashflow
- —
- DSCR
- —
- Eligible?
- —
Short-term bridge; refi at stabilization.
Rent comps 33 comps
| Address | Beds | Baths | Sqft | Rent | $/sqft | DOM | Units | Dist |
|---|---|---|---|---|---|---|---|---|
| 634 Atkinson St Detroit, MI | 3.0 | 3.5 | 3000 | $6,500 | $2.17 | 10d | 1 | 0.35mi |
| 1418 W Euclid St Detroit, MI | 3.0 | 1.0 | 2264 | $1,200 | $0.53 | 44d | 1 | 0.50mi |
| 1441 W Euclid St Detroit, MI | 3.0 | 1.0 | 2380 | $2,600 | $1.09 | 25d | 1 | 0.54mi |
| 1699 Glynn Ct Detroit, MI | 5.0 | 3.5 | 2542 | $2,500 | $0.98 | 22d | 1 | 0.54mi |
| 2028 Gladstone St Unit 1 Detroit, MI | 5.0 | 2.0 | 2500 | $2,850 | $1.14 | 3d | 1 | 0.62mi |
| 1929 Calvert Ave Unit 2 Detroit, MI | 3.0 | 1.0 | 1414 | $1,199 | $0.85 | 15d | 1 | 0.66mi |
| 2080 Gladstone St #1 Detroit, MI | 4.0 | 2.0 | 2426 | $3,000 | $1.24 | 2d | 1 | 0.67mi |
| 216 Holbrook St Detroit, MI | 4.0 | 2.0 | 2000 | $2,000 | $1.00 | 22d | 1 | 0.74mi |
| 216 Holbrook Unit Na Detroit, MI | 4.0 | 2.0 | 2000 | $2,200 | $1.10 | 2d | 1 | 0.74mi |
| 2302 Hazelwood St Unit 1 Detroit, MI | 3.0 | 1.0 | 1550 | $1,273 | $0.82 | 25d | 1 | 0.77mi |
| 8951 La Salle Blvd Detroit, MI | 5.0 | 2.5 | 2440 | $2,500 | $1.02 | 15d | 1 | 0.83mi |
| 8951 La Salle Blvd Detroit, MI | 4.0 | 2.5 | 2440 | $2,500 | $1.02 | 2d | 1 | 0.83mi |
| 8951 La Salle Blvd Unit NA Detroit, MI | 4.0 | 2.5 | 2440 | $2,500 | $1.02 | 10d | 1 | 0.83mi |
| 330 Westminster St Detroit, MI | 3.0 | 1.0 | 1995 | $1,900 | $0.95 | 24d | 1 | 0.87mi |
| 330 Westminster St Unit NA Detroit, MI | 3.0 | 1.0 | 1995 | $1,900 | $0.95 | 44d | 1 | 0.87mi |
| 2047 Seward St Detroit, MI | 3.0 | 1.0 | 1421 | $1,523 | $1.07 | 5d | 1 | 0.88mi |
| 419 King St Detroit, MI | 3.0 | 1.0 | 1668 | $2,300 | $1.38 | 10d | 1 | 0.88mi |
| 505 Westminster St Detroit, MI | 3.0 | 1.0 | 1700 | $1,400 | $0.82 | 18d | 1 | 0.92mi |
| 2509 Gladstone St Unit 1 Detroit, MI | 3.0 | 2.0 | 3000 | $2,650 | $0.88 | 2d | 1 | 0.95mi |
| 2504 W Euclid St Unit 2506 Detroit, MI | 3.0 | 1.0 | 1475 | $1,675 | $1.14 | 44d | 1 | 1.02mi |
| 2506 W Euclid St Detroit, MI | 3.0 | 1.0 | 1475 | $1,675 | $1.14 | 44d | 1 | 1.03mi |
| 2504 W Euclid St Unit 2504 Detroit, MI | 3.0 | 1.0 | 1475 | $1,650 | $1.12 | 44d | 1 | 1.03mi |
| 528 E Philadelphia St Detroit, MI | 3.0 | 1.0 | 1625 | $2,400 | $1.48 | 2d | 1 | 1.03mi |
| 41 Richton St Highland Park, MI | 5.0 | 2.0 | 1871 | $1,800 | $0.96 | 2d | 1 | 1.05mi |
| 41 Richton St Highland Park, MI | 5.0 | 2.0 | 1871 | $1,800 | $0.96 | 15d | 1 | 1.05mi |
| 2655 Collingwood St Detroit, MI | 4.0 | 1.5 | 1881 | $2,700 | $1.44 | 2d | 1 | 1.14mi |
| 2925 Calvert St Detroit, MI | 3.0 | 1.0 | 1400 | $1,300 | $0.93 | 17d | 1 | 1.23mi |
| 64 Glendale St Highland Park, MI | 4.0 | 1.0 | 1464 | $1,500 | $1.02 | 10d | 1 | 1.31mi |
| 101 Colorado St Unit NA Highland Park, MI | 4.0 | 1.5 | 1695 | $1,780 | $1.05 | 0d | 1 | 1.37mi |
| 3031 Lawrence St Detroit, MI | 4.0 | 1.0 | 1700 | $1,600 | $0.94 | 17d | 1 | 1.37mi |
| 165 Rhode Island St Highland Park, MI | 4.0 | 1.5 | 1639 | $1,200 | $0.73 | 18d | 1 | 1.38mi |
| 3241 Lawrence St Detroit, MI | 4.0 | 2.0 | 2636 | $1,800 | $0.68 | 17d | 1 | 1.44mi |
| 2474 Fullerton St Detroit, MI | 3.0 | 1.0 | 1400 | $1,300 | $0.93 | 15d | 1 | 1.44mi |
Listing history 39 events
-
2026-04-28$169,900 Active 872-char remark
Show marketing remark (863 chars)
Welcome to Detroit's prestigious Boston-Edison Historic District, where timeless architecture meets modern comfort. This spacious 4-bedroom, 1.5-bath brick home showcases classic charm with beautiful hardwood floors throughout and thoughtfully updated living spaces. The updated kitchen offers both style and functionality, while the formal dining room and expansive living room with adjoining sunroom create the perfect setting for entertaining or relaxing in natural light. Upstairs, you'll find generously sized bedrooms designed to provide comfort and flexibility for today's lifestyle. Ideally located, this home offers convenient access to major freeways and is just minutes from downtown Detroit, where you can enjoy dining, entertainment, and cultural attractions. Don't miss the opportunity to own a piece of Detroit history--schedule your showing today!
-
2026-04-28$169,900 Active 863-char remark
Show marketing remark (863 chars)
Welcome to Detroit's prestigious Boston-Edison Historic District, where timeless architecture meets modern comfort. This spacious 4-bedroom, 1.5-bath brick home showcases classic charm with beautiful hardwood floors throughout and thoughtfully updated living spaces. The updated kitchen offers both style and functionality, while the formal dining room and expansive living room with adjoining sunroom create the perfect setting for entertaining or relaxing in natural light. Upstairs, you'll find generously sized bedrooms designed to provide comfort and flexibility for today's lifestyle. Ideally located, this home offers convenient access to major freeways and is just minutes from downtown Detroit, where you can enjoy dining, entertainment, and cultural attractions. Don't miss the opportunity to own a piece of Detroit history--schedule your showing today!
-
2026-04-28$169,900 Active
Show marketing remark (863 chars)
Welcome to Detroit's prestigious Boston-Edison Historic District, where timeless architecture meets modern comfort. This spacious 4-bedroom, 1.5-bath brick home showcases classic charm with beautiful hardwood floors throughout and thoughtfully updated living spaces. The updated kitchen offers both style and functionality, while the formal dining room and expansive living room with adjoining sunroom create the perfect setting for entertaining or relaxing in natural light. Upstairs, you'll find generously sized bedrooms designed to provide comfort and flexibility for today's lifestyle. Ideally located, this home offers convenient access to major freeways and is just minutes from downtown Detroit, where you can enjoy dining, entertainment, and cultural attractions. Don't miss the opportunity to own a piece of Detroit history--schedule your showing today!
-
2025-10-29historical
-
2025-10-29historical
-
2025-09-03price $209,000
-
2025-09-03price $209,000
-
2025-09-03price $209,000
-
2025-08-08$215,000 Active
-
2025-08-08$215,000 Active
-
2025-07-01historical
-
2025-06-30historical
-
2025-05-09price $215,000
-
2025-05-09price $215,000
-
2025-05-09price $215,000
-
2025-03-24$220,000 Active
-
2025-03-24$220,000 Active
-
2023-10-10historical $1,450
-
2023-07-25$1,450
-
2018-07-03soldstatus $125,000
-
2018-06-28soldstatus $125,000 Sold
-
2018-06-28soldstatus $125,000 Closed
-
2018-06-07status Pending
-
2018-06-07status Pending
-
2018-05-29$125,000 Active
-
2018-05-29$125,000 Active
-
2017-02-14soldstatus $85,000
-
2017-02-03soldstatus $85,000 Sold
-
2017-02-03soldstatus $85,000 Closed
-
2017-01-17status Pending
-
2017-01-17status Pending
-
2017-01-16price $99,900
-
2017-01-15price $99,900
-
2017-01-05$125,000 Active
-
2017-01-05$125,000 Active
-
2012-11-05soldstatus $2,100
-
2012-11-05soldstatus $2,100
-
2011-07-26$2,100
-
2011-07-26$2,100
ⓘ Source: listings_history table (triggers on properties + properties_extension) + one-shot
backfill from property_details.listing_events for pre-trigger history.
Tax reassessment forecast MI · Partial reset (capped growth)
- Current annual tax
- $4,009 · $334/mo
- Projected year-2 tax
- $4,009 · $334/mo
- Expected delta
- $0/yr ($0/mo · 0.0%)
ⓘ Screening estimate from a state-policy table — verify with the county assessor before closing.
Climate risk First Street
- Flood 1/10 Low FEMA zone X (unshaded) · 0% chance over 30 yrs
- Wildfire 1/10 Low
- Heat 3/10 Moderate 7 d/yr ≥96°F today · 15 d/yr by 30 yrs out
- Wind 2/10 Low
- Air quality 4/10 Moderate 4 unhealthy d/yr today · 6 by 30 yrs out
Nearby sold comps map
Loading sold comps map…
Walkable amenities ~0.75 mi
Loading nearby amenities…
Taxation est. · year 1
- Rental income
- $24,476
- − Mortgage interest
- −$9,517
- − Property taxes
- −$4,009
- − Insurance
- −$850
- − Repairs & maintenance
- −$1,958
- − Management
- −$1,958
- − Depreciation
- −$4,943
- Taxable income
- $1,242
- Est. tax owed @ 24.0%
- −$298
- After-tax cash flow
- $3,488/yr
For passive investors: Depreciation is non-cash, so a rental often shows a tax loss while cash-flowing — sheltering income. Rental losses are passive: they offset passive income freely, and up to $25,000/yr can offset ordinary (W-2) income if you actively participate and your MAGI is under $100k (phasing out to $0 by $150k); unused losses carry forward. On sale, claimed depreciation is recaptured at up to 25%, and gains may owe capital-gains tax (a 1031 exchange can defer both). Figures are a year-1 estimate at your 24.0% rate — not tax advice; consult a CPA.
Schools (NCES district)
- District
- Detroit Public Schools Community District
- NCES district ID
- 2601103
- Math proficiency
- 10% ▼ -2.00%
- Reading proficiency
- 24% ▲ 6.00%
- Median HH income
- $25,815
- Composite
- 13.06/100
- National rank
- #9564
- State rank
- #499 of 540 in MI
Livability — Detroit
- Score
- 73/100
- State rank
- #218
- US rank
- #5427
Category grades
Schools grade is shown separately in the Schools card above.
Census & demographics
- Census place
- Detroit, MI
- County
- Wayne County · 1,562,939 people
- City population
- 572,865
- Metro
- Detroit-Warren-Dearborn, MI
- Population (ZIP)
- 15,780
- Household income
- $43,627
- Rent vs Own
- Severe rent burden
- 1258.0
Population outlook (Wayne County) Hauer SSP2
- Today (2025)
- 1,675,273 people
- By 2030
- 1,620,300 · -3.3%
- By 2040
- 1,502,341 · -10.3%
- By 2050
- 1,384,039 · -17.4%
- By 2075
- 1,124,592 · -32.9%
- By 2100
- 881,193 · -47.4%
Race, ethnicity, and origin ACS 2023
- Neighborhood character
- Diverse neighborhood (Simpson 0.57)
- Race & ethnicity
- Black 60% White 26% Asian 6% Two or more races 4% Hispanic / Latino 3%
- Common ancestry
- Romanian 3% Slovak 1% Lithuanian 1%
- Foreign-born
- 8% · Canada, Vietnam
- Languages at home
- 90% English-only · Other Indo-European 3% Arabic 2% Spanish 2%
Political lean MEDSL · Wayne
- 2024 margin
- Strong D (+29.0) · D 62.7% · R 33.7% · Other 3.6%
- 2008→2024 swing
- -20.5pp toward R · 2008: 49.5pp · 2024: 29.0pp
- All cycles
- 2024: D+29.0 2020: D+38.1 2016: D+37.3 2012: D+46.9 2008: D+49.5
Not yet ingested
- Civics
- —
Market trends
- HPI YoY
- ▼ -239.24%
- Current HPI
- 145.5509
- Rent YoY
- ▼ -5.13%
- Metro
- Detroit-Warren-Dearborn, MI
- State GDP YoY
- ▲ 1.37%
- F500 in state
- 28
Industry mix (Fortune 500 HQ in MI)
| Industry | F500 HQs | Revenue |
|---|---|---|
| Automotive Parts | 3 | $48B |
|
||
| Automotive | 2 | $372B |
|
||
| Chemicals | 1 | $45B |
|
||
| Automotive Retail | 1 | $29B |
|
||
| Healthcare / Medical Devices | 1 | $23B |
|
||
| Automotive Technology | 1 | $20B |
|
||
Price history
+7990.5% since first listed42 events — show timeline
- 2026-05-19 Pending — REALCOMP
- 2026-05-19 Pending — MiRealSource-MiMLS
- 2026-05-19 Pending — SW Michigan MLS
- 2026-04-28 Listed $169,900 SW Michigan MLS
- 2026-04-28 Listed $169,900 MiRealSource-MiMLS
- 2026-04-28 Listed $169,900 REALCOMP
- 2025-10-29 Listing Removed — REALCOMP
- 2025-10-29 Listing Removed — MiRealSource-MiMLS
- 2025-09-03 Price Changed $209,000 MiRealSource-MiMLS
- 2025-09-03 Price Changed $209,000 REALCOMP
- 2025-09-03 Price Changed $209,000 SW Michigan MLS
- 2025-08-08 Listed $215,000 REALCOMP
- 2025-08-08 Listed $215,000 MiRealSource-MiMLS
- 2025-07-01 Listing Removed — MiRealSource-MiMLS
- 2025-06-30 Listing Removed — REALCOMP
- 2025-05-09 Price Changed $215,000 MiRealSource-MiMLS
- 2025-05-09 Price Changed $215,000 REALCOMP
- 2025-05-09 Price Changed $215,000 SW Michigan MLS
- 2025-03-24 Listed $220,000 REALCOMP
- 2025-03-24 Listed $220,000 MiRealSource-MiMLS
- 2023-10-10 Rental Removed $1,450 APPFOLIO
- 2023-07-25 Listed for Rent $1,450 APPFOLIO
- 2018-07-03 Sold (Public Records) $125,000 Public Records
- 2018-06-28 Sold (MLS) $125,000 MiRealSource-MiMLS
- 2018-06-28 Sold (MLS) $125,000 REALCOMP
- 2018-06-07 Pending — MiRealSource-MiMLS
- 2018-06-07 Pending — REALCOMP
- 2018-05-29 Listed $125,000 MiRealSource-MiMLS
- 2018-05-29 Listed $125,000 REALCOMP
- 2017-02-14 Sold (Public Records) $85,000 Public Records
- 2017-02-03 Sold (MLS) $85,000 MiRealSource-MiMLS
- 2017-02-03 Sold (MLS) $85,000 REALCOMP
- 2017-01-17 Pending — MiRealSource-MiMLS
- 2017-01-17 Pending — REALCOMP
- 2017-01-16 Price Changed $99,900 MiRealSource-MiMLS
- 2017-01-15 Price Changed $99,900 REALCOMP
- 2017-01-05 Listed $125,000 MiRealSource-MiMLS
- 2017-01-05 Listed $125,000 REALCOMP
- 2012-11-05 Sold (MLS) $2,100 MiRealSource-MiMLS
- 2012-11-05 Sold (MLS) $2,100 REALCOMP
- 2011-07-26 Listed $2,100 MiRealSource-MiMLS
- 2011-07-26 Listed $2,100 REALCOMP
Property tax history
+3.9%/yrLatest (2025): $4,009 · +37.1% YoY. Source: county tax records.
Cash-flow waterfall
monthlySold comps — $/sqft
last 12 mo · ≤1 miLoading sold comps…