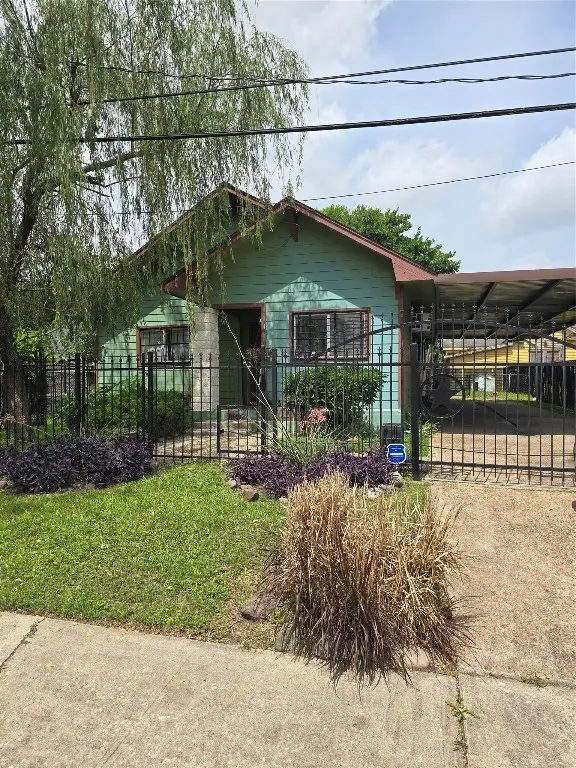
7106 Tierwester St · Houston, TX
Flood risk 5/10 · Moderate
- FEMA flood zone
- X (unshaded)
- Chance of flooding over 30 yrs
- 0.47%
- Est. flood insurance / yr
- $507 – $1,088
Fire risk 1/10 · Minimal
- Est. fire insurance / yr
- $1,222 – $2,270
Heat risk 9/10 · Severe
- Hot days now (above 109°F)
- 7 days/yr
- Hot days in 30 yrs
- 24 days/yr
Wind risk 9/10 · Severe
- Chance of severe wind over 30 yrs
- 99.0%
Air-quality risk 2/10 · Minimal
- Unhealthy air days now
- 2 days/yr
- Unhealthy air days in 30 yrs
- 2 days/yr
Risk factors via First Street. Map © Google.
Why this score? — see what drove the B- grade
The composite is a weighted blend of 9 inputs, each scored 0–100. Each bar is that input's sub-score; the figure is the points it added to the 100-point composite (weight × sub-score).
- Cash flow +30.0/30.0
- 1% rule +10.0/10.0
- DSCR +10.0/10.0
- ARV discount +7.5/15.0
- Livability +3.7/5.0
- Rent growth +3.0/5.0
- Schools +2.7/10.0
- Condition / age +2.5/5.0
- Appreciation +0.0/10.0
$145,000
🖨 Deal sheet 📄 Offer letter ✓ Due diligence
Listing remarks
Bring your vision! Situated close to the medical center, beltway 8 and highway 288, this fully fenced property is the ultimate blank canvas for investors or a savvy homeowner looking to build instant equity. The interior needs total cosmetics—including flooring, paint, and a modern refresh—the bones are solid, and the location cannot be beaten. Property is being sold AS-IS. Don't miss this opportunity to unlock the potential of this property and create a showstopper.
Key facts
- 5,401 sq ft lot
- 3 parking spots
- Built 1940
Property features AI
Finance
- Financial info: Lease not considered
Exterior
- Parking: Attached carport; Detached carport; Three carport spaces; Driveway; Additional parking; Electric gate
- Security: Security gate; Prewired for security; Owned security system
- Utilities: Public water; Public sewer; Asphalt road access
- Home design: Residential property; Built in 1940; Block foundation; Composition roof
- Construction: Cement siding; Wood siding
- Exterior features: Fully fenced private yard; Back yard fencing; Subdivision lot
Interior
- Kitchen: Kitchen on the first floor (12x13)
- Bedrooms: Three bedrooms on the first floor (12x15; 13x15; 13x12)
- Flooring: Carpet; Laminate
- Bathrooms: One full bathroom
- Heating & cooling: Central heating; Electric heating; Gas heating; Wall furnace; Central air conditioning; Electric cooling; Gas cooling; Window units; Thermostat (energy efficient)
- Interior features: Programmable thermostat; Ventilation; Insulation
- Laundry & utility: Washer hookup; Electric dryer hookup; Gas dryer hookup
Neighborhood map
What this means for you Summary
Snapshot
- This is a 3-bed/2.0-bath single-family listed at $145k.
Deal economics
- At list price, monthly cash flow is $611 ($7k/yr) — positive.
- The deal already cash-flows at list — no discount required.
- Meets the 1% rule at list price ($2k rent vs $145k).
- Recommended offer: $141k (3.0% below list) — sets the bar for market timing.
- Cap rate 11.3% vs local median 3.2% in Houston — top-decile yield for the area; either an underpriced asset or a hidden risk that comps aren't pricing in. Stress-test before assuming the spread holds.
Location & tenants
- Location reads 74/100 on livability (#184 in TX, #4,771 nationally) — a middle-class / working-renter tenant base. Strengths: amenities A+, cost of living A+, housing A+; Watch: crime F.
- Houston ISD (urban): math 27% / reading 35% proficiency, ranked #593 of 826 in TX (top 72%) — families likely to look elsewhere, expect single-tenant / working-renter base with shorter leases; 71% free/reduced lunch — lower-income household profile, screen leases tightly.
- Zoned schools: Cullen Middle (math 6% / reading 14%, grade F, #1,641 of 1,662 statewide, top 99%, 324 students, 100% FRL); Yates H S (math 12% / reading 23%, grade F, #1,451 of 1,632 statewide, top 89%, 851 students, 96% FRL) — zoned schools average 98% FRL vs 71% district-wide (27 pts higher); higher-poverty schools than district average — tighter screening recommended.
- Zoned-school proficiency averages 14% at this address vs 31% district-wide (-17 pts) — the specific schools serving this property underperform the Houston ISD average; the district grade overstates school quality for this exact location.
- Market conditions: Rents rising (+2.2%/yr); 467 active listings in the ZIP; 40 comparable units currently listed for rent nearby; rentals at typical pace (median 21d on market — plan ~3-4 weeks tenant-placement turnaround); 40% of comp listings sitting > 30 days — soft ceiling on asking rent; 29,883 units permitted in Harris County in 2024 (8,621 in 5+ unit buildings).
- At $2,234/mo this rent would consume 59% of the median local household income ($46k/yr) (locally 2532% of renters already pay >50% of income on rent) — very limited rent-growth headroom before tenants either downsize or default.
Forward outlook
- Local home prices are declining (-3.0%/yr); year-one equity from $1k of loan paydown is wiped out by about $4k of value loss. Plan a longer hold.
- Harris County population projected at +47% by 2050 — long-run rental-demand tailwind backs the buy-and-hold thesis.
- At projected returns (-3.0% appreciation + 2.2% rent growth), your $41k cash investment doubles in ~8 years — after that, you're playing with house money.
Negotiation context
- It's been on market 49 days — a 3% lower offer ($141k) is reasonable based on typical stale-listing flexibility.
Risks & watch-outs
- Watch-outs: property tax is 2.8% of price; built in 1940 — expect roof / HVAC / electrical / plumbing capex.
- Climate carrying-cost: moderate flood risk; severe wind risk, 99% chance of damaging wind over 30y; extreme-heat days projected 7→24/yr by 2055 (HVAC capex compounding) — expect insurance premiums to compound above CPI over the hold.
Questions for the listing agent
- It's been on market 49 days. Have you received any prior offers? Is the seller open to a 3% concession, seller financing, or rate buy-down credit?
- Built in 1940 — when were the roof, HVAC, electrical panel, plumbing, and water heater last replaced?
- Property tax is high relative to price — has the assessment been appealed recently, and will the sale trigger a re-assessment?
- Is there a deadline driving the sale (1031 exchange, divorce, estate, relocation)? That informs how much negotiation room exists.
- Schools are D-rated, which usually means shorter tenancies and higher turnover. Who's the typical renter profile here, and what's been the actual vacancy rate?
- Crime grade is F in this area — have there been break-ins, vandalism, or insurance claims at this property in the last 3 years? What carrier currently insures it and at what premium?
- What's the average days-on-market for RENTAL listings here right now (not sales)? A rising rental-DOM trend means longer vacancies and softer asking-rent achievability than the comps imply.
- What's the recent tenant-quality profile in this submarket — average credit score on applications, eviction rate, late-payment / NSF rate, and stable-employment percentage? A property-management company in the area should have these aggregated.
- How much new for-sale + rental construction is in the pipeline within 1–3 miles? Heavy new supply typically softens prices + rents 12–24 months out; constrained supply supports both.
Investment metrics
- 1% rule
- 1.54% ✓
- Cap rate
- 11.35%
- Cash-on-cash
- 18.06%
- DSCR
- 1.80
- GRM
- 5.4
CMA / ARV
- ARV (median comp)
- $322,406
- List price
- $145,000
- Delta
- -55.03%
- Verdict
- UNDERPRICED
- Comps
- 20 within 1.0 mi
Show comp detail 12 sales within ~0.75 mi
| Address | Dist | Beds/Ba | Sqft | Sold | Price | $/sf | Match |
|---|---|---|---|---|---|---|---|
| 3515 Lydia St | 0.37mi | 3/2.0 | 1,390 (-8%) | 4mo | $220,000 | $158 | 66 |
| 6641 Burkett St | 0.73mi | 3/1.5 | 1,541 (+2%) | 3mo | $159,900 | $104 | 58 |
| 3838 Daphne St | 0.67mi | 4/2.0 (+1) | 1,461 (-3%) | 2mo | $269,000 | $184 | 57 |
| 6723 Del Rio Street St | 0.65mi | 4/2.0 (+1) | 1,456 (-3%) | 3mo | $250,000 | $172 | 56 |
| 3305 Daphne St | 0.67mi | 3/2.5 | 1,596 (+6%) | 1mo | $299,000 | $187 | 56 |
| 3802 Rebecca St | 0.53mi | 3/2.0 | 1,348 (-11%) | 4mo | $189,000 | $140 | 54 |
| 4211 Faulkner St | 0.67mi | 3/2.5 | 1,610 (+7%) | 3mo | $274,900 | $171 | 53 |
| 3536 Rebecca St | 0.48mi | 3/2.5 | 1,332 (-12%) | 4mo | $240,000 | $180 | 53 |
| 6906 England St | 0.71mi | 3/2.5 | 1,600 (+6%) | 4mo | $309,900 | $194 | 51 |
| 7117 England St Unit C | 0.70mi | 3/2.5 | 1,700 (+13%) | 1mo | $340,000 | $200 | 44 |
| 6642 Del Rio St | 0.72mi | 3/2.5 | 1,696 (+12%) | 2mo | $320,000 | $189 | 42 |
| 7121 England St | 0.70mi | 3/1.0 | 1,296 (-14%) | 1mo | $139,900 | $108 | 40 |
Match score weights: distance 35% · size 25% · config 20% · recency 20%. Top-matched comps best support the ARV.
Projected returns pro-forma
-3.0% appreciation · 2.17% rent growth · sell at horizon
- IRR
- 8.7%
- Equity multiple
- 1.34×
- Total profit
- $13,692
- Equity at exit
- $21,620
- IRR
- 17.2%
- Equity multiple
- 2.36×
- Total profit
- $55,077
- Equity at exit
- $12,537
Cash invested: $40,600 (down + closing). Projections, not guarantees.
Landlord ↔ Tenant lean methodology
- Overall (STATE)
- 87 Strongly Landlord-Friendly
- State Texas
- 87 Strongly Landlord-Friendly · R+5
- County
- — inherits STATE
- City
- — inherits STATE
ZIP-level market 77021
- Home prices YoY
- -23.6%
- Rents YoY
- 2.2%
- Active inventory
- 467
- Price-to-rent
- 5.4×
Monthly cashflow live
- Estimated rent
- $2,234 high interval (Pro) →
- Mortgage (P&I)
- −$760
- Tax from tax record
- −$333 /mo · $3,998/yr
- Insurance
- −$60
- HOA
- −$0
- Vacancy / Maint / Mgmt
- −$469
- Net cashflow
- $611
Break-even live
UW: 25.0% down · 7.5% · 30yr · 1.5% tax · 5.0% vac · 8.0% maint · 8.0% mgmt
Financing live
Cash to close
- Down payment
- $36,250
- Closing costs
- $4,350
- Reserves months
- —
- Total cash needed
- —
Loan-product check · same deal, 3 products live
Conventional
25% down · 7.5% · 30yr
- Down + closing
- —
- Monthly P&I
- —
- Monthly cashflow
- —
- DSCR
- —
- Eligible?
- —
Personal DTI + credit; lowest rate.
DSCR
20% down · 8.5% · 30yr
- Down + closing
- —
- Monthly P&I
- —
- Monthly cashflow
- —
- DSCR
- —
- Eligible?
- —
No personal income docs; deal must DSCR.
Hard money
10% down · 12.0% · 12mo
- Down + closing
- —
- Monthly P&I
- —
- Monthly cashflow
- —
- DSCR
- —
- Eligible?
- —
Short-term bridge; refi at stabilization.
Rent comps 40 comps
| Address | Beds | Baths | Sqft | Rent | $/sqft | DOM | Units | Dist |
|---|---|---|---|---|---|---|---|---|
| 3615 Dreyfus St Houston, TX | 3.0 | 3.0 | 2011 | $2,800 | $1.39 | 43d | 1 | 0.05mi |
| 3655 Seabrook St Unit 6 Houston, TX | 2.0 | 1.0 | 1600 | $1,000 | $0.62 | 43d | 1 | 0.23mi |
| 3732 Seabrook St Houston, TX | 3.0 | 2.5 | 1727 | $2,350 | $1.36 | 24d | 1 | 0.29mi |
| 7507 Springhill St Houston, TX | 3.0 | 3.5 | 2000 | $4,500 | $2.25 | 43d | 1 | 0.33mi |
| 3402 Nathaniel Brown St Unit B Houston, TX | 3.0 | 2.5 | 1885 | $2,025 | $1.07 | 43d | 1 | 0.37mi |
| 3846 Seabrook St Houston, TX | 3.0 | 3.5 | 1833 | $2,300 | $1.25 | 43d | 1 | 0.39mi |
| 3360 Alice St Unit 510 Houston, TX | 3.0 | 2.0 | 1154 | $1,172 | $1.02 | 12d | 1 | 0.42mi |
| 3360 Alice St Unit 3174 Houston, TX | 3.0 | 2.0 | 1154 | $1,129 | $0.98 | 3d | 1 | 0.42mi |
| 3360 Alice St Unit 3047 Houston, TX | 3.0 | 2.0 | 1154 | $1,172 | $1.02 | 11d | 1 | 0.42mi |
| 7032 Conley St Houston, TX | 3.0 | 2.0 | 1220 | $2,850 | $2.34 | 43d | 1 | 0.62mi |
| 7373 Ardmore St Houston, TX | 1.0–3.0 | 1.0–2.0 | 1095 | $1,887 | $1.72 | 4d | 24 | 0.64mi |
| 7379 Ardmore St Unit 1303 Houston, TX | 3.0 | 2.0 | 1442 | $1,967 | $1.36 | 43d | 1 | 0.67mi |
| 7379 Ardmore St Unit 1303 Houston, TX | 3.0 | 2.0 | 1442 | $1,967 | $1.36 | 22d | 1 | 0.67mi |
| 7321 Conley St Unit B Houston, TX | 3.0 | 2.0 | 1501 | $2,025 | $1.35 | 20d | 1 | 0.67mi |
| 7321 Conley St Unit A Houston, TX | 3.0 | 2.5 | 1869 | $2,025 | $1.08 | 20d | 1 | 0.67mi |
| 3311 Daphne St Unit 1255369P Houston, TX | 3.0 | 3.5 | 1797 | $6,544 | $3.64 | 2d | 1 | 0.68mi |
| 3311 Daphne St Unit 3311 Houston, TX | 3.0 | 3.5 | 1800 | $7,500 | $4.17 | 43d | 1 | 0.68mi |
| 6809 Conley St Houston, TX | 3.0 | 4.0 | 1921 | $2,600 | $1.35 | 43d | 1 | 0.71mi |
| 6737 Peerless St Unit A Houston, TX | 3.0 | 3.5 | 1732 | $2,649 | $1.53 | 16d | 1 | 0.71mi |
| 6735 Peerless St Unit CUNIT A Houston, TX | 3.0 | 3.5 | 1732 | $2,649 | $1.53 | 16d | 1 | 0.72mi |
| 7110 Ardmore St Houston, TX | 2.0 | 1.0–2.0 | 831 | $2,354 | $2.83 | 2d | 19 | 0.72mi |
| 3088 Holly Hall St Unit 1 Houston, TX | 2.0 | 2.5 | 1600 | $1,750 | $1.09 | 14d | 1 | 0.75mi |
| 7806 Comal St Unit B Houston, TX | 3.0 | 2.5 | 1800 | $2,200 | $1.22 | 43d | 1 | 0.77mi |
| 2968 Holly Hall St Houston, TX | 2.0 | 3.0 | 1600 | $2,000 | $1.25 | 43d | 1 | 0.79mi |
| 2924 Holly Hall St Houston, TX | 2.0 | 3.0 | 1600 | $1,950 | $1.22 | 43d | 1 | 0.82mi |
| 3731 Alsace St Unit 1560804P Houston, TX | 3.0 | 2.0 | 2002 | $3,387 | $1.69 | 2d | 1 | 0.83mi |
| 6336 Culberson St Houston, TX | 3.0 | 3.5 | 1822 | $2,361 | $1.30 | 5d | 1 | 0.94mi |
| 6334 Culberson St Houston, TX | 3.0 | 3.5 | 1822 | $2,311 | $1.27 | 2d | 1 | 0.95mi |
| 8181 El Mundo St Houston, TX | 1.0–3.0 | 1.0–2.5 | 1356 | $2,262 | $1.67 | 1d | 47 | 0.96mi |
| 8181 El Mundo St Houston, TX | 1.0–3.0 | 1.0–2.0 | 1241 | $2,041 | $1.64 | 24d | 18 | 0.96mi |
| 8010 Livingston St Houston, TX | 3.0 | 2.0 | 1400 | $1,800 | $1.29 | 43d | 1 | 0.96mi |
| 3560 Dixie Dr Apt 422 Houston, TX | 2.0 | 2.0 | 1322 | $1,410 | $1.07 | 7d | 1 | 0.96mi |
| 3560 Dixie Dr Unit 2162 Houston, TX | 2.0 | 2.0 | 1322 | $1,410 | $1.07 | 5d | 1 | 0.96mi |
| 3560 Dixie Dr Unit 3617 Houston, TX | 2.0 | 2.0 | 1322 | $1,435 | $1.09 | 43d | 1 | 0.96mi |
| 3560 Dixie Dr Unit 3597 Houston, TX | 2.0 | 2.0 | 1322 | $1,434 | $1.08 | 10d | 1 | 0.96mi |
| 3560 Dixie Dr Unit 2165 Houston, TX | 2.0 | 2.0 | 1322 | $1,402 | $1.06 | 2d | 1 | 0.96mi |
| 3024 Charline Ave Houston, TX | 3.0 | 3.5 | 1995 | $2,950 | $1.48 | 44d | 1 | 0.97mi |
| 2700 Holly Hall St Unit 2737 Houston, TX | 2.0 | 2.0 | 1720 | $1,724 | $1.00 | 3d | 1 | 1.03mi |
| 2700 Holly Hall St Unit 2733 Houston, TX | 3.0 | 2.0 | 1943 | $2,006 | $1.03 | 3d | 1 | 1.03mi |
| 2656 Holly Hall St Houston, TX | 2.0 | 2.0 | 1850 | $2,206 | $1.19 | 43d | 1 | 1.05mi |
Listing history 13 events
-
2026-06-18days on market $145,000 Active 49 DOM
-
2026-06-17days on market $145,000 Active 48 DOM
-
2026-06-16days on market $145,000 Active 47 DOM
-
2026-06-15days on market $145,000 Active 46 DOM
-
2026-06-13days on market $145,000 Active 44 DOM
-
2026-06-10days on market $145,000 Active 40 DOM
-
2026-06-08days on market $145,000 Active 39 DOM
-
2026-06-07days on market $145,000 Active 38 DOM
-
2026-06-04days on market $145,000 Active 35 DOM
-
2026-06-01days on market $145,000 Active 32 DOM
-
2026-05-31days on market $145,000 Active 31 DOM
-
2026-04-30$145,000 Active 483-char remark
-
1998-12-15soldstatus
ⓘ Source: listings_history table (triggers on properties + properties_extension) + one-shot
backfill from property_details.listing_events for pre-trigger history.
Tax reassessment forecast TX · Resets to sale price
- Current annual tax
- $3,998 · $333/mo
- Projected year-2 tax
- $3,998 · $333/mo
- Expected delta
- $0/yr ($0/mo · 0.0%)
ⓘ Screening estimate from a state-policy table — verify with the county assessor before closing.
Climate risk First Street
- Flood 5/10 Major FEMA zone X (unshaded) · 47% chance over 30 yrs
- Wildfire 1/10 Low
- Heat 9/10 Extreme 7 d/yr ≥109°F today · 24 d/yr by 30 yrs out
- Wind 9/10 Extreme 99% chance of damaging wind over 30 yrs
- Air quality 2/10 Low 2 unhealthy d/yr today · 2 by 30 yrs out
Nearby sold comps map
Loading sold comps map…
Walkable amenities ~0.75 mi
Loading nearby amenities…
Taxation est. · year 1
- Rental income
- $26,809
- − Mortgage interest
- −$8,122
- − Property taxes
- −$3,998
- − Insurance
- −$725
- − Repairs & maintenance
- −$2,145
- − Management
- −$2,145
- − Depreciation
- −$4,218
- Taxable income
- $5,456
- Est. tax owed @ 24.0%
- −$1,309
- After-tax cash flow
- $6,022/yr
For passive investors: Depreciation is non-cash, so a rental often shows a tax loss while cash-flowing — sheltering income. Rental losses are passive: they offset passive income freely, and up to $25,000/yr can offset ordinary (W-2) income if you actively participate and your MAGI is under $100k (phasing out to $0 by $150k); unused losses carry forward. On sale, claimed depreciation is recaptured at up to 25%, and gains may owe capital-gains tax (a 1031 exchange can defer both). Figures are a year-1 estimate at your 24.0% rate — not tax advice; consult a CPA.
Schools (NCES district)
- District
- Houston ISD
- NCES district ID
- 4823640
- Math proficiency
- 27% ▼ -18.00%
- Reading proficiency
- 35% ▼ -6.00%
- Median HH income
- $46,054
- Composite
- 26.63/100
- National rank
- #7173
- State rank
- #593 of 826 in TX
Livability — Houston
- Score
- 74/100
- State rank
- #184
- US rank
- #4771
Category grades
Schools grade is shown separately in the Schools card above.
Census & demographics
- Census place
- Houston, TX
- County
- Harris County · 4,702,590 people
- City population
- 3,226,434
- Metro
- Houston-The Woodlands-Sugar Land, TX
- Population (ZIP)
- 26,153
- Household income
- $45,574
- Rent vs Own
- Severe rent burden
- 2532.0
Population outlook (Harris County) Hauer SSP2
- Today (2025)
- 5,571,493 people
- By 2030
- 6,089,821 · +9.3%
- By 2040
- 7,142,806 · +28.2%
- By 2050
- 8,185,864 · +46.9%
- By 2075
- 10,574,329 · +89.8%
- By 2100
- 12,109,958 · +117.4%
Race, ethnicity, and origin ACS 2023
- Neighborhood character
- Diverse neighborhood (Simpson 0.55)
- Race & ethnicity
- Black 62% Hispanic / Latino 22% Two or more races 12% White 10% Asian 2%
- Hispanic origin (detail)
- Mexican 15%
- Common ancestry
- Italian 1% Romanian 1% Lithuanian 1%
- Foreign-born
- 11% · Canada
- Languages at home
- 77% English-only · Spanish 19% French/Haitian/Cajun 1% Other Indo-European 1%
Political lean MEDSL · Harris
- 2024 margin
- Lean D (+5.5) · D 52.0% · R 46.4% · Other 1.6%
- 2008→2024 swing
- +3.9pp toward D · 2008: 1.6pp · 2024: 5.5pp
- All cycles
- 2024: D+5.5 2020: D+13.3 2016: D+12.4 2012: D+0.1 2008: D+1.6
Not yet ingested
- Civics
- —
Market trends
- HPI YoY
- ▼ -71.22%
- Current HPI
- 230.2869
- Rent YoY
- ▲ 2.17%
- Metro
- Houston-The Woodlands-Sugar Land, TX
- State GDP YoY
- ▲ 3.95%
- F500 in state
- 110
Industry mix (Fortune 500 HQ in TX)
| Industry | F500 HQs | Revenue |
|---|---|---|
| Energy | 16 | $1,198B |
|
||
| Technology | 5 | $198B |
|
||
| Engineering / Construction | 4 | $72B |
|
||
| Energy Services | 3 | $60B |
|
||
| Utilities | 3 | $41B |
|
||
| Healthcare | 2 | $330B |
|
||
Price history
2 events — show timeline
- 2026-04-30 Listed $145,000 HARMLS
- 1998-12-15 Sold (Public Records) — Public Records
Property tax history
+12.4%/yrLatest (2025): $3,998 · -1.3% YoY. Source: county tax records.
Cash-flow waterfall
monthlySold comps — $/sqft
last 12 mo · ≤1 miLoading sold comps…