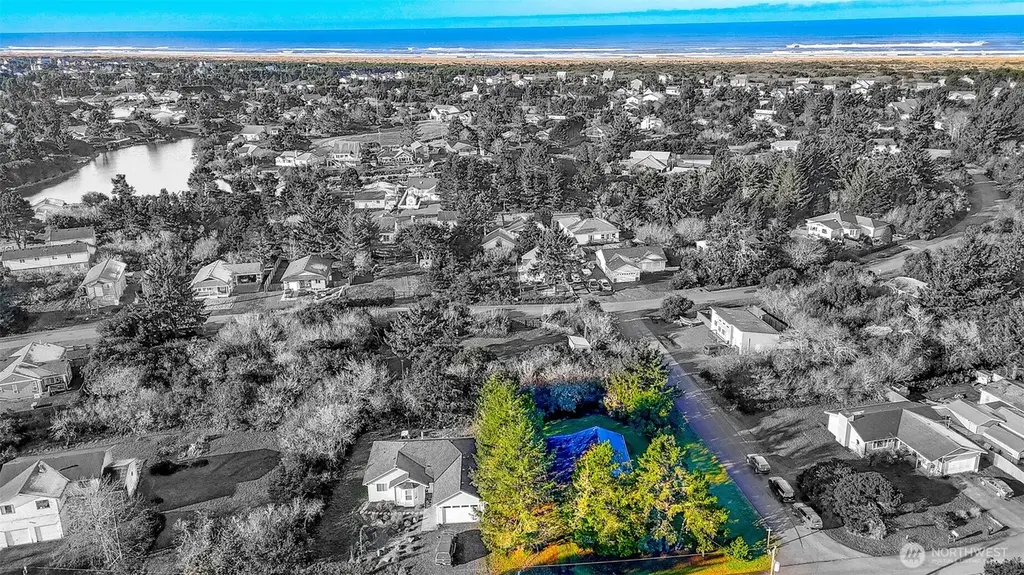
199 Wishkah St SW · Ocean Shores, WA
Flood risk 1/10 · Minimal
- FEMA flood zone
- X (unshaded)
- Chance of flooding over 30 yrs
- 0.0%
- Est. flood insurance / yr
- $507 – $1,088
Fire risk 1/10 · Minimal
- Est. fire insurance / yr
- $604 – $1,122
Heat risk 1/10 · Minimal
- Hot days now (above 72°F)
- 7 days/yr
- Hot days in 30 yrs
- 17 days/yr
Wind risk 1/10 · Minimal
- Chance of severe wind over 30 yrs
- —
Air-quality risk 5/10 · Moderate
- Unhealthy air days now
- 6 days/yr
- Unhealthy air days in 30 yrs
- 6 days/yr
Risk factors via First Street. Map © Google.
Why this score? — see what drove the D grade
The composite is a weighted blend of 9 inputs, each scored 0–100. Each bar is that input's sub-score; the figure is the points it added to the 100-point composite (weight × sub-score).
- ARV discount +15.0/15.0
- Cash flow +10.2/30.0
- Schools +3.4/10.0
- Livability +3.1/5.0
- DSCR +2.9/10.0
- Rent growth +2.5/5.0
- Condition / age +2.5/5.0
- 1% rule +2.0/10.0
- Appreciation +0.0/10.0
$240,000
🖨 Deal sheet 📄 Offer letter ✓ Due diligence
Listing remarks
Cute little beach cabin tucked away on a spacious corner lot offering tons of potential for the right buyer. This cozy getaway features a galley kitchen with ample storage and a breakfast counter, plus a bright , roomy dining area ideal for entertaining. A pellet stove helps keep the home warm and comfortable during the winter months. Two good sized bedrooms and a sleeping loft provide flexible living space. the property includes an attached one car garage with laundry and shop area, a single carport and a long deck for outdoor enjoyment. With some work and TLC, this cabin could truly shine. Just minutes from the beach for endless coastal fun!
Key facts
- Galley kitchen
- Attached garage
- Sleeping loft
Tags
Neighborhood map
What this means for you Summary
Snapshot
- This is a 2-bed/1.0-bath single-family listed at $240k.
Deal economics
- At list price, monthly cash flow is $-137 ($-2k/yr) — negative.
- To cash-flow at today's rent, offer at most $216k (10.1% below list).
- To meet the 1% rule (rent ≥ 1% of price), the offer needs to be $169k (29.7% below list).
- Recommended offer: $169k (29.7% below list) — sets the bar for 1% rule.
- Cap rate 5.6% vs local median 3.1% in Ocean Shores — top-decile yield for the area; either an underpriced asset or a hidden risk that comps aren't pricing in. Stress-test before assuming the spread holds.
Location & tenants
- Location reads 62/100 on livability (#424 in WA) — a middle-class / working-renter tenant base. Strengths: housing A; Watch: schools C-, crime C-, health & safety C-.
- North Beach School District (rural): math 32% / reading 44% proficiency, ranked #236 of 291 in WA (top 81%) — families likely to look elsewhere, expect single-tenant / working-renter base with shorter leases; 63% free/reduced lunch — lower-income household profile, screen leases tightly.
- Market conditions: 653 active listings in the ZIP; 1 comparable units currently listed for rent nearby; 297 units permitted in Grays Harbor County in 2024 (17 in 5+ unit buildings).
- This rent runs 35% of the median local income ($58k/yr) — at the standard rent-burdened threshold; future hikes will face affordability resistance.
Forward outlook
- Local home prices are declining (-3.0%/yr); year-one equity from $2k of loan paydown is wiped out by about $7k of value loss. Plan a longer hold.
- Grays Harbor County population projected at -24% by 2050 — secular population decline; favor cash flow + early exit over multi-decade hold.
Negotiation context
- It's been on market 120 days — a 9% lower offer ($218k) is reasonable based on typical stale-listing flexibility.
- 3 sale attempts since 24y ago; this cycle's ask has dropped $25k (9%) from the opening price — seller is motivated, your offer sets the floor, not the list.
- Current owner paid $99k; list at $240k implies a 142% gain — meaningful room to come down on a strong offer.
Questions for the listing agent
- What do current leases actually rent for vs. the listed asking? Can we see a recent rent roll and the last 12 months of T-12 income?
- It's been on market 120 days. Have you received any prior offers? Is the seller open to a 30% concession, seller financing, or rate buy-down credit?
- Built in 1970 — when were the roof, HVAC, electrical panel, plumbing, and water heater last replaced?
- Why hasn't it sold? Are there any deal-killer items the seller is aware of (foundation, flood, title, zoning, code violations)?
- Is there a deadline driving the sale (1031 exchange, divorce, estate, relocation)? That informs how much negotiation room exists.
- The area grade is low — what's the realistic commute time and amenity access for the typical tenant pool here? Any planned neighborhood developments (good or bad) we should know about?
- What's the average days-on-market for RENTAL listings here right now (not sales)? A rising rental-DOM trend means longer vacancies and softer asking-rent achievability than the comps imply.
- What's the recent tenant-quality profile in this submarket — average credit score on applications, eviction rate, late-payment / NSF rate, and stable-employment percentage? A property-management company in the area should have these aggregated.
- How much new for-sale + rental construction is in the pipeline within 1–3 miles? Heavy new supply typically softens prices + rents 12–24 months out; constrained supply supports both.
Investment metrics
- 1% rule
- 0.70% ✗
- Cap rate
- 5.61%
- Cash-on-cash
- -2.45%
- DSCR
- 0.89
- GRM
- 11.9
CMA / ARV
- ARV (median comp)
- $356,400
- List price
- $240,000
- Delta
- -32.66%
- Verdict
- UNDERPRICED
- Comps
- 20 within 1.0 mi
Show comp detail 12 sales within ~0.75 mi
| Address | Dist | Beds/Ba | Sqft | Sold | Price | $/sf | Match |
|---|---|---|---|---|---|---|---|
| 150 N Wynoochee Dr SW | 0.15mi | 2/1.0 | 880 (-8%) | 3mo | $284,950 | $324 | 77 |
| 399 N Razor Clam Dr SW | 0.45mi | 2/2.0 | 936 (-2%) | 2mo | $353,000 | $377 | 70 |
| 406 SW Ocean Shores Blvd | 0.55mi | 2/1.0 | 952 (-1%) | 7mo | $150,001 | $158 | 67 |
| 167 Polaris Blvd SW | 0.70mi | 2/1.0 | 962 (+0%) | 2mo | $300,000 | $312 | 66 |
| 148 Seagate St SW | 0.62mi | 3/1.0 (+1) | 960 (0%) | 5mo | $270,000 | $281 | 62 |
| 137 Spruce Loop SW | 0.66mi | 2/1.0 | 884 (-8%) | 0mo | $223,000 | $252 | 56 |
| 462 Ebb Ct SW | 0.63mi | 2/1.0 | 884 (-8%) | 4mo | $325,000 | $368 | 54 |
| 585 Ocean Shores Blvd SW | 0.36mi | 2/1.0 | 1,102 (+15%) | 6mo | $342,500 | $311 | 54 |
| 649 Sollecks Ave SE | 0.58mi | 2/1.5 | 864 (-10%) | 4mo | $292,000 | $338 | 52 |
| 345 Mount Olympus Ave SE | 0.61mi | 2/1.0 | 834 (-13%) | 4mo | $265,000 | $318 | 46 |
| 436 Seashore St SW | 0.67mi | 2/1.0 | 816 (-15%) | 8mo | $289,000 | $354 | 37 |
| 613 Willipa Ct SE | 0.57mi | 3/1.5 (+1) | 1,086 (+13%) | 10mo | $249,000 | $229 | 37 |
Match score weights: distance 35% · size 25% · config 20% · recency 20%. Top-matched comps best support the ARV.
Projected returns pro-forma
-3.0% appreciation · 3.0% rent growth · sell at horizon
- IRR
- -20.4%
- Equity multiple
- 0.29×
- Total profit
- $-47,721
- Equity at exit
- $35,785
- IRR
- -13.7%
- Equity multiple
- 0.21×
- Total profit
- $-53,176
- Equity at exit
- $20,751
Cash invested: $67,200 (down + closing). Projections, not guarantees.
Landlord ↔ Tenant lean methodology
- Overall (STATE)
- 28 Tenant-Leaning
- State Washington
- 28 Tenant-Leaning · D+8
- County
- — inherits STATE
- City
- — inherits STATE
ZIP-level market 98569
- Home prices YoY
- -3.4%
- Active inventory
- 653
- Price-to-rent
- 11.9×
Monthly cashflow live
- Estimated rent
- $1,687 medium interval (Pro) →
- Mortgage (P&I)
- −$1,259
- Tax from tax record
- −$111 /mo · $1,335/yr
- Insurance
- −$100
- HOA
- −$0
- Vacancy / Maint / Mgmt
- −$354
- Net cashflow
- $-137
Break-even live
UW: 25.0% down · 7.5% · 30yr · 1.5% tax · 5.0% vac · 8.0% maint · 8.0% mgmt
Financing live
Cash to close
- Down payment
- $60,000
- Closing costs
- $7,200
- Reserves months
- —
- Total cash needed
- —
Loan-product check · same deal, 3 products live
Conventional
25% down · 7.5% · 30yr
- Down + closing
- —
- Monthly P&I
- —
- Monthly cashflow
- —
- DSCR
- —
- Eligible?
- —
Personal DTI + credit; lowest rate.
DSCR
20% down · 8.5% · 30yr
- Down + closing
- —
- Monthly P&I
- —
- Monthly cashflow
- —
- DSCR
- —
- Eligible?
- —
No personal income docs; deal must DSCR.
Hard money
10% down · 12.0% · 12mo
- Down + closing
- —
- Monthly P&I
- —
- Monthly cashflow
- —
- DSCR
- —
- Eligible?
- —
Short-term bridge; refi at stabilization.
Rent comps 1 comps
| Address | Beds | Baths | Sqft | Rent | $/sqft | DOM | Units | Dist |
|---|---|---|---|---|---|---|---|---|
| 230 Point Brown Ave SE Ocean Shores, WA | 2.0 | 1.0 | 840 | $2,100 | $2.50 | 43d | 1 | 0.89mi |
Listing history 27 events
-
2026-06-19days on market $240,000 Active 120 DOM
-
2026-06-18days on market $240,000 Active 119 DOM
-
2026-06-17days on market $240,000 Active 118 DOM
-
2026-06-16days on market $240,000 Active 117 DOM
-
2026-06-15days on market $240,000 Active 116 DOM
-
2026-06-14days on market $240,000 Active 114 DOM
-
2026-06-12days on market $240,000 Active 113 DOM
-
2026-06-09days on market $240,000 Active 110 DOM
-
2026-06-08days on market $240,000 Active 109 DOM
-
2026-06-07days on market $240,000 Active 108 DOM
-
2026-06-05days on market $240,000 Active 105 DOM
-
2026-06-03days on market $240,000 Active 104 DOM
-
2026-06-02days on market $240,000 Active 103 DOM
-
2026-06-01days on market $240,000 Active 102 DOM
-
2026-05-31days on market $240,000 Active 101 DOM
-
2026-05-30days on market $240,000 Active 100 DOM
-
2026-04-16price $240,000
-
2026-02-19$265,000 Active
-
2010-10-19historical
-
2010-10-15soldstatus $99,000 Sold
-
2010-10-15soldstatus $99,000
-
2010-10-04status Pending
-
2010-10-01$99,000 Active
-
2003-02-27soldstatus $72,000
-
2003-01-29soldstatus $68,000
-
2002-07-23$75,000
-
2002-03-18soldstatus $34,500
ⓘ Source: listings_history table (triggers on properties + properties_extension) + one-shot
backfill from property_details.listing_events for pre-trigger history.
Tax reassessment forecast WA · Resets to sale price
- Current annual tax
- $1,335 · $111/mo
- Projected year-2 tax
- $2,352 · $196/mo
- Expected delta
- +$1,017/yr (+$85/mo · 76.1%)
ⓘ Screening estimate from a state-policy table — verify with the county assessor before closing.
Climate risk First Street
- Flood 1/10 Low FEMA zone X (unshaded) · 0% chance over 30 yrs
- Wildfire 1/10 Low
- Heat 1/10 Low 7 d/yr ≥72°F today · 17 d/yr by 30 yrs out
- Wind 1/10 Low
- Air quality 5/10 Major 6 unhealthy d/yr today · 6 by 30 yrs out
Nearby sold comps map
Loading sold comps map…
Walkable amenities ~0.75 mi
Loading nearby amenities…
Taxation est. · year 1
- Rental income
- $20,243
- − Mortgage interest
- −$13,444
- − Property taxes
- −$1,335
- − Insurance
- −$1,200
- − Repairs & maintenance
- −$1,619
- − Management
- −$1,619
- − Depreciation
- −$6,982
- Taxable loss
- −$5,957
- Est. tax savings @ 24.0%
- +$1,430
- After-tax cash flow
- $-217/yr
For passive investors: Depreciation is non-cash, so a rental often shows a tax loss while cash-flowing — sheltering income. Rental losses are passive: they offset passive income freely, and up to $25,000/yr can offset ordinary (W-2) income if you actively participate and your MAGI is under $100k (phasing out to $0 by $150k); unused losses carry forward. On sale, claimed depreciation is recaptured at up to 25%, and gains may owe capital-gains tax (a 1031 exchange can defer both). Figures are a year-1 estimate at your 24.0% rate — not tax advice; consult a CPA.
Schools (NCES district)
- District
- North Beach School District
- NCES district ID
- 5305700
- Math proficiency
- 32% ▼ -4.00%
- Reading proficiency
- 44% ▬ 0.00%
- Median HH income
- $40,966
- Composite
- 34.46/100
- National rank
- #10153
- State rank
- #236 of 291 in WA
Livability — Ocean Shores
- Score
- 62/100
- State rank
- #424
- US rank
- #16852
Category grades
Schools grade is shown separately in the Schools card above.
Census & demographics
- Census place
- Ocean Shores, WA
- County
- Grays Harbor County · 44,693 people
- City population
- 7,187
- Metro
- Aberdeen, WA
- Population (ZIP)
- 7,489
- Household income
- $58,378
- Rent vs Own
- Severe rent burden
- 172.0
Population outlook (Grays Harbor County) Hauer SSP2
- Today (2025)
- 66,443 people
- By 2030
- 63,255 · -4.8%
- By 2040
- 56,466 · -15.0%
- By 2050
- 50,516 · -24.0%
- By 2075
- 39,296 · -40.9%
- By 2100
- 31,142 · -53.1%
Race, ethnicity, and origin ACS 2023
- Neighborhood character
- Predominantly White (86%)
- Race & ethnicity
- White 86% Two or more races 5% Hispanic / Latino 4% Asian 3% Native American 3%
- Common ancestry
- Portuguese 8% Iranian 5% Lithuanian 4%
- Foreign-born
- 5% · Canada
- Languages at home
- 92% English-only · Spanish 3% Tagalog/Filipino 2% German/W. Germanic 2%
Political lean MEDSL · Grays Harbor
- 2024 margin
- Lean R (+6.0) · D 45.6% · R 51.6% · Other 2.8%
- 2008→2024 swing
- -20.6pp toward R · 2008: 14.6pp · 2024: -6.0pp
- All cycles
- 2024: R+6.0 2020: R+6.6 2016: R+7.1 2012: D+14.0 2008: D+14.6
Not yet ingested
- Civics
- —
Market trends
- HPI YoY
- ▼ -13.33%
- Current HPI
- 380.05
- Rent YoY
- —
- Metro
- Aberdeen, WA
- State GDP YoY
- ▲ 4.65%
- F500 in state
- 22
Industry mix (Fortune 500 HQ in WA)
| Industry | F500 HQs | Revenue |
|---|---|---|
| Retail | 2 | $269B |
|
||
| Technology / Retail | 1 | $638B |
|
||
| Technology | 1 | $245B |
|
||
| Telecommunications | 1 | $38B |
|
||
| Food / Beverage | 1 | $36B |
|
||
| Automotive / Trucks | 1 | $34B |
|
||
Price history
+595.7% since first listed11 events — show timeline
- 2026-04-16 Price Changed $240,000 NWMLS as Distributed by MLS Grid
- 2026-02-19 Listed $265,000 NWMLS as Distributed by MLS Grid
- 2010-10-19 Delisted — NWMLS as Distributed by MLS Grid
- 2010-10-15 Sold (Public Records) $99,000 Public Records
- 2010-10-15 Sold (MLS) $99,000 NWMLS as Distributed by MLS Grid
- 2010-10-04 Pending — NWMLS as Distributed by MLS Grid
- 2010-10-01 Listed $99,000 NWMLS as Distributed by MLS Grid
- 2003-02-27 Sold (MLS) $72,000 NWMLS as Distributed by MLS Grid
- 2003-01-29 Sold (Public Records) $68,000 Public Records
- 2002-07-23 Listed $75,000 NWMLS as Distributed by MLS Grid
- 2002-03-18 Sold (Public Records) $34,500 Public Records
Property tax history
+2.1%/yrLatest (2026): $1,335 · +2.2% YoY. Source: county tax records.
Cash-flow waterfall
monthlySold comps — $/sqft
last 12 mo · ≤1 miLoading sold comps…