 10-Plex
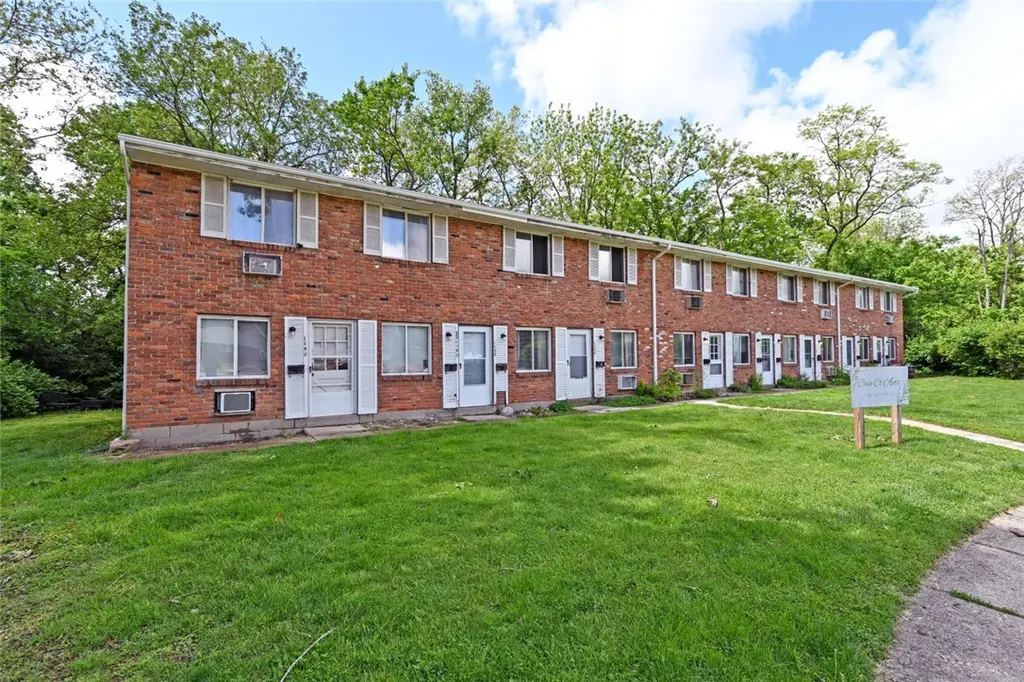
1124 Case Ct · Miamisburg, OH
Flood risk 4/10 · Minor
- FEMA flood zone
- X (unshaded)
- Chance of flooding over 30 yrs
- 0.24%
- Est. flood insurance / yr
- $507 – $1,088
Fire risk 1/10 · Minimal
- Est. fire insurance / yr
- $713 – $1,323
Heat risk 4/10 · Minor
- Hot days now (above 101°F)
- 7 days/yr
- Hot days in 30 yrs
- 19 days/yr
Wind risk 2/10 · Minimal
- Chance of severe wind over 30 yrs
- 1.0%
Air-quality risk 3/10 · Minor
- Unhealthy air days now
- 2 days/yr
- Unhealthy air days in 30 yrs
- 4 days/yr
Risk factors via First Street. Map © Google.
Why this score? — see what drove the C grade
The composite is a weighted blend of 9 inputs, each scored 0–100. Each bar is that input's sub-score; the figure is the points it added to the 100-point composite (weight × sub-score).
- Cash flow +27.2/30.0
- DSCR +9.5/10.0
- 1% rule +7.4/10.0
- Schools +4.8/10.0
- Livability +3.8/5.0
- Rent growth +3.3/5.0
- Condition / age +2.5/5.0
- ARV discount +0.0/15.0
- Appreciation +0.0/10.0
$775,000
🖨 Deal sheet (PDF) 📄 Offer letter ✓ Due diligence
Multi-family units
County records classify this as Multi-Family (5+ Unit). Listing-text estimate: 10 units. confirmed
5+ unit building — per-unit beds/baths from public records are typically unavailable; the breakdown below (if shown) is an estimate from the listing text.
Listing remarks
10-Unit Cash Flow Opportunity Near Downtown Miamisburg. Turnkey 10-unit, two-story multifamily offering immediate scale and strong tenant appeal. All units are 1 bed / 1 bath, creating a consistent, easy-to-manage layout. Each unit includes in-unit laundry hookups with washer/dryer, plus oven/range and refrigerator. A rare amenity package that supports higher rents and tenant retention. Property features on-street and off-street parking and is located just minutes from Downtown Miamisburg, providing access to dining, shopping, and local amenities that drive rental demand. Ideal for investors seeking a plug-and-play asset with immediate income and future upside. Opportunity exists to increas
Key facts
- Access to shopping
- Off-street parking
- Access to dining
Tags
Property features AI
Finance
- Financial info: Gross income reported: $94,277; Property is offered for sale
Exterior
- Parking: No garage
- Home design: Two-story building; Single building containing all units
- Construction: Brick construction; Slab foundation
- Exterior features: Residential zoning; 1.53-acre lot
Interior
- Bedrooms: One-bedroom units (10 total units)
- Bathrooms: One full bathroom per unit
- Heating & cooling: Forced air heating (natural gas); Window unit cooling
- Interior features: Window cooling units; Forced air heating (natural gas)
Neighborhood map
What this means for you Summary
Snapshot
- This is a 10 × 1-bed/1-bath units multifamily listed at $775k.
Deal economics
- At list price, monthly cash flow is $2k ($27k/yr) — positive. Per door: $222/mo.
- The deal already cash-flows at list — no discount required.
- Meets the 1% rule at list price ($10k rent vs $775k).
- Recommended offer: $752k (3.0% below list) — sets the bar for market timing.
- Cap rate 9.7% vs local median 3.0% in Miamisburg — top-decile yield for the area; either an underpriced asset or a hidden risk that comps aren't pricing in. Stress-test before assuming the spread holds.
Location & tenants
- Location reads 76/100 on livability (#228 in OH, #3,550 nationally) — a middle-class / working-renter tenant base. Strengths: cost of living A+, housing A+, crime A-; Watch: health & safety C-, amenities F, commute F.
- Miamisburg City (suburban): math 52% / reading 61% proficiency, ranked #338 of 656 in OH (top 52%) — acceptable for families but not a draw, mixed tenant base, ~2y average lease.
- Zoned schools: Mark Twain Elementary School (math 62% / reading 62%, grade B, #590 of 1,584 statewide, top 41%, 331 students, 38% FRL); Miamisburg Middle School (math 53% / reading 58%, grade B-, #321 of 654 statewide, top 51%, 1,160 students, 44% FRL); Miamisburg High School (math 34% / reading 73%, grade C-, #334 of 781 statewide, top 43%, 1,557 students, 33% FRL) — zoned schools at 38% FRL track the district average.
- Market conditions: Rents rising (+3.3%/yr); 116 active listings in the ZIP; solid renter incomes; 907 units permitted in Montgomery County in 2024 (416 in 5+ unit buildings).
- At $9,577/mo this rent would consume 135% of the median local household income ($85k/yr) (locally 790% of renters already pay >50% of income on rent) — very limited rent-growth headroom before tenants either downsize or default.
Forward outlook
- Local home prices are declining (-3.0%/yr); year-one equity from $5k of loan paydown is wiped out by about $23k of value loss. Plan a longer hold.
- Montgomery County population projected at -10% by 2050 — secular population decline; favor cash flow + early exit over multi-decade hold.
- At projected returns (-3.0% appreciation + 3.3% rent growth), your $217k cash investment doubles in ~9 years — after that, you're playing with house money.
Negotiation context
- It's been on market 45 days — a 3% lower offer ($752k) is reasonable based on typical stale-listing flexibility.
- 2 sale attempts with the ask held roughly flat each time — persistent listings suggest the price (not the market) is what's stuck; bring a comps-based counter.
- Current owner paid $560k; 38% above their basis — modest negotiation headroom, anchor on the comps not their cost.
Questions for the listing agent
- It's been on market 45 days. Have you received any prior offers? Is the seller open to a 3% concession, seller financing, or rate buy-down credit?
- Can we see the unit-by-unit rent roll, current vacancy, and any below-market leases? What's the average tenancy length?
- What capital expenditures (roof, boiler, parking lot, exteriors) have been made in the last 5 years, and what's planned in the next 2?
- Built in 1966 — when were the roof, HVAC, electrical panel, plumbing, and water heater last replaced?
- Is there a deadline driving the sale (1031 exchange, divorce, estate, relocation)? That informs how much negotiation room exists.
- Schools are B-rated — typically a magnet for longer-tenancy family renters. What's the average tenant stay here, and is there a school-zone premium baked into asking?
- What's the average days-on-market for RENTAL listings here right now (not sales)? A rising rental-DOM trend means longer vacancies and softer asking-rent achievability than the comps imply.
- What's the recent tenant-quality profile in this submarket — average credit score on applications, eviction rate, late-payment / NSF rate, and stable-employment percentage? A property-management company in the area should have these aggregated.
- How much new apartment / multifamily construction is in the pipeline within 1–3 miles? Heavy new supply (>2% of stock underway) typically softens rents 12–24 months out; light construction supports rent growth.
Investment metrics
- 1% rule
- 1.24% ✓
- Cap rate
- 9.73%
- Cash-on-cash
- 12.27%
- DSCR
- 1.55
- GRM
- 6.7
CMA / ARV
- ARV (median comp)
- $651,728
- List price
- $775,000
- Delta
- 18.91%
- Verdict
- OVERPRICED
- Comps
- 2 within 1.0 mi
Projected returns pro-forma
-3.0% appreciation · 3.29% rent growth · sell at horizon
- IRR
- 2.2%
- Equity multiple
- 1.09×
- Total profit
- $18,668
- Equity at exit
- $115,555
- IRR
- 12.1%
- Equity multiple
- 1.97×
- Total profit
- $210,347
- Equity at exit
- $67,008
Cash invested: $217,000 (down + closing). Projections, not guarantees.
Landlord ↔ Tenant lean methodology
- Overall (STATE)
- 73 Landlord-Friendly
- State Ohio
- 73 Landlord-Friendly · R+6
- County
- — inherits STATE
- City
- — inherits STATE
ZIP-level market 45342
- Rents YoY
- 3.3%
- Active inventory
- 116
- Price-to-rent
- 67.4×
Monthly cashflow live
- Estimated rent
- $9,577 high interval (Pro) →
- Mortgage (P&I)
- −$4,064
- Tax from tax record
- −$960 /mo · $11,520/yr
- Insurance
- −$323
- HOA
- −$0
- Vacancy / Maint / Mgmt
- −$2,011
- Net cashflow
- $2,219
Break-even live
Sensitivity live
| Price | -10% $2,657 | -5% $2,438 | +0% $2,219 | +5% $1,999 | +10% $1,780 |
|---|---|---|---|---|---|
| Rent | -10% $1,462 | -5% $1,840 | +0% $2,219 | +5% $2,597 | +10% $2,975 |
| Rate | -1.0pp $2,609 | -0.5pp $2,416 | base $2,219 | +0.5pp $2,018 | +1.0pp $1,814 |
10-unit breakdown (identical units grouped — click to expand)
| Units | Beds | Baths | Est. rent |
|---|---|---|---|
| 10× units | 1 | 1 | $9,580 |
| #1 | 1 | 1 | $958 |
| #2 | 1 | 1 | $958 |
| #3 | 1 | 1 | $958 |
| #4 | 1 | 1 | $958 |
| #5 | 1 | 1 | $958 |
| #6 | 1 | 1 | $958 |
| #7 | 1 | 1 | $958 |
| #8 | 1 | 1 | $958 |
| #9 | 1 | 1 | $958 |
| #10 | 1 | 1 | $958 |
| Total (10 units) | $9,577 | ||
UW: 25.0% down · 7.5% · 30yr · 1.5% tax · 5.0% vac · 8.0% maint · 8.0% mgmt
Financing live
Cash to close
- Down payment
- $193,750
- Closing costs
- $23,250
- Reserves months
- —
- Total cash needed
- —
Loan-product check · same deal, 3 products live
Conventional
25% down · 7.5% · 30yr
- Down + closing
- —
- Monthly P&I
- —
- Monthly cashflow
- —
- DSCR
- —
- Eligible?
- —
Personal DTI + credit; lowest rate.
DSCR
20% down · 8.5% · 30yr
- Down + closing
- —
- Monthly P&I
- —
- Monthly cashflow
- —
- DSCR
- —
- Eligible?
- —
No personal income docs; deal must DSCR.
Hard money
10% down · 12.0% · 12mo
- Down + closing
- —
- Monthly P&I
- —
- Monthly cashflow
- —
- DSCR
- —
- Eligible?
- —
Short-term bridge; refi at stabilization.
Listing history 19 events
-
2026-06-21statusdays on market $775,000 Pending 45 DOM
-
2026-06-18days on market $775,000 Active 44 DOM
-
2026-06-17days on market $775,000 Active 43 DOM
-
2026-06-16days on market $775,000 Active 42 DOM
-
2026-06-15days on market $775,000 Active 41 DOM
-
2026-06-14days on market $775,000 Active 39 DOM
-
2026-06-10days on market $775,000 Active 36 DOM
-
2026-06-09days on market $775,000 Active 35 DOM
-
2026-06-08days on market $775,000 Active 34 DOM
-
2026-06-07days on market $775,000 Active 33 DOM
-
2026-06-03days on market $775,000 Active 29 DOM
-
2026-06-02days on market $775,000 Active 28 DOM
-
2026-06-01days on market $775,000 Active 27 DOM
-
2026-06-01price $775,000 Active 26 DOM
-
2026-05-31days on market $799,000 Active 26 DOM
-
2026-05-14status Active 874-char remark
-
2026-05-09historical ActiveUnderContract 874-char remark
-
2026-05-05$799,000 Active 874-char remark
-
2023-08-23soldstatus $560,000
ⓘ Source: listings_history table (triggers on properties + properties_extension) + one-shot
backfill from property_details.listing_events for pre-trigger history.
Tax reassessment forecast OH · Partial reset (capped growth)
- Current annual tax
- $11,520 · $960/mo
- Projected year-2 tax
- $11,805 · $984/mo
- Expected delta
- +$285/yr (+$24/mo · 2.5%)
ⓘ Screening estimate from a state-policy table — verify with the county assessor before closing.
Climate risk First Street
- Flood 4/10 Moderate FEMA zone X (unshaded) · 24% chance over 30 yrs
- Wildfire 1/10 Low
- Heat 4/10 Moderate 7 d/yr ≥101°F today · 19 d/yr by 30 yrs out
- Wind 2/10 Low 100% chance of damaging wind over 30 yrs
- Air quality 3/10 Moderate 2 unhealthy d/yr today · 4 by 30 yrs out
Nearby sold comps map
Loading sold comps map…
Walkable amenities ~0.75 mi
Loading nearby amenities…
Taxation est. · year 1
- Rental income
- $114,924
- − Mortgage interest
- −$43,412
- − Property taxes
- −$11,520
- − Insurance
- −$3,875
- − Repairs & maintenance
- −$9,194
- − Management
- −$9,194
- − Depreciation
- −$22,545
- Taxable income
- $15,183
- Est. tax owed @ 24.0%
- −$3,644
- After-tax cash flow
- $22,980/yr
For passive investors: Depreciation is non-cash, so a rental often shows a tax loss while cash-flowing — sheltering income. Rental losses are passive: they offset passive income freely, and up to $25,000/yr can offset ordinary (W-2) income if you actively participate and your MAGI is under $100k (phasing out to $0 by $150k); unused losses carry forward. On sale, claimed depreciation is recaptured at up to 25%, and gains may owe capital-gains tax (a 1031 exchange can defer both). Figures are a year-1 estimate at your 24.0% rate — not tax advice; consult a CPA.
Schools (NCES district)
- District
- Miamisburg City
- NCES district ID
- 3904439
- Math proficiency
- 52% ▼ -13.00%
- Reading proficiency
- 61% ▼ -7.00%
- Median HH income
- $53,394
- Composite
- 48.47/100
- National rank
- #2128
- State rank
- #338 of 656 in OH
Livability — Miamisburg
- Score
- 76/100
- State rank
- #228
- US rank
- #3550
Category grades
Schools grade is shown separately in the Schools card above.
Census & demographics
- Census place
- Miamisburg, OH
- County
- Montgomery County · 459,541 people
- City population
- 36,152
- Metro
- Dayton-Kettering, OH
- Population (ZIP)
- 36,152
- Household income
- $84,907
- Rent vs Own
- Severe rent burden
- 790.0
Population outlook (Montgomery County) Hauer SSP2
- Today (2025)
- 523,241 people
- By 2030
- 514,948 · -1.6%
- By 2040
- 493,378 · -5.7%
- By 2050
- 469,639 · -10.2%
- By 2075
- 418,360 · -20.0%
- By 2100
- 353,315 · -32.5%
Race, ethnicity, and origin ACS 2023
- Neighborhood character
- Predominantly White (83%)
- Race & ethnicity
- White 83% Black 6% Two or more races 4% Asian 4% Hispanic / Latino 3%
- Common ancestry
- Slovak 2% Italian 2% Serbian 2%
- Foreign-born
- 6% · Canada, China
- Languages at home
- 93% English-only · Other Asian/Pacific 3% Spanish 2% Other Indo-European 1%
Political lean MEDSL · Montgomery
- 2024 margin
- Toss-up / Even · D 49.8% · R 49.3%
- 2008→2024 swing
- -5.8pp toward R · 2008: 6.2pp · 2024: 0.5pp
- All cycles
- 2024: D+0.5 2020: D+2.2 2016: R+1.2 2012: D+3.1 2008: D+6.2
Not yet ingested
- Civics
- —
Market trends
- HPI YoY
- ▼ -183.01%
- Current HPI
- 227.3999
- Rent YoY
- ▲ 3.29%
- Metro
- Dayton-Kettering, OH
- State GDP YoY
- ▲ 1.98%
- F500 in state
- 48
Industry mix (Fortune 500 HQ in OH)
| Industry | F500 HQs | Revenue |
|---|---|---|
| Insurance | 3 | $145B |
|
||
| Industrial Machinery | 3 | $49B |
|
||
| Financial Services | 3 | $24B |
|
||
| Consumer Goods | 2 | $93B |
|
||
| Aerospace / Defense | 2 | $47B |
|
||
| Utilities | 2 | $33B |
|
||
Price history
+38.4% since first listed6 events — show timeline
- 2026-06-19 Pending — Dayton MLS
- 2026-05-31 Price Changed $775,000 Dayton MLS
- 2026-05-14 Relisted — Dayton MLS
- 2026-05-09 Contingent — Dayton MLS
- 2026-05-05 Listed $799,000 Dayton MLS
- 2023-08-23 Sold (Public Records) $560,000 Public Records
Property tax history
+6.4%/yrLatest (2025): $11,520 · +99.4% YoY. Source: county tax records.
Cash-flow waterfall
monthlySold comps — $/sqft
last 12 mo · ≤1 miLoading sold comps…