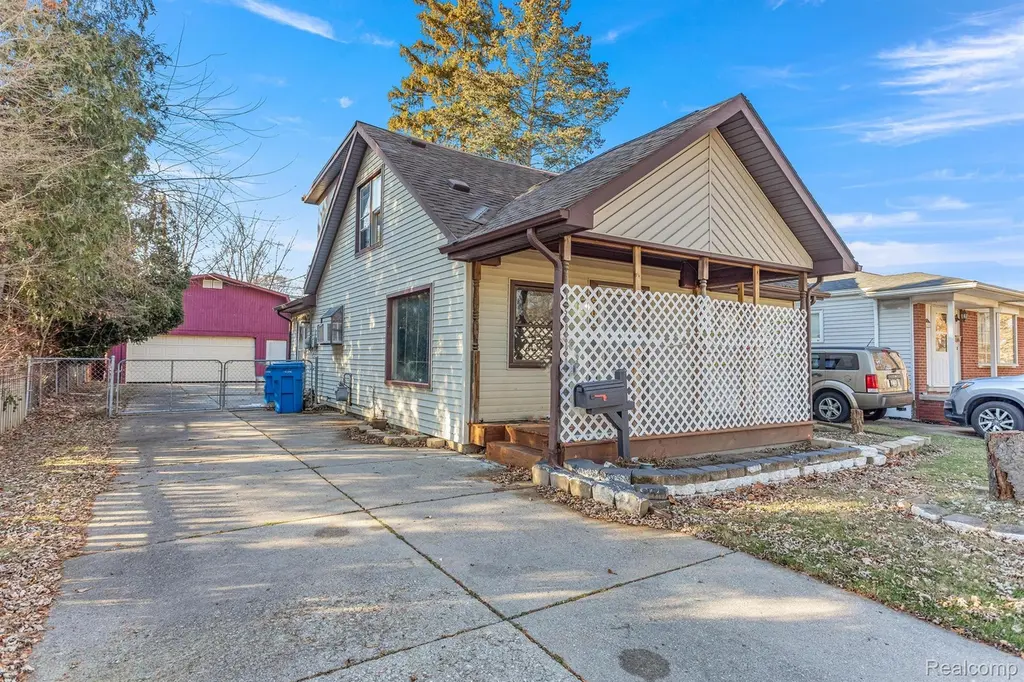
4500 Katherine St · Dearborn Heights, MI
Flood risk 2/10 · Minimal
- FEMA flood zone
- X
- Chance of flooding over 30 yrs
- 0.09%
- Est. flood insurance / yr
- $507 – $1,088
Fire risk 1/10 · Minimal
- Est. fire insurance / yr
- $784 – $1,456
Heat risk 3/10 · Minor
- Hot days now (above 98°F)
- 7 days/yr
- Hot days in 30 yrs
- 14 days/yr
Wind risk 2/10 · Minimal
- Chance of severe wind over 30 yrs
- —
Air-quality risk 2/10 · Minimal
- Unhealthy air days now
- 1 days/yr
- Unhealthy air days in 30 yrs
- 2 days/yr
Risk factors via First Street. Map © Google.
Why this score? — see what drove the D+ grade
The composite is a weighted blend of 9 inputs, each scored 0–100. Each bar is that input's sub-score; the figure is the points it added to the 100-point composite (weight × sub-score).
- Cash flow +15.2/30.0
- ARV discount +12.4/15.0
- 1% rule +5.4/10.0
- DSCR +4.7/10.0
- Livability +4.0/5.0
- Rent growth +3.0/5.0
- Condition / age +2.5/5.0
- Schools +1.7/10.0
- Appreciation +0.0/10.0
$159,700
🖨 Deal sheet (PDF) 📄 Offer letter ✓ Due diligence
Listing remarks MLS
SOLD AS-IS. Buyer is responsible for obtaining and completing all required city inspections. Please note there is currently no DTE service connected to the property. This spacious 4-bedroom home in Dearborn Heights is ready for its next owner and offers endless potential with just a little personal touch. Outside, you'll find a fully fenced yard and a highly desirable oversized garage complete with a loft area above, perfect for storage, a workshop, or hobby space. Don't miss this great opportunity to make this home your own. BATVAI.
Key facts
- Fully fenced yard
- Loft area
- Oversized garage
Tags
Property features AI
Exterior
- Parking: Detached 2-car garage
- Utilities: Public water; Sewer available
- Home design: Single-family residence; One and one-half stories; Ground-level entry with steps; Aluminum siding construction
- Construction: Aluminum siding exterior
- Exterior features: Paved road access; Lot approximately 0.15 acres (47.10 x 138.00)
Interior
- Bathrooms: One full bathroom
- Heating & cooling: Forced air heating; Natural gas heating; No central cooling
- Interior features: Crawl space basement; Six total rooms
Neighborhood map
What this means for you Summary
Snapshot
- This is a 3-bed/1.0-bath single-family listed at $160k.
Deal economics
- At list price, monthly cash flow is $55 ($664/yr) — positive.
- The deal already cash-flows at list — no discount required.
- Meets the 1% rule at list price ($2k rent vs $160k).
- Cap rate 6.7% vs local median 5.5% in Dearborn Heights — meaningfully above typical; check what's discounted (condition, days-on-market, listing class) to confirm the premium yield is real.
Location & tenants
- Location reads 79/100 on livability (#82 in MI, #1,885 nationally) — a middle-class / working-renter tenant base. Strengths: commute A+, cost of living A+, housing A+; Watch: crime D+, employment D+, health & safety D+.
- Dearborn Heights School District #7 (suburban): math 13% / reading 26% proficiency, ranked #466 of 540 in MI (top 86%) — low school quality limits family demand, transient renter base, plan for 1-2y turnover; 60% free/reduced lunch — lower-income household profile, screen leases tightly.
- Zoned schools: Oakley W Best Middle School (math 12% / reading 31%, grade F, #415 of 493 statewide, top 85%, 586 students, 82% FRL); Annapolis High School (math 12% / reading 32%, grade F, #582 of 713 statewide, top 83%, 748 students, 77% FRL) — zoned schools average 79% FRL vs 60% district-wide (19 pts higher); higher-poverty schools than district average — tighter screening recommended.
- Market conditions: Rents rising (+2.0%/yr); 139 active listings in the ZIP; 21 comparable units currently listed for rent nearby; rentals leasing fast (median 12d on market — plan ~1-2 weeks tenant-placement turnaround); 2,639 units permitted in Wayne County in 2024 (1,216 in 5+ unit buildings).
- This rent runs 33% of the median local income ($60k/yr) — at the standard rent-burdened threshold; future hikes will face affordability resistance.
Forward outlook
- Local home prices are declining (-3.0%/yr); year-one equity from $1k of loan paydown is wiped out by about $5k of value loss. Plan a longer hold.
- Wayne County population projected at -17% by 2050 — secular population decline; favor cash flow + early exit over multi-decade hold.
Negotiation context
- Only 5 days on market — expect competitive offers; lowballing is unlikely to land.
- 13 sale attempts since 16y ago with the ask held roughly flat each time — persistent listings suggest the price (not the market) is what's stuck; bring a comps-based counter.
- Current owner paid $115k; 39% above their basis — modest negotiation headroom, anchor on the comps not their cost.
Risks & watch-outs
- Watch-outs: property tax is 2.7% of price; built in 1941 — expect roof / HVAC / electrical / plumbing capex.
Questions for the listing agent
- Built in 1941 — when were the roof, HVAC, electrical panel, plumbing, and water heater last replaced?
- Property tax is high relative to price — has the assessment been appealed recently, and will the sale trigger a re-assessment?
- Is there a deadline driving the sale (1031 exchange, divorce, estate, relocation)? That informs how much negotiation room exists.
- Crime grade is D in this area — have there been break-ins, vandalism, or insurance claims at this property in the last 3 years? What carrier currently insures it and at what premium?
- The area grade is low — what's the realistic commute time and amenity access for the typical tenant pool here? Any planned neighborhood developments (good or bad) we should know about?
- What's the average days-on-market for RENTAL listings here right now (not sales)? A rising rental-DOM trend means longer vacancies and softer asking-rent achievability than the comps imply.
- What's the recent tenant-quality profile in this submarket — average credit score on applications, eviction rate, late-payment / NSF rate, and stable-employment percentage? A property-management company in the area should have these aggregated.
- How much new for-sale + rental construction is in the pipeline within 1–3 miles? Heavy new supply typically softens prices + rents 12–24 months out; constrained supply supports both.
Investment metrics
- 1% rule
- 1.04% ✓
- Cap rate
- 6.71%
- Cash-on-cash
- 1.49%
- DSCR
- 1.07
- GRM
- 8.0
CMA / ARV
- ARV (on-the-fly)
- $179,280
- Comps found
- 12
Show comp detail 12 sales within ~0.75 mi
| Address | Dist | Beds/Ba | Sqft | Sold | Price | $/sf | Match |
|---|---|---|---|---|---|---|---|
| 4196 Clippert St | 0.22mi | 3/1.0 | 1,243 (-6%) | 2mo | $189,500 | $152 | 77 |
| 4994 Campbell St | 0.34mi | 3/1.0 | 1,422 (+7%) | 1mo | $167,000 | $117 | 71 |
| 20616 Powers Ave | 0.62mi | 3/1.0 | 1,288 (-3%) | 3mo | $150,000 | $116 | 64 |
| 4204 Hipp St | 0.58mi | 4/1.0 (+1) | 1,296 (-2%) | 1mo | $95,000 | $73 | 63 |
| 4204 Hipp St | 0.58mi | 4/1.0 (+1) | 1,296 (-2%) | 1mo | $95,000 | $73 | 63 |
| 4449 Academy St | 0.71mi | 3/2.0 | 1,312 (-1%) | 2mo | $203,000 | $155 | 60 |
| 4494 Huron St | 0.63mi | 4/1.0 (+1) | 1,250 (-6%) | 6mo | $190,000 | $152 | 51 |
| 3610 Bennett St | 0.71mi | 3/1.5 | 1,456 (+10%) | 2mo | $285,000 | $196 | 47 |
| 4457 Grindley Park St | 0.63mi | 3/1.0 | 1,515 (+14%) | 0mo | $125,000 | $83 | 47 |
| 3804 Campbell St | 0.47mi | 3/1.5 | 1,130 (-15%) | 6mo | $190,000 | $168 | 46 |
| 4433 Mayfair St | 0.72mi | 3/1.5 | 1,475 (+11%) | 1mo | $196,000 | $133 | 45 |
| 3360 Alice St | 0.69mi | 3/2.0 | 1,185 (-11%) | 5mo | $160,000 | $135 | 41 |
Match score weights: distance 35% · size 25% · config 20% · recency 20%. Top-matched comps best support the ARV.
Projected returns pro-forma
-3.0% appreciation · 2.03% rent growth · sell at horizon
- IRR
- -15.1%
- Equity multiple
- 0.47×
- Total profit
- $-23,841
- Equity at exit
- $23,812
- IRR
- -8.3%
- Equity multiple
- 0.50×
- Total profit
- $-22,206
- Equity at exit
- $13,808
Cash invested: $44,716 (down + closing). Projections, not guarantees.
Landlord ↔ Tenant lean methodology
- Overall (STATE)
- 62 Landlord-Friendly
- State Michigan
- 62 Landlord-Friendly · EVEN
- County
- — inherits STATE
- City
- — inherits STATE
ZIP-level market 48125
- Rents YoY
- 2.0%
- Active inventory
- 139
- Price-to-rent
- 8.0×
Monthly cashflow live
- Estimated rent
- $1,666 high interval (Pro) →
- Mortgage (P&I)
- −$837
- Tax from tax record
- −$357 /mo · $4,278/yr
- Insurance
- −$67
- HOA
- −$0
- Vacancy / Maint / Mgmt
- −$350
- Net cashflow
- $55
Break-even live
Sensitivity live
| Price | -10% $146 | -5% $101 | +0% $55 | +5% $10 | +10% $-35 |
|---|---|---|---|---|---|
| Rent | -10% $-76 | -5% $-10 | +0% $55 | +5% $121 | +10% $187 |
| Rate | -1.0pp $136 | -0.5pp $96 | base $55 | +0.5pp $14 | +1.0pp $-28 |
UW: 25.0% down · 7.5% · 30yr · 1.5% tax · 5.0% vac · 8.0% maint · 8.0% mgmt
Financing live
Cash to close
- Down payment
- $39,925
- Closing costs
- $4,791
- Reserves months
- —
- Total cash needed
- —
Loan-product check · same deal, 3 products live
Conventional
25% down · 7.5% · 30yr
- Down + closing
- —
- Monthly P&I
- —
- Monthly cashflow
- —
- DSCR
- —
- Eligible?
- —
Personal DTI + credit; lowest rate.
DSCR
20% down · 8.5% · 30yr
- Down + closing
- —
- Monthly P&I
- —
- Monthly cashflow
- —
- DSCR
- —
- Eligible?
- —
No personal income docs; deal must DSCR.
Hard money
10% down · 12.0% · 12mo
- Down + closing
- —
- Monthly P&I
- —
- Monthly cashflow
- —
- DSCR
- —
- Eligible?
- —
Short-term bridge; refi at stabilization.
Rent comps 21 comps
| Address | Beds | Baths | Sqft | Rent | $/sqft | DOM | Units | Dist |
|---|---|---|---|---|---|---|---|---|
| 4757 Dudley St Dearborn Heights, MI | 3.0 | 1.0 | 995 | $1,350 | $1.36 | 12d | 1 | 0.13mi |
| 4934 McKinley St Dearborn Heights, MI | 3.0 | 1.0 | 1051 | $1,700 | $1.62 | 0d | 1 | 0.26mi |
| 4810 Campbell St Dearborn Heights, MI | 3.0 | 1.0 | 1000 | $1,700 | $1.70 | 0d | 1 | 0.26mi |
| 4638 Gertrude St Dearborn Heights, MI | 3.0 | 1.0 | 1020 | $1,700 | $1.67 | 7d | 1 | 0.31mi |
| 4914 Gertrude St Dearborn Heights, MI | 2.0 | 1.0 | 908 | $1,230 | $1.35 | 19d | 1 | 0.34mi |
| 3620 Monroe St Dearborn, MI | 3.0 | 2.0 | 1100 | $1,800 | $1.64 | 12d | 1 | 0.54mi |
| 20728 Carlysle St Dearborn, MI | 3.0 | 1.0 | 1087 | $1,850 | $1.70 | 0d | 1 | 0.69mi |
| 3901 Academy St Dearborn Heights, MI | 4.0 | 2.0 | 1400 | $2,100 | $1.50 | 0d | 1 | 0.78mi |
| 4704 Jackson St Dearborn Heights, MI | 3.0 | 1.0 | 1000 | $1,500 | $1.50 | 23d | 1 | 0.82mi |
| 4631 Ziegler St Dearborn Heights, MI | 3.0 | 1.0 | 1050 | $1,650 | $1.57 | 45d | 1 | 0.91mi |
| 21337 Audette St Dearborn, MI | 3.0 | 1.0 | 964 | $1,850 | $1.92 | 45d | 1 | 1.02mi |
| 2825 Queen St Dearborn, MI | 2.0 | 1.0 | 1000 | $1,299 | $1.30 | 45d | 1 | 1.18mi |
| 2823 Queen St Dearborn, MI | 3.0 | 2.0 | 1400 | $1,599 | $1.14 | 20d | 1 | 1.18mi |
| 24154 Dartmouth St Dearborn, MI | 2.0 | 1.0 | 950 | $1,275 | $1.34 | 16d | 1 | 1.24mi |
| 5371 Culver St Dearborn Heights, MI | 3.0 | 1.0 | 980 | $1,500 | $1.53 | 12d | 1 | 1.27mi |
| 5371 Culver St Dearborn Heights, MI | 3.0 | 1.0 | 980 | $1,450 | $1.48 | 3d | 1 | 1.27mi |
| 2631 Woodside St Dearborn, MI | 3.0 | 1.0 | 894 | $1,650 | $1.85 | 0d | 1 | 1.37mi |
| 24601 Andover Dr Dearborn Heights, MI | 3.0 | 1.5 | 1092 | $1,700 | $1.56 | 3d | 1 | 1.40mi |
| 24442 Union St Dearborn, MI | 3.0 | 1.5 | 1000 | $1,900 | $1.90 | 0d | 1 | 1.42mi |
| 24684 Lehigh St Dearborn Heights, MI | 4.0 | 1.0 | 878 | $1,600 | $1.82 | 14d | 1 | 1.45mi |
| 4565 Fleming St Dearborn Heights, MI | 3.0 | 1.0 | 1200 | $1,600 | $1.33 | 12d | 1 | 1.46mi |
Listing history 4 events
-
2026-06-21days on market $159,700 Active 5 DOM
-
2026-06-18days on market $159,700 Active 2 DOM
-
2026-06-17remarks 539-char remark
-
2026-06-17$159,700 Active 1 DOM
ⓘ Source: listings_history table (triggers on properties + properties_extension) + one-shot
backfill from property_details.listing_events for pre-trigger history.
Tax reassessment forecast MI · Partial reset (capped growth)
- Current annual tax
- $4,278 · $357/mo
- Projected year-2 tax
- $4,278 · $357/mo
- Expected delta
- $0/yr ($0/mo · 0.0%)
ⓘ Screening estimate from a state-policy table — verify with the county assessor before closing.
Climate risk First Street
- Flood 2/10 Low FEMA zone X · 9% chance over 30 yrs
- Wildfire 1/10 Low
- Heat 3/10 Moderate 7 d/yr ≥98°F today · 14 d/yr by 30 yrs out
- Wind 2/10 Low
- Air quality 2/10 Low 1 unhealthy d/yr today · 2 by 30 yrs out
Nearby sold comps map
Loading sold comps map…
Walkable amenities ~0.75 mi
Loading nearby amenities…
Taxation est. · year 1
- Rental income
- $19,989
- − Mortgage interest
- −$8,946
- − Property taxes
- −$4,278
- − Insurance
- −$798
- − Repairs & maintenance
- −$1,599
- − Management
- −$1,599
- − Depreciation
- −$4,646
- Taxable loss
- −$1,878
- Est. tax savings @ 24.0%
- +$451
- After-tax cash flow
- $1,115/yr
For passive investors: Depreciation is non-cash, so a rental often shows a tax loss while cash-flowing — sheltering income. Rental losses are passive: they offset passive income freely, and up to $25,000/yr can offset ordinary (W-2) income if you actively participate and your MAGI is under $100k (phasing out to $0 by $150k); unused losses carry forward. On sale, claimed depreciation is recaptured at up to 25%, and gains may owe capital-gains tax (a 1031 exchange can defer both). Figures are a year-1 estimate at your 24.0% rate — not tax advice; consult a CPA.
Schools (NCES district)
- District
- Dearborn Heights School District #7
- NCES district ID
- 2611610
- Math proficiency
- 13% ▼ -10.00%
- Reading proficiency
- 26% ▼ -7.00%
- Median HH income
- $47,468
- Composite
- 17.21/100
- National rank
- #9101
- State rank
- #466 of 540 in MI
Livability — Dearborn Heights
- Score
- 79/100
- State rank
- #82
- US rank
- #1885
Category grades
Schools grade is shown separately in the Schools card above.
Census & demographics
- Census place
- Dearborn Heights, MI
- County
- Wayne County · 1,562,939 people
- City population
- 61,771
- Metro
- Detroit-Warren-Dearborn, MI
- Population (ZIP)
- 22,125
- Household income
- $60,195
- Rent vs Own
- Severe rent burden
- 654.0
Population outlook (Wayne County) Hauer SSP2
- Today (2025)
- 1,675,273 people
- By 2030
- 1,620,300 · -3.3%
- By 2040
- 1,502,341 · -10.3%
- By 2050
- 1,384,039 · -17.4%
- By 2075
- 1,124,592 · -32.9%
- By 2100
- 881,193 · -47.4%
Race, ethnicity, and origin ACS 2023
- Neighborhood character
- Predominantly White (76%)
- Race & ethnicity
- White 76% Black 10% Two or more races 9% Hispanic / Latino 9%
- Hispanic origin (detail)
- Mexican 6%
- Common ancestry
- Romanian 11% Arab 3% Slovak 2%
- Foreign-born
- 11% · Canada
- Languages at home
- 82% English-only · Arabic 13% Spanish 3% Russian/Polish/Slavic 1%
Political lean MEDSL · Wayne
- 2024 margin
- Strong D (+29.0) · D 62.7% · R 33.7% · Other 3.6%
- 2008→2024 swing
- -20.5pp toward R · 2008: 49.5pp · 2024: 29.0pp
- All cycles
- 2024: D+29.0 2020: D+38.1 2016: D+37.3 2012: D+46.9 2008: D+49.5
Not yet ingested
- Civics
- —
Market trends
- HPI YoY
- ▼ -214.70%
- Current HPI
- 218.4698
- Rent YoY
- ▲ 2.03%
- Metro
- Detroit-Warren-Dearborn, MI
- State GDP YoY
- ▲ 1.37%
- F500 in state
- 28
Industry mix (Fortune 500 HQ in MI)
| Industry | F500 HQs | Revenue |
|---|---|---|
| Automotive Parts | 3 | $48B |
|
||
| Automotive | 2 | $372B |
|
||
| Chemicals | 1 | $45B |
|
||
| Automotive Retail | 1 | $29B |
|
||
| Healthcare / Medical Devices | 1 | $23B |
|
||
| Automotive Technology | 1 | $20B |
|
||
Price history
+432.3% since first listed33 events — show timeline
- 2026-06-16 Listed $159,700 REALCOMP
- 2026-06-16 Listed $159,700 MiRealSource-MiMLS
- 2024-02-26 Listing Removed — REALCOMP
- 2024-02-26 Listing Removed — MiRealSource-MiMLS
- 2024-01-24 Listing Removed — MiRealSource-MiMLS
- 2024-01-24 Listed $157,700 MiRealSource-MiMLS
- 2024-01-24 Listed $157,700 REALCOMP
- 2024-01-24 Listing Removed — REALCOMP
- 2023-12-22 Listed $157,700 MiRealSource-MiMLS
- 2023-12-22 Listed $157,700 REALCOMP
- 2020-11-11 Sold (Public Records) $115,000 Public Records
- 2020-10-30 Sold (MLS) $115,000 MiRealSource-MiMLS
- 2020-10-30 Sold (MLS) $115,000 REALCOMP
- 2020-10-21 Pending — MiRealSource-MiMLS
- 2020-10-21 Pending — REALCOMP
- 2020-10-11 Contingent — MiRealSource-MiMLS
- 2020-10-10 Contingent — REALCOMP
- 2020-09-23 Listed $119,900 MiRealSource-MiMLS
- 2020-09-23 Listed $119,900 REALCOMP
- 2017-05-04 Sold (Public Records) $57,000 Public Records
- 2017-04-20 Sold (MLS) $57,000 MiRealSource-MiMLS
- 2017-04-20 Sold (MLS) $57,000 REALCOMP
- 2017-02-24 Pending — MiRealSource-MiMLS
- 2017-02-23 Pending — REALCOMP
- 2017-01-31 Listed $69,900 MiRealSource-MiMLS
- 2017-01-30 Listed $69,900 REALCOMP
- 2011-04-14 Sold (MLS) $22,000 MiRealSource-MiMLS
- 2011-04-14 Sold (MLS) $22,000 REALCOMP
- 2011-04-04 Listing Removed — MiRealSource-MiMLS
- 2011-02-15 Listed $22,900 MiRealSource-MiMLS
- 2011-02-15 Listed $22,900 REALCOMP
- 2010-11-17 Listing Removed — REALCOMP
- 2010-01-12 Listed $30,000 REALCOMP
Property tax history
+6.2%/yrLatest (2025): $4,278 · +3.7% YoY. Source: county tax records.
Cash-flow waterfall
monthlySold comps — $/sqft
last 12 mo · ≤1 miLoading sold comps…