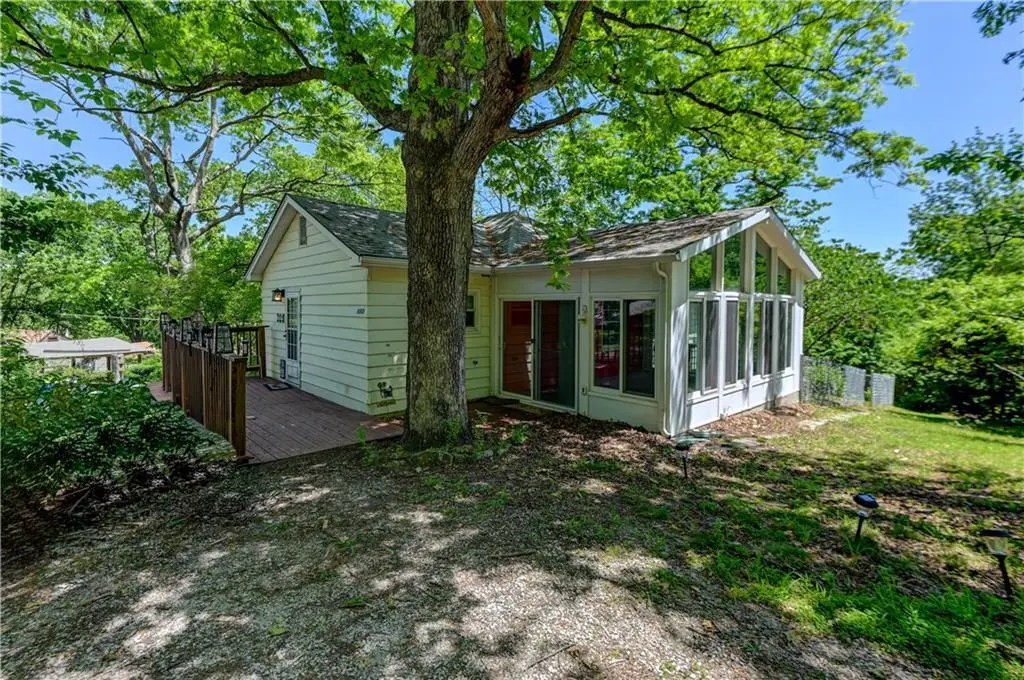
5363 NW Wagon Trl · Houston Lake, MO
Flood risk 1/10 · Minimal
- FEMA flood zone
- X (unshaded)
- Chance of flooding over 30 yrs
- 0.0%
- Est. flood insurance / yr
- $473 – $860
Fire risk 1/10 · Minimal
- Est. fire insurance / yr
- $1,054 – $1,958
Heat risk 4/10 · Minor
- Hot days now (above 106°F)
- 7 days/yr
- Hot days in 30 yrs
- 17 days/yr
Wind risk 2/10 · Minimal
- Chance of severe wind over 30 yrs
- —
Air-quality risk 3/10 · Minor
- Unhealthy air days now
- 2 days/yr
- Unhealthy air days in 30 yrs
- 3 days/yr
Risk factors via First Street. Map © Google.
Why this score? — see what drove the D grade
The composite is a weighted blend of 9 inputs, each scored 0–100. Each bar is that input's sub-score; the figure is the points it added to the 100-point composite (weight × sub-score).
- ARV discount +13.0/15.0
- Cash flow +10.3/30.0
- Schools +4.5/10.0
- Livability +3.8/5.0
- Rent growth +3.7/5.0
- 1% rule +3.4/10.0
- DSCR +3.0/10.0
- Condition / age +2.5/5.0
- Appreciation +0.0/10.0
$235,000
🖨 Deal sheet 📄 Offer letter ✓ Due diligence
Listing remarks MLS
THIS HOUSE HAS A CONTRACT PENDING LENDERS APPROVAL WITH A BACK-UP ALSO. QUAINT LAKE HOME WITH DOUBLE LOT AND 2 CAR DETACHED GARAGES. THIS HOUSE HAS ONE BIG MASTER BEDROOM ON THE MAIN FLOOR ALONG WITH GREAT ROOM, BATH AND KITCHEN WITH BREAKFAST AREA PLUS IN THE LOWER AREA THERE ARE 2 OTHER ROOMS THAT CAN BE BEDROOMS AND A FINISHED RECREATION RM NOTE: SHORT SALE AND SUBJECT TO THIRD PARTY APPROVAL. (Contract accepted by sellers - subject to third party approval), Show for backup
Key facts
- 0.28 acre lot
- 2 garage spots
- Built 1957
Property features AI
Finance
- HOA & community: Member of Venetian Gardens Homes Association; Annual association fee of $450
Exterior
- Parking: Detached 2-car garage
- Utilities: Public water; Public sewer; Cable available
- Home design: Single-family residential; Ranch floor plan; Fixer condition
- Construction: Board & batten siding; Composition roof
- Exterior features: Deck; Metal fencing; Corner lot; Lake access with boat ramp (second lake tier)
Interior
- Kitchen: Cooktop; Built-in oven; Electric range; Microwave; Dishwasher; Disposal; Refrigerator
- Bedrooms: Two bedrooms (one on the first floor, one in the basement)
- Flooring: Carpet; Luxury vinyl; Tile; Wood
- Bathrooms: Two full bathrooms and one half bath; Primary bath with double vanity and separate shower and tub
- Heating & cooling: Natural gas heating; Electric cooling (central air)
- Interior features: Open concept living and dining areas (Kit/Dining combo); Family room / Great room; Main-floor primary bedroom and main-floor bedroom; Sun room; Recreation room in basement; Walk-out basement with sump pump
- Laundry & utility: Washer and dryer; Laundry located in basement
Neighborhood map
What this means for you Summary
Snapshot
- This is a 3-bed/1.0-bath single-family listed at $235k.
Deal economics
- At list price, monthly cash flow is $-129 ($-2k/yr) — negative.
- To cash-flow at today's rent, offer at most $212k (9.7% below list).
- To meet the 1% rule (rent ≥ 1% of price), the offer needs to be $196k (16.4% below list).
- Recommended offer: $196k (16.4% below list) — sets the bar for 1% rule.
Location & tenants
- Location reads 76/100 on livability (#46 in MO, #3,625 nationally) — a middle-class / working-renter tenant base. Strengths: commute A+, cost of living A+, housing A+; Watch: crime C-, health & safety C-, amenities F.
- Park Hill (urban): math 47% / reading 54% proficiency, ranked #26 of 324 in MO (top 8%) — acceptable for families but not a draw, mixed tenant base, ~2y average lease.
- Zoned schools: Southeast Elem. (math 45% / reading 49%, grade D-, #347 of 1,115 statewide, top 35%, 500 students, 32% FRL); Park Hill South High (math 67% / reading 69%, grade B, #13 of 521 statewide, top 2%, 1,860 students, 25% FRL).
- Market conditions: Rents rising fast (+4.8%/yr); 166 active listings in the ZIP; 6 comparable units currently listed for rent nearby; rentals at typical pace (median 21d on market — plan ~3-4 weeks tenant-placement turnaround); solid renter incomes; 234 units permitted in Platte County in 2024 (0 in 5+ unit buildings).
Forward outlook
- Local home prices are declining (-3.0%/yr); year-one equity from $2k of loan paydown is wiped out by about $7k of value loss. Plan a longer hold.
- Platte County population projected at +31% by 2050 — long-run rental-demand tailwind backs the buy-and-hold thesis.
Negotiation context
- It's been on market 15 days — a 2% lower offer ($231k) is reasonable based on typical stale-listing flexibility.
- 5 sale attempts since 25y ago with the ask held roughly flat each time — persistent listings suggest the price (not the market) is what's stuck; bring a comps-based counter.
Risks & watch-outs
- Watch-outs: built in 1957 — expect roof / HVAC / electrical / plumbing capex.
Questions for the listing agent
- What do current leases actually rent for vs. the listed asking? Can we see a recent rent roll and the last 12 months of T-12 income?
- Built in 1957 — when were the roof, HVAC, electrical panel, plumbing, and water heater last replaced?
- What does the HOA fee cover, when was the last increase, and are there any pending special assessments or reserve-fund shortfalls?
- Is there a deadline driving the sale (1031 exchange, divorce, estate, relocation)? That informs how much negotiation room exists.
- Schools are D-rated, which usually means shorter tenancies and higher turnover. Who's the typical renter profile here, and what's been the actual vacancy rate?
- The area grade is low — what's the realistic commute time and amenity access for the typical tenant pool here? Any planned neighborhood developments (good or bad) we should know about?
- What's the average days-on-market for RENTAL listings here right now (not sales)? A rising rental-DOM trend means longer vacancies and softer asking-rent achievability than the comps imply.
- What's the recent tenant-quality profile in this submarket — average credit score on applications, eviction rate, late-payment / NSF rate, and stable-employment percentage? A property-management company in the area should have these aggregated.
- How much new for-sale + rental construction is in the pipeline within 1–3 miles? Heavy new supply typically softens prices + rents 12–24 months out; constrained supply supports both.
Investment metrics
- 1% rule
- 0.84% ✗
- Cap rate
- 5.63%
- Cash-on-cash
- -2.36%
- DSCR
- 0.90
- GRM
- 10.0
CMA / ARV
- ARV (median comp)
- $267,475
- List price
- $235,000
- Delta
- -12.14%
- Verdict
- UNDERPRICED
- Comps
- 20 within 1.0 mi
Show comp detail 12 sales within ~0.75 mi
| Address | Dist | Beds/Ba | Sqft | Sold | Price | $/sf | Match |
|---|---|---|---|---|---|---|---|
| 5103 NW High Drive Ter | 0.34mi | 3/1.5 | 1,549 (-3%) | 3mo | $265,000 | $171 | 74 |
| 5451 NW Venetian Dr | 0.21mi | 2/2.0 (-1) | 1,484 (-7%) | 1mo | $269,950 | $182 | 69 |
| 5304 NW Wagon Trl | 0.10mi | 3/2.5 | 1,426 (-10%) | 3mo | $265,000 | $186 | 69 |
| 5005 NW Merrimac Ave | 0.44mi | 3/2.0 | 1,680 (+5%) | 1mo | $325,000 | $193 | 66 |
| 5817 N Lenox Ave | 0.59mi | 3/2.0 | 1,531 (-4%) | 6mo | $265,000 | $173 | 56 |
| 4310 NW 51st St | 0.58mi | 2/2.0 (-1) | 1,524 (-4%) | 2mo | $238,000 | $156 | 55 |
| 4402 NW 50th St | 0.68mi | 3/1.5 | 1,518 (-5%) | 4mo | $248,000 | $163 | 55 |
| 4816 NW High Dr | 0.64mi | 3/2.5 | 1,550 (-3%) | 6mo | $295,000 | $190 | 55 |
| 5018 NW Huonker Rd | 0.65mi | 3/1.5 | 1,496 (-6%) | 4mo | $249,000 | $166 | 54 |
| 5406 N Northwood Rd | 0.50mi | 3/2.0 | 1,736 (+9%) | 8mo | $675,000 | $389 | 51 |
| 5919 N Adrian Ter | 0.66mi | 3/2.0 | 1,512 (-5%) | 10mo | $264,950 | $175 | 49 |
| 4405 NW 50th Ter | 0.67mi | 3/2.5 | 1,742 (+9%) | 7mo | $289,950 | $166 | 42 |
Match score weights: distance 35% · size 25% · config 20% · recency 20%. Top-matched comps best support the ARV.
Projected returns pro-forma
-3.0% appreciation · 4.8% rent growth · sell at horizon
- IRR
- -18.1%
- Equity multiple
- 0.35×
- Total profit
- $-42,618
- Equity at exit
- $35,039
- IRR
- -7.1%
- Equity multiple
- 0.51×
- Total profit
- $-32,019
- Equity at exit
- $20,319
Cash invested: $65,800 (down + closing). Projections, not guarantees.
Landlord ↔ Tenant lean methodology
- Overall (STATE)
- 81 Strongly Landlord-Friendly
- State Missouri
- 81 Strongly Landlord-Friendly · R+10
- County
- — inherits STATE
- City
- — inherits STATE
ZIP-level market 64151
- Rents YoY
- 4.8%
- Active inventory
- 166
- Price-to-rent
- 10.0×
Monthly cashflow live
- Estimated rent
- $1,965 high interval (Pro) →
- Mortgage (P&I)
- −$1,232
- Tax from tax record
- −$313 /mo · $3,756/yr
- Insurance
- −$98
- HOA
- −$38
- Vacancy / Maint / Mgmt
- −$413
- Net cashflow
- $-129
Break-even live
UW: 25.0% down · 7.5% · 30yr · 1.5% tax · 5.0% vac · 8.0% maint · 8.0% mgmt
Financing live
Cash to close
- Down payment
- $58,750
- Closing costs
- $7,050
- Reserves months
- —
- Total cash needed
- —
Loan-product check · same deal, 3 products live
Conventional
25% down · 7.5% · 30yr
- Down + closing
- —
- Monthly P&I
- —
- Monthly cashflow
- —
- DSCR
- —
- Eligible?
- —
Personal DTI + credit; lowest rate.
DSCR
20% down · 8.5% · 30yr
- Down + closing
- —
- Monthly P&I
- —
- Monthly cashflow
- —
- DSCR
- —
- Eligible?
- —
No personal income docs; deal must DSCR.
Hard money
10% down · 12.0% · 12mo
- Down + closing
- —
- Monthly P&I
- —
- Monthly cashflow
- —
- DSCR
- —
- Eligible?
- —
Short-term bridge; refi at stabilization.
Rent comps 6 comps
| Address | Beds | Baths | Sqft | Rent | $/sqft | DOM | Units | Dist |
|---|---|---|---|---|---|---|---|---|
| 5630 NW Hillside Dr Kansas City, MO | 3.0 | 1.0 | 1600 | $1,750 | $1.09 | 4d | 1 | 0.49mi |
| 5103 NW Goodman St Riverside, MO | 3.0 | 2.5 | 1357 | $2,105 | $1.55 | 2d | 14 | 0.77mi |
| 2200 NW 56th Ter Kansas City, MO | 3.0 | 2.0 | 1464 | $1,899 | $1.30 | 44d | 1 | 1.08mi |
| 5709 N Harden Ave Kansas City, MO | 3.0 | 2.0 | 2100 | $2,145 | $1.02 | 20d | 1 | 1.11mi |
| 6360 N London Ave Kansas City, MO | 1.0–3.0 | 1.0–2.0 | 885 | $2,179 | $2.46 | 2d | 1 | 1.31mi |
| 5506 N Fairmount Ave Kansas City, MO | 2.0 | 1.5 | 1344 | $1,549 | $1.15 | 44d | 1 | 1.44mi |
HOA detail
- Monthly dues
- $38 · $456/yr
Listing history 13 events
-
2026-06-18days on market $235,000 Active 15 DOM
-
2026-06-17remarks 699-char remark
-
2026-06-17days on market $235,000 Active 14 DOM
-
2026-06-16days on market $235,000 Active 13 DOM
-
2026-05-15$235,000 Active 657-char remark
-
2026-05-14historical $235,000 657-char remark
-
2010-04-14soldstatus
-
2010-04-09soldstatus 481-char remark
Show marketing remark (481 chars)
THIS HOUSE HAS A CONTRACT PENDING LENDERS APPROVAL WITH A BACK-UP ALSO. QUAINT LAKE HOME WITH DOUBLE LOT AND 2 CAR DETACHED GARAGES. THIS HOUSE HAS ONE BIG MASTER BEDROOM ON THE MAIN FLOOR ALONG WITH GREAT ROOM, BATH AND KITCHEN WITH BREAKFAST AREA PLUS IN THE LOWER AREA THERE ARE 2 OTHER ROOMS THAT CAN BE BEDROOMS AND A FINISHED RECREATION RM NOTE: SHORT SALE AND SUBJECT TO THIRD PARTY APPROVAL. (Contract accepted by sellers - subject to third party approval), Show for backup
-
2008-09-11$69,000 481-char remark
Show marketing remark (481 chars)
THIS HOUSE HAS A CONTRACT PENDING LENDERS APPROVAL WITH A BACK-UP ALSO. QUAINT LAKE HOME WITH DOUBLE LOT AND 2 CAR DETACHED GARAGES. THIS HOUSE HAS ONE BIG MASTER BEDROOM ON THE MAIN FLOOR ALONG WITH GREAT ROOM, BATH AND KITCHEN WITH BREAKFAST AREA PLUS IN THE LOWER AREA THERE ARE 2 OTHER ROOMS THAT CAN BE BEDROOMS AND A FINISHED RECREATION RM NOTE: SHORT SALE AND SUBJECT TO THIRD PARTY APPROVAL. (Contract accepted by sellers - subject to third party approval), Show for backup
-
2005-12-20soldstatus
Show marketing remark (311 chars)
Enjoy the changing seasons at beautiful Houston Lake. Picture yourself on a private, treed lot on your wrap around deck. This charming home is in the highly rated Park Hill School district. It has 2 great living areas, newer windows & the refrigerator stays. Easy access to I-29, airport & downtown.
-
2005-08-15$99,900
Show marketing remark (311 chars)
Enjoy the changing seasons at beautiful Houston Lake. Picture yourself on a private, treed lot on your wrap around deck. This charming home is in the highly rated Park Hill School district. It has 2 great living areas, newer windows & the refrigerator stays. Easy access to I-29, airport & downtown.
-
2001-12-09soldstatus
-
2001-10-25$95,850
ⓘ Source: listings_history table (triggers on properties + properties_extension) + one-shot
backfill from property_details.listing_events for pre-trigger history.
Tax reassessment forecast MO · Resets to sale price
- Current annual tax
- $3,756 · $313/mo
- Projected year-2 tax
- $3,756 · $313/mo
- Expected delta
- $0/yr ($0/mo · 0.0%)
ⓘ Screening estimate from a state-policy table — verify with the county assessor before closing.
Climate risk First Street
- Flood 1/10 Low FEMA zone X (unshaded) · 0% chance over 30 yrs
- Wildfire 1/10 Low
- Heat 4/10 Moderate 7 d/yr ≥106°F today · 17 d/yr by 30 yrs out
- Wind 2/10 Low
- Air quality 3/10 Moderate 2 unhealthy d/yr today · 3 by 30 yrs out
Nearby sold comps map
Loading sold comps map…
Walkable amenities ~0.75 mi
Loading nearby amenities…
Taxation est. · year 1
- Rental income
- $23,577
- − Mortgage interest
- −$13,164
- − Property taxes
- −$3,756
- − Insurance
- −$1,175
- − Repairs & maintenance
- −$1,886
- − Management
- −$1,886
- − HOA
- −$456
- − Depreciation
- −$6,836
- Taxable loss
- −$5,582
- Est. tax savings @ 24.0%
- +$1,340
- After-tax cash flow
- $-210/yr
For passive investors: Depreciation is non-cash, so a rental often shows a tax loss while cash-flowing — sheltering income. Rental losses are passive: they offset passive income freely, and up to $25,000/yr can offset ordinary (W-2) income if you actively participate and your MAGI is under $100k (phasing out to $0 by $150k); unused losses carry forward. On sale, claimed depreciation is recaptured at up to 25%, and gains may owe capital-gains tax (a 1031 exchange can defer both). Figures are a year-1 estimate at your 24.0% rate — not tax advice; consult a CPA.
Schools (NCES district)
- District
- Park Hill
- NCES district ID
- 2923550
- Math proficiency
- 47% ▼ -3.00%
- Reading proficiency
- 54% ▼ -3.00%
- Median HH income
- $67,616
- Composite
- 44.86/100
- National rank
- #2723
- State rank
- #26 of 324 in MO
Livability — Houston Lake
- Score
- 76/100
- State rank
- #46
- US rank
- #3625
Category grades
Schools grade is shown separately in the Schools card above.
Census & demographics
- Census place
- Houston Lake, MO
- County
- Platte County · 100,198 people
- Metro
- Kansas City, MO-KS
- Population (ZIP)
- 28,526
- Household income
- $92,876
- Rent vs Own
- Severe rent burden
- 1013.0
Population outlook (Platte County) Hauer SSP2
- Today (2025)
- 111,772 people
- By 2030
- 119,173 · +6.6%
- By 2040
- 133,326 · +19.3%
- By 2050
- 146,617 · +31.2%
- By 2075
- 178,626 · +59.8%
- By 2100
- 195,638 · +75.0%
Race, ethnicity, and origin ACS 2023
- Neighborhood character
- Predominantly White (72%)
- Race & ethnicity
- White 72% Black 12% Hispanic / Latino 8% Two or more races 8% Asian 2%
- Hispanic origin (detail)
- Mexican 4%
- Common ancestry
- Italian 3% Romanian 2% Slovak 2%
- Foreign-born
- 7% · Canada
- Languages at home
- 91% English-only · Spanish 4% Other Asian/Pacific 1% Russian/Polish/Slavic 1%
Political lean MEDSL · Platte
- 2024 margin
- Toss-up / Even · D 47.7% · R 50.8% · Other 1.4%
- 2008→2024 swing
- +3.2pp toward D · 2008: -6.4pp · 2024: -3.1pp
- All cycles
- 2024: R+3.1 2020: R+3.0 2016: R+13.0 2012: R+14.2 2008: R+6.4
Not yet ingested
- Civics
- —
Market trends
- HPI YoY
- ▼ -225.06%
- Current HPI
- 241.6626
- Rent YoY
- ▲ 4.80%
- Metro
- Kansas City, MO-KS
- State GDP YoY
- ▲ 1.84%
- F500 in state
- 20
Industry mix (Fortune 500 HQ in MO)
| Industry | F500 HQs | Revenue |
|---|---|---|
| Healthcare | 1 | $163B |
|
||
| Insurance | 1 | $21B |
|
||
| Industrial Technology | 1 | $17B |
|
||
| Retail | 1 | $16B |
|
||
| Industrial Distribution | 1 | $10B |
|
||
| Utilities | 1 | $9B |
|
||
Price history
+145.2% since first listed11 events — show timeline
- 2026-06-16 Relisted — Heartland MLS as Distributed by MLS Grid
- 2026-05-28 Listing Removed — Heartland MLS as Distributed by MLS Grid
- 2026-05-15 Listed $235,000 Heartland MLS as Distributed by MLS Grid
- 2026-05-14 Coming Soon $235,000 Heartland MLS as Distributed by MLS Grid
- 2010-04-14 Sold (Public Records) — Public Records
- 2010-04-09 Sold (MLS) — Heartland MLS as Distributed by MLS Grid
- 2008-09-11 Listed $69,000 Heartland MLS as Distributed by MLS Grid
- 2005-12-20 Sold (MLS) — Heartland MLS as Distributed by MLS Grid
- 2005-08-15 Listed $99,900 Heartland MLS as Distributed by MLS Grid
- 2001-12-09 Sold (MLS) — Heartland MLS as Distributed by MLS Grid
- 2001-10-25 Listed $95,850 Heartland MLS as Distributed by MLS Grid
Property tax history
+4.0%/yrLatest (2025): $3,756 · +3.9% YoY. Source: county tax records.
Cash-flow waterfall
monthlySold comps — $/sqft
last 12 mo · ≤1 miLoading sold comps…