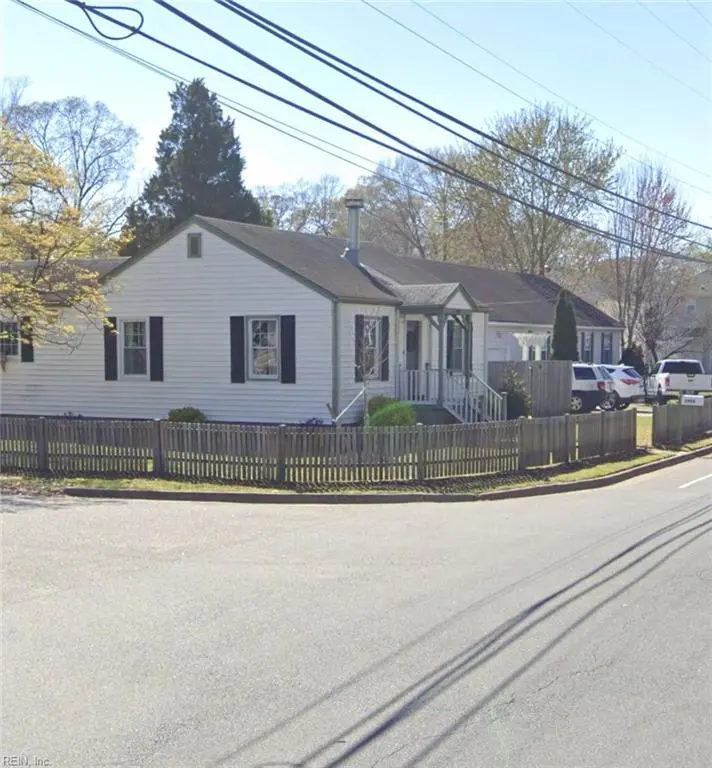
3909 Rokeby Ave · Chesapeake, VA
Flood risk 1/10 · Minimal
- FEMA flood zone
- X (unshaded)
- Chance of flooding over 30 yrs
- 0.0%
- Est. flood insurance / yr
- $507 – $1,088
Fire risk 3/10 · Minor
- Est. fire insurance / yr
- $666 – $1,236
Heat risk 9/10 · Severe
- Hot days now (above 105°F)
- 7 days/yr
- Hot days in 30 yrs
- 16 days/yr
Wind risk 8/10 · Major
- Chance of severe wind over 30 yrs
- 80.0%
Air-quality risk 5/10 · Moderate
- Unhealthy air days now
- 7 days/yr
- Unhealthy air days in 30 yrs
- 7 days/yr
Risk factors via First Street. Map © Google.
Why this score? — see what drove the B- grade
The composite is a weighted blend of 9 inputs, each scored 0–100. Each bar is that input's sub-score; the figure is the points it added to the 100-point composite (weight × sub-score).
- Cash flow +29.4/30.0
- DSCR +10.0/10.0
- 1% rule +8.4/10.0
- ARV discount +7.5/15.0
- Schools +5.8/10.0
- Livability +3.5/5.0
- Rent growth +2.5/5.0
- Condition / age +2.5/5.0
- Appreciation +0.0/10.0
$147,500
🖨 Deal sheet (PDF) 📄 Offer letter ✓ Due diligence
Listing remarks
Small ranch home in established neighborhood. Investor special
Key facts
- Garage
- Built 1950
Property features AI
Finance
- HOA & community: No HOA fees indicated
Exterior
- Parking: Detached 1-car garage
- Utilities: City/County water; City/County sewer; Electric water heater; Electric power
- Home design: Detached ranch; Single-story; Crawl foundation
- Construction: Vinyl exterior; Crawl foundation; Asphalt shingle roof
- Exterior features: Patio; Vinyl siding; Asphalt shingle roof
Interior
- Kitchen: Kitchen
- Bedrooms: Master bedroom; Additional bedroom; Bedroom and full bathroom on first floor
- Flooring: Carpet
- Bathrooms: One full bathroom
- Heating & cooling: Electric heating; Central air conditioning
- Interior features: Ceiling fan; Carpet flooring
- Laundry & utility: Utility room
Neighborhood map
What this means for you Summary
Snapshot
- This is a 2-bed/1.0-bath single-family listed at $148k.
Deal economics
- At list price, monthly cash flow is $522 ($6k/yr) — positive.
- The deal already cash-flows at list — no discount required.
- Meets the 1% rule at list price ($2k rent vs $148k).
- Cap rate 10.5% vs local median 3.7% in Chesapeake — top-decile yield for the area; either an underpriced asset or a hidden risk that comps aren't pricing in. Stress-test before assuming the spread holds.
Location & tenants
- Location reads 70/100 on livability (#236 in VA) — a middle-class / working-renter tenant base. Strengths: employment A+, housing A+; Watch: crime C-, cost of living C-, amenities F.
- Chesapeake City Public School District (suburban): math 58% / reading 74% proficiency, ranked #31 of 131 in VA (top 24%) — acceptable for families but not a draw, mixed tenant base, ~2y average lease.
- Zoned schools: Norfolk Highlands Primary (math 57% / reading 57%, grade C+, #597 of 1,108 statewide, top 57%, 284 students, 90% FRL); Indian River High (math 69% / reading 73%, grade B+, #146 of 319 statewide, top 47%, 1,701 students, 71% FRL) — zoned schools average 81% FRL vs 28% district-wide (53 pts higher); higher-poverty schools than district average — tighter screening recommended.
- Market conditions: 62 active listings in the ZIP; 19 comparable units currently listed for rent nearby; rentals at typical pace (median 16d on market — plan ~3-4 weeks tenant-placement turnaround); 597 units permitted in Chesapeake city in 2024 (0 in 5+ unit buildings).
- This rent runs 34% of the median local income ($70k/yr) — at the standard rent-burdened threshold; future hikes will face affordability resistance.
Forward outlook
- Local home prices are declining (-3.0%/yr); year-one equity from $1k of loan paydown is wiped out by about $4k of value loss. Plan a longer hold.
- Chesapeake County population projected at +21% by 2050 — long-run rental-demand tailwind backs the buy-and-hold thesis.
- At projected returns (-3.0% appreciation + 3.0% rent growth), your $41k cash investment doubles in ~8 years — after that, you're playing with house money.
Negotiation context
- Only 1 days on market — expect competitive offers; lowballing is unlikely to land.
Risks & watch-outs
- Watch-outs: built in 1950 — expect roof / HVAC / electrical / plumbing capex.
- Climate carrying-cost: severe wind risk, 80% chance of damaging wind over 30y; extreme-heat days projected 7→16/yr by 2055 (HVAC capex compounding) — expect insurance premiums to compound above CPI over the hold.
Questions for the listing agent
- Built in 1950 — when were the roof, HVAC, electrical panel, plumbing, and water heater last replaced?
- Is there a deadline driving the sale (1031 exchange, divorce, estate, relocation)? That informs how much negotiation room exists.
- Schools are A-rated — typically a magnet for longer-tenancy family renters. What's the average tenant stay here, and is there a school-zone premium baked into asking?
- What's the average days-on-market for RENTAL listings here right now (not sales)? A rising rental-DOM trend means longer vacancies and softer asking-rent achievability than the comps imply.
- What's the recent tenant-quality profile in this submarket — average credit score on applications, eviction rate, late-payment / NSF rate, and stable-employment percentage? A property-management company in the area should have these aggregated.
- How much new for-sale + rental construction is in the pipeline within 1–3 miles? Heavy new supply typically softens prices + rents 12–24 months out; constrained supply supports both.
Investment metrics
- 1% rule
- 1.34% ✓
- Cap rate
- 10.54%
- Cash-on-cash
- 15.17%
- DSCR
- 1.67
- GRM
- 6.2
CMA / ARV
- ARV (on-the-fly)
- $327,669
- Comps found
- 12
Show comp detail 12 sales within ~0.75 mi
| Address | Dist | Beds/Ba | Sqft | Sold | Price | $/sf | Match |
|---|---|---|---|---|---|---|---|
| 2445 Lindbergh Ave | 0.22mi | 3/1.5 (+1) | 1,344 (-2%) | 2mo | $266,000 | $198 | 77 |
| 3409 Mcneal Ave | 0.35mi | 3/2.0 (+1) | 1,377 (+0%) | 1mo | $399,000 | $290 | 73 |
| 1432 Chestnut Ave | 0.37mi | 3/2.5 (+1) | 1,380 (+1%) | 1mo | $340,000 | $246 | 70 |
| 1507 Rokeby Ave | 0.12mi | 3/2.0 (+1) | 1,232 (-10%) | 2mo | $300,500 | $244 | 66 |
| 1515 Linden Ave | 0.28mi | 3/1.5 (+1) | 1,275 (-7%) | 3mo | $335,000 | $263 | 66 |
| 4311 Emporia Ct | 0.67mi | 3/1.0 (+1) | 1,320 (-4%) | 1mo | $315,000 | $239 | 57 |
| 1620 Elm Ave | 0.37mi | 3/2.0 (+1) | 1,508 (+10%) | 2mo | $284,900 | $189 | 55 |
| 1601 Wood Ave | 0.39mi | 3/2.0 (+1) | 1,500 (+9%) | 2mo | $353,000 | $235 | 55 |
| 1109 Santeetlah Ave | 0.71mi | 3/1.0 (+1) | 1,296 (-6%) | 1mo | $243,000 | $188 | 52 |
| 1229 Elder Ave | 0.46mi | 3/2.0 (+1) | 1,222 (-11%) | 3mo | $374,000 | $306 | 49 |
| 1717 Sparrow Rd | 0.54mi | 3/2.0 (+1) | 1,573 (+15%) | 2mo | $335,500 | $213 | 40 |
| 4315 Towanda Rd | 0.69mi | 3/1.5 (+1) | 1,200 (-12%) | 0mo | $279,114 | $233 | 40 |
Match score weights: distance 35% · size 25% · config 20% · recency 20%. Top-matched comps best support the ARV.
Projected returns pro-forma
-3.0% appreciation · 3.0% rent growth · sell at horizon
- IRR
- 5.8%
- Equity multiple
- 1.23×
- Total profit
- $9,391
- Equity at exit
- $21,993
- IRR
- 15.3%
- Equity multiple
- 2.24×
- Total profit
- $51,159
- Equity at exit
- $12,753
Cash invested: $41,300 (down + closing). Projections, not guarantees.
Landlord ↔ Tenant lean methodology
- Overall (STATE)
- 55 Moderately Landlord-Leaning
- State Virginia
- 55 Moderately Landlord-Leaning · D+2
- County
- — inherits STATE
- City
- — inherits STATE
ZIP-level market 23325
- Active inventory
- 62
- Price-to-rent
- 6.2×
Monthly cashflow live
- Estimated rent
- $1,972 high interval (Pro) →
- Mortgage (P&I)
- −$774
- Tax from tax record
- −$201 /mo · $2,412/yr
- Insurance
- −$61
- HOA
- −$0
- Vacancy / Maint / Mgmt
- −$414
- Net cashflow
- $522
Break-even live
Sensitivity live
| Price | -10% $606 | -5% $564 | +0% $522 | +5% $480 | +10% $439 |
|---|---|---|---|---|---|
| Rent | -10% $366 | -5% $444 | +0% $522 | +5% $600 | +10% $678 |
| Rate | -1.0pp $596 | -0.5pp $560 | base $522 | +0.5pp $484 | +1.0pp $445 |
UW: 25.0% down · 7.5% · 30yr · 1.5% tax · 5.0% vac · 8.0% maint · 8.0% mgmt
Financing live
Cash to close
- Down payment
- $36,875
- Closing costs
- $4,425
- Reserves months
- —
- Total cash needed
- —
Loan-product check · same deal, 3 products live
Conventional
25% down · 7.5% · 30yr
- Down + closing
- —
- Monthly P&I
- —
- Monthly cashflow
- —
- DSCR
- —
- Eligible?
- —
Personal DTI + credit; lowest rate.
DSCR
20% down · 8.5% · 30yr
- Down + closing
- —
- Monthly P&I
- —
- Monthly cashflow
- —
- DSCR
- —
- Eligible?
- —
No personal income docs; deal must DSCR.
Hard money
10% down · 12.0% · 12mo
- Down + closing
- —
- Monthly P&I
- —
- Monthly cashflow
- —
- DSCR
- —
- Eligible?
- —
Short-term bridge; refi at stabilization.
Rent comps 19 comps
| Address | Beds | Baths | Sqft | Rent | $/sqft | DOM | Units | Dist |
|---|---|---|---|---|---|---|---|---|
| 1424 Hawthorne Dr Chesapeake, VA | 3.0 | 2.0 | 1484 | $2,000 | $1.35 | 8d | 1 | 0.24mi |
| 1407 Hawthorne Dr Chesapeake, VA | 2.0 | 1.0 | 980 | $1,025 | $1.05 | 22d | 1 | 0.31mi |
| 1418 Willow Ave Unit A Chesapeake, VA | 2.0 | 1.0 | 1000 | $1,550 | $1.55 | 24d | 1 | 0.32mi |
| 1712 Weber Ave Chesapeake, VA | 3.0 | 2.5 | 1704 | $2,200 | $1.29 | 8d | 1 | 0.57mi |
| 1940 Weber Ave Chesapeake, VA | 3.0 | 2.0 | 1600 | $1,995 | $1.25 | 24d | 1 | 0.83mi |
| 6442 Duquesne Pl Virginia Beach, VA | 3.0 | 1.5 | 1524 | $1,995 | $1.31 | 12d | 1 | 1.01mi |
| 6442 Duquesne Pl Virginia Beach, VA | 3.0 | 1.5 | 1524 | $1,995 | $1.31 | 8d | 1 | 1.01mi |
| 2213 Sparrow Rd Chesapeake, VA | 3.0 | 2.0 | 1248 | $2,300 | $1.84 | 18d | 1 | 1.10mi |
| 6324 Rockbrook Ln Virginia Beach, VA | 1.0–2.0 | 1.0–2.0 | 964 | $2,165 | $2.25 | 4d | 20 | 1.13mi |
| 1257 Jadens Way Chesapeake, VA | 3.0 | 3.0 | 1726 | $2,550 | $1.48 | 15d | 1 | 1.13mi |
| 2638 King Ct Chesapeake, VA | 3.0 | 1.5 | 1462 | $2,000 | $1.37 | 21d | 1 | 1.15mi |
| 2540 Holly Point Blvd Chesapeake, VA | 1.0–3.0 | 1.0–2.0 | 1250 | $2,255 | $1.80 | 2d | 20 | 1.15mi |
| 2620 Sunrise Ave Chesapeake, VA | 3.0 | 1.5 | 1462 | $1,850 | $1.27 | 24d | 1 | 1.17mi |
| 2403 Trafton Pl Unit 1 Chesapeake, VA | 3.0 | 2.5 | 1739 | $2,800 | $1.61 | 2d | 1 | 1.18mi |
| 2416 Trafton Pl Chesapeake, VA | 3.0 | 2.5 | 1750 | $2,800 | $1.60 | 18d | 1 | 1.20mi |
| 67 King George Quay Chesapeake, VA | 3.0 | 1.5 | 1298 | $1,900 | $1.46 | 5d | 1 | 1.27mi |
| 2502 Fieldsway Dr Chesapeake, VA | 3.0 | 2.5 | 1860 | $2,550 | $1.37 | 15d | 1 | 1.31mi |
| 6308 Blakely Sq Virginia Beach, VA | 1.0–3.0 | 1.0–2.0 | 1036 | $2,164 | $2.09 | 3d | 17 | 1.37mi |
| 1221 Clydesdale Ln Virginia Beach, VA | 2.0 | 1.5 | 1120 | $1,800 | $1.61 | 24d | 1 | 1.49mi |
Listing history 3 events
-
2026-05-21status Under Contract
-
2026-05-20$147,500 Active
-
2009-04-02soldstatus $155,000
ⓘ Source: listings_history table (triggers on properties + properties_extension) + one-shot
backfill from property_details.listing_events for pre-trigger history.
Tax reassessment forecast VA · Resets to sale price
- Current annual tax
- $2,412 · $201/mo
- Projected year-2 tax
- $2,412 · $201/mo
- Expected delta
- $0/yr ($0/mo · 0.0%)
ⓘ Screening estimate from a state-policy table — verify with the county assessor before closing.
Climate risk First Street
- Flood 1/10 Low FEMA zone X (unshaded) · 0% chance over 30 yrs
- Wildfire 3/10 Moderate
- Heat 9/10 Extreme 7 d/yr ≥105°F today · 16 d/yr by 30 yrs out
- Wind 8/10 Severe 80% chance of damaging wind over 30 yrs
- Air quality 5/10 Major 7 unhealthy d/yr today · 7 by 30 yrs out
Nearby sold comps map
Loading sold comps map…
Walkable amenities ~0.75 mi
Loading nearby amenities…
Taxation est. · year 1
- Rental income
- $23,667
- − Mortgage interest
- −$8,262
- − Property taxes
- −$2,412
- − Insurance
- −$738
- − Repairs & maintenance
- −$1,893
- − Management
- −$1,893
- − Depreciation
- −$4,291
- Taxable income
- $4,177
- Est. tax owed @ 24.0%
- −$1,003
- After-tax cash flow
- $5,263/yr
For passive investors: Depreciation is non-cash, so a rental often shows a tax loss while cash-flowing — sheltering income. Rental losses are passive: they offset passive income freely, and up to $25,000/yr can offset ordinary (W-2) income if you actively participate and your MAGI is under $100k (phasing out to $0 by $150k); unused losses carry forward. On sale, claimed depreciation is recaptured at up to 25%, and gains may owe capital-gains tax (a 1031 exchange can defer both). Figures are a year-1 estimate at your 24.0% rate — not tax advice; consult a CPA.
Schools (NCES district)
- District
- Chesapeake City Public School District
- NCES district ID
- 5100810
- Math proficiency
- 58% ▼ -29.00%
- Reading proficiency
- 74% ▼ -7.00%
- Median HH income
- $69,356
- Composite
- 57.84/100
- National rank
- #1047
- State rank
- #31 of 131 in VA
Livability — Chesapeake
- Score
- 70/100
- State rank
- #236
- US rank
- #7942
Category grades
Schools grade is shown separately in the Schools card above.
Census & demographics
- Census place
- Chesapeake, VA
- County
- Chesapeake City · 253,091 people
- City population
- 253,091
- Metro
- Virginia Beach-Norfolk-Newport News, VA-NC
- Population (ZIP)
- 19,138
- Household income
- $69,909
- Rent vs Own
- Severe rent burden
- 755.0
Population outlook (Chesapeake County) Hauer SSP2
- Today (2025)
- 263,804 people
- By 2030
- 276,798 · +4.9%
- By 2040
- 299,906 · +13.7%
- By 2050
- 318,284 · +20.7%
- By 2075
- 362,137 · +37.3%
- By 2100
- 372,225 · +41.1%
Race, ethnicity, and origin ACS 2023
- Neighborhood character
- Diverse neighborhood (Simpson 0.63)
- Race & ethnicity
- Black 45% White 40% Hispanic / Latino 7% Two or more races 7% Asian 4%
- Hispanic origin (detail)
- Mexican 2% Puerto Rican 2%
- Common ancestry
- Lithuanian 2% Italian 2% Serbian 1%
- Foreign-born
- 6% · Canada, China, Vietnam
- Languages at home
- 91% English-only · Spanish 3% Other Indo-European 2% Vietnamese 1%
Political lean MEDSL · Chesapeake
- 2024 margin
- Toss-up / Even · D 51.3% · R 47.5% · Other 1.2%
- 2008→2024 swing
- +2.5pp toward D · 2008: 1.3pp · 2024: 3.8pp
- All cycles
- 2024: D+3.8 2020: D+6.5 2016: R+1.3 2012: D+1.1 2008: D+1.3
Not yet ingested
- Civics
- —
Market trends
- HPI YoY
- ▼ -252.24%
- Current HPI
- 309.2112
- Rent YoY
- —
- Metro
- Virginia Beach-Norfolk-Newport News, VA-NC
- State GDP YoY
- ▲ 2.40%
- F500 in state
- 50
Industry mix (Fortune 500 HQ in VA)
| Industry | F500 HQs | Revenue |
|---|---|---|
| Aerospace / Defense | 4 | $236B |
|
||
| Technology / Defense | 3 | $32B |
|
||
| Financial Services | 2 | $176B |
|
||
| Utilities | 2 | $27B |
|
||
| Insurance | 2 | $25B |
|
||
| Technology | 2 | $15B |
|
||
Price history
-4.8% since first listed3 events — show timeline
- 2026-05-21 Pending — REINMLS
- 2026-05-20 Listed $147,500 REINMLS
- 2009-04-02 Sold (Public Records) $155,000 Public Records
Property tax history
+2.6%/yrLatest (2025): $2,412 · +6.3% YoY. Source: county tax records.
Cash-flow waterfall
monthlySold comps — $/sqft
last 12 mo · ≤1 miLoading sold comps…