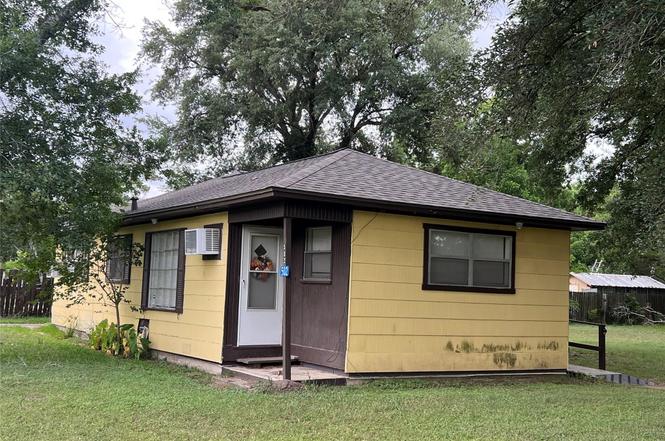
502 N Liberty St · El Campo, TX
Flood risk 6/10 · Moderate
- FEMA flood zone
- X (shaded)
- Chance of flooding over 30 yrs
- 0.68%
- Est. flood insurance / yr
- $507 – $1,088
Fire risk 3/10 · Minor
- Est. fire insurance / yr
- $1,222 – $2,270
Heat risk 9/10 · Severe
- Hot days now (above 110°F)
- 7 days/yr
- Hot days in 30 yrs
- 22 days/yr
Wind risk 9/10 · Severe
- Chance of severe wind over 30 yrs
- 99.0%
Air-quality risk 1/10 · Minimal
- Unhealthy air days now
- 0 days/yr
- Unhealthy air days in 30 yrs
- 0 days/yr
Risk factors via First Street. Map © Google.
Why this score? — see what drove the D+ grade
The composite is a weighted blend of 9 inputs, each scored 0–100. Each bar is that input's sub-score; the figure is the points it added to the 100-point composite (weight × sub-score).
- Cash flow +15.6/30.0
- ARV discount +10.4/15.0
- DSCR +4.8/10.0
- 1% rule +4.5/10.0
- Livability +3.7/5.0
- Schools +3.5/10.0
- Rent growth +2.5/5.0
- Condition / age +2.5/5.0
- Appreciation +0.0/10.0
$160,000
🖨 Deal sheet (PDF) 📄 Offer letter ✓ Due diligence
Listing remarks MLS
Come check out this beautiful home in El Campo, TX that sits on a half acre lot with a huge backyard, two driveways, one going to a detached garage with added barns/workshops. Plenty of room for storage, mancave, park your boat or RV. Another driveway on the opposite side of the property for additional parking. This cute home offers natural hardwood floors, brand new carpet in the 3 bedrooms, tile in the bathroom a huge living/dining combo just inside the front door and a nice large kitchen with plenty of cabinet space and a pantry. Bathroom has nice size stand up shower with newer tile work as well. One of the bedrooms is separated from the others with an exterior door, (currently being used as second living area. ) The kitchen has recently been freshened up with new paint, hardware, counter tops and tile backsplash and also has a pantry and pass through window to the living room. Come check this one out before it's gone!
Key facts
- Extra storage space
- Oversized yard
- Room for parking
Tags
Property features AI
Finance
- Other: Lease not considered
Exterior
- Parking: Detached carport; Carport with 1 space
- Utilities: Public water; Public sewer
- Home design: Residential property; Built in 1945; Single-story entry (first level rooms shown)
- Construction: Wood siding; Composition roof; Pillar/post/pier foundation
- Exterior features: Subdivision lot
Interior
- Kitchen: Electric oven; Electric range; Ice maker
- Bedrooms: Bedroom on first level (14 x 12); Bedroom on first level (11 x 9); Bedroom on first level (18 x 14)
- Flooring: Carpet; Laminate; Wood
- Bathrooms: 1 full bathroom
- Heating & cooling: Window unit(s) for cooling
- Interior features: Accessible approach with ramp; Ice maker
- Laundry & utility: Washer hookup; Electric dryer hookup
Neighborhood map
What this means for you Summary
Snapshot
- This is a 3-bed/2.0-bath single-family listed at $160k.
Deal economics
- At list price, monthly cash flow is $68 ($822/yr) — positive.
- The deal already cash-flows at list — no discount required.
- To meet the 1% rule (rent ≥ 1% of price), the offer needs to be $152k (4.9% below list).
- Recommended offer: $152k (4.9% below list) — sets the bar for 1% rule.
- Cap rate 6.8% vs local median 3.2% in El Campo — top-decile yield for the area; either an underpriced asset or a hidden risk that comps aren't pricing in. Stress-test before assuming the spread holds.
Location & tenants
- Location reads 73/100 on livability (#204 in TX) — a middle-class / working-renter tenant base. Strengths: cost of living A+, housing A+, health & safety A+; Watch: employment D, crime D-, amenities F.
- El Campo ISD (town): math 44% / reading 38% proficiency, ranked #387 of 826 in TX (top 47%) — families likely to look elsewhere, expect single-tenant / working-renter base with shorter leases; 65% free/reduced lunch — lower-income household profile, screen leases tightly.
- Zoned schools: Northside El (math 53% / reading 38%, grade D-, #1,112 of 4,322 statewide, top 26%, 464 students, 73% FRL); El Campo Middle (math 41% / reading 33%, grade F, #756 of 1,662 statewide, top 47%, 724 students, 74% FRL); El Campo H S (math 37% / reading 45%, grade F, #774 of 1,632 statewide, top 49%, 1,062 students, 60% FRL) — zoned schools at 69% FRL track the district average.
- Market conditions: 154 active listings in the ZIP; 191 units permitted in Wharton County in 2024 (45 in 5+ unit buildings).
Forward outlook
- Local home prices are declining (-3.0%/yr); year-one equity from $1k of loan paydown is wiped out by about $5k of value loss. Plan a longer hold.
Negotiation context
- Only 2 days on market — expect competitive offers; lowballing is unlikely to land.
- 3 sale attempts since 5y ago with the ask held roughly flat each time — persistent listings suggest the price (not the market) is what's stuck; bring a comps-based counter.
Risks & watch-outs
- Watch-outs: built in 1945 — expect roof / HVAC / electrical / plumbing capex.
- Climate carrying-cost: major flood risk; severe wind risk, 99% chance of damaging wind over 30y; extreme-heat days projected 7→22/yr by 2055 (HVAC capex compounding) — expect insurance premiums to compound above CPI over the hold.
Questions for the listing agent
- Built in 1945 — when were the roof, HVAC, electrical panel, plumbing, and water heater last replaced?
- Is there a deadline driving the sale (1031 exchange, divorce, estate, relocation)? That informs how much negotiation room exists.
- Schools are D-rated, which usually means shorter tenancies and higher turnover. Who's the typical renter profile here, and what's been the actual vacancy rate?
- Crime grade is D in this area — have there been break-ins, vandalism, or insurance claims at this property in the last 3 years? What carrier currently insures it and at what premium?
- The area grade is low — what's the realistic commute time and amenity access for the typical tenant pool here? Any planned neighborhood developments (good or bad) we should know about?
- What's the average days-on-market for RENTAL listings here right now (not sales)? A rising rental-DOM trend means longer vacancies and softer asking-rent achievability than the comps imply.
- What's the recent tenant-quality profile in this submarket — average credit score on applications, eviction rate, late-payment / NSF rate, and stable-employment percentage? A property-management company in the area should have these aggregated.
- How much new for-sale + rental construction is in the pipeline within 1–3 miles? Heavy new supply typically softens prices + rents 12–24 months out; constrained supply supports both.
Investment metrics
- 1% rule
- 0.95% ✗
- Cap rate
- 6.81%
- Cash-on-cash
- 1.83%
- DSCR
- 1.08
- GRM
- 8.8
CMA / ARV
- ARV (on-the-fly)
- $171,220
- Comps found
- 2
Show comp detail 2 sales within ~0.75 mi
| Address | Dist | Beds/Ba | Sqft | Sold | Price | $/sf | Match |
|---|---|---|---|---|---|---|---|
| 801 Hayden St | 0.71mi | 3/2.0 | 1,210 (-1%) | 14mo | $159,000 | $131 | 53 |
| 805 Betty St | 0.70mi | 3/1.0 | 1,323 (+8%) | 4mo | $185,000 | $140 | 46 |
Match score weights: distance 35% · size 25% · config 20% · recency 20%. Top-matched comps best support the ARV.
Projected returns pro-forma
-3.0% appreciation · 3.0% rent growth · sell at horizon
- IRR
- -13.4%
- Equity multiple
- 0.52×
- Total profit
- $-21,525
- Equity at exit
- $23,857
- IRR
- -4.4%
- Equity multiple
- 0.71×
- Total profit
- $-12,965
- Equity at exit
- $13,834
Cash invested: $44,800 (down + closing). Projections, not guarantees.
Landlord ↔ Tenant lean methodology
- Overall (STATE)
- 87 Strongly Landlord-Friendly
- State Texas
- 87 Strongly Landlord-Friendly · R+5
- County
- — inherits STATE
- City
- — inherits STATE
ZIP-level market 77437
- Home prices YoY
- -33.6%
- Active inventory
- 154
- Price-to-rent
- 8.8×
Monthly cashflow live
- Estimated rent
- $1,521 medium interval (Pro) →
- Mortgage (P&I)
- −$839
- Tax from tax record
- −$227 /mo · $2,728/yr
- Insurance
- −$67
- HOA
- −$0
- Vacancy / Maint / Mgmt
- −$319
- Net cashflow
- $68
Break-even live
Sensitivity live
| Price | -10% $159 | -5% $114 | +0% $68 | +5% $23 | +10% $-22 |
|---|---|---|---|---|---|
| Rent | -10% $-52 | -5% $8 | +0% $68 | +5% $129 | +10% $189 |
| Rate | -1.0pp $149 | -0.5pp $109 | base $68 | +0.5pp $27 | +1.0pp $-15 |
UW: 25.0% down · 7.5% · 30yr · 1.5% tax · 5.0% vac · 8.0% maint · 8.0% mgmt
Financing live
Cash to close
- Down payment
- $40,000
- Closing costs
- $4,800
- Reserves months
- —
- Total cash needed
- —
Loan-product check · same deal, 3 products live
Conventional
25% down · 7.5% · 30yr
- Down + closing
- —
- Monthly P&I
- —
- Monthly cashflow
- —
- DSCR
- —
- Eligible?
- —
Personal DTI + credit; lowest rate.
DSCR
20% down · 8.5% · 30yr
- Down + closing
- —
- Monthly P&I
- —
- Monthly cashflow
- —
- DSCR
- —
- Eligible?
- —
No personal income docs; deal must DSCR.
Hard money
10% down · 12.0% · 12mo
- Down + closing
- —
- Monthly P&I
- —
- Monthly cashflow
- —
- DSCR
- —
- Eligible?
- —
Short-term bridge; refi at stabilization.
Listing history 3 events
-
2026-06-19days on market $160,000 Active 2 DOM
-
2026-06-17remarks 445-char remark
-
2026-06-17$160,000 Active 1 DOM
ⓘ Source: listings_history table (triggers on properties + properties_extension) + one-shot
backfill from property_details.listing_events for pre-trigger history.
Tax reassessment forecast TX · Resets to sale price
- Current annual tax
- $2,728 · $227/mo
- Projected year-2 tax
- $2,928 · $244/mo
- Expected delta
- +$200/yr (+$17/mo · 7.3%)
ⓘ Screening estimate from a state-policy table — verify with the county assessor before closing.
Climate risk First Street
- Flood 6/10 Major FEMA zone X (shaded) · 68% chance over 30 yrs
- Wildfire 3/10 Moderate
- Heat 9/10 Extreme 7 d/yr ≥110°F today · 22 d/yr by 30 yrs out
- Wind 9/10 Extreme 99% chance of damaging wind over 30 yrs
- Air quality 1/10 Low 0 unhealthy d/yr today · 0 by 30 yrs out
Nearby sold comps map
Loading sold comps map…
Walkable amenities ~0.75 mi
Loading nearby amenities…
Taxation est. · year 1
- Rental income
- $18,251
- − Mortgage interest
- −$8,962
- − Property taxes
- −$2,728
- − Insurance
- −$800
- − Repairs & maintenance
- −$1,460
- − Management
- −$1,460
- − Depreciation
- −$4,655
- Taxable loss
- −$1,814
- Est. tax savings @ 24.0%
- +$435
- After-tax cash flow
- $1,257/yr
For passive investors: Depreciation is non-cash, so a rental often shows a tax loss while cash-flowing — sheltering income. Rental losses are passive: they offset passive income freely, and up to $25,000/yr can offset ordinary (W-2) income if you actively participate and your MAGI is under $100k (phasing out to $0 by $150k); unused losses carry forward. On sale, claimed depreciation is recaptured at up to 25%, and gains may owe capital-gains tax (a 1031 exchange can defer both). Figures are a year-1 estimate at your 24.0% rate — not tax advice; consult a CPA.
Schools (NCES district)
- District
- El Campo ISD
- NCES district ID
- 4818280
- Math proficiency
- 44% ▼ -2.00%
- Reading proficiency
- 38% ▲ 1.00%
- Median HH income
- $44,351
- Composite
- 34.82/100
- National rank
- #5102
- State rank
- #387 of 826 in TX
Livability — El Campo
- Score
- 73/100
- State rank
- #204
- US rank
- #5196
Category grades
Schools grade is shown separately in the Schools card above.
Census & demographics
- City population
- 18,886
- Population (ZIP)
- 18,886
Population outlook (Wharton County) Hauer SSP2
- Today (2025)
- 42,448 people
- By 2030
- 42,726 · +0.7%
- By 2040
- 43,042 · +1.4%
- By 2050
- 43,368 · +2.2%
- By 2075
- 44,962 · +5.9%
- By 2100
- 44,510 · +4.9%
Race, ethnicity, and origin ACS 2023
- Neighborhood character
- Diverse neighborhood (Simpson 0.56)
- Race & ethnicity
- Hispanic / Latino 50% White 44% Two or more races 18% Black 6%
- Hispanic origin (detail)
- Mexican 45%
- Common ancestry
- Italian 1% Lithuanian 1% Slovak 1%
- Foreign-born
- 10% · Canada
- Languages at home
- 67% English-only · Spanish 32%
Political lean MEDSL · Wharton
- 2024 margin
- Solid R (+51.8) · D 23.8% · R 75.6%
- 2008→2024 swing
- -20.7pp toward R · 2008: -31.2pp · 2024: -51.8pp
- All cycles
- 2024: R+51.8 2020: R+43.1 2016: R+40.2 2012: R+39.1 2008: R+31.2
Not yet ingested
- Civics
- —
Market trends
- HPI YoY
- ▼ -91.78%
- Current HPI
- 181.5905
- Rent YoY
- —
- Metro
- —
- State GDP YoY
- ▲ 3.95%
- F500 in state
- 110
Industry mix (Fortune 500 HQ in TX)
| Industry | F500 HQs | Revenue |
|---|---|---|
| Energy | 16 | $1,198B |
|
||
| Technology | 5 | $198B |
|
||
| Engineering / Construction | 4 | $72B |
|
||
| Energy Services | 3 | $60B |
|
||
| Utilities | 3 | $41B |
|
||
| Healthcare | 2 | $330B |
|
||
Price history
+23.2% since first listed9 events — show timeline
- 2026-06-17 Listed $160,000 HARMLS
- 2025-06-03 Rental Removed $1,250 HARMLS
- 2025-05-20 Listed for Rent $1,250 HARMLS
- 2021-05-24 Sold (Public Records) — Public Records
- 2021-05-14 Sold (MLS) — HARMLS
- 2021-03-18 Pending — HARMLS
- 2021-03-06 Pending — HARMLS
- 2021-01-22 Price Changed $126,900 HARMLS
- 2021-01-07 Listed $129,900 HARMLS
Property tax history
+11.0%/yrLatest (2025): $2,728 · +8.1% YoY. Source: county tax records.
Cash-flow waterfall
monthlySold comps — $/sqft
last 12 mo · ≤1 miLoading sold comps…